

Recurrent spontaneous seizures have been considered the sine qua non of epilepsy. Epileptic seizures were first associated with intense electrical activity measured from the brain in 1933 1. Spreading depression of brain activity was discovered by Leão in 1944 2, and has since been shown associated with migraine, stroke and traumatic brain injury 3,4. Although for many years spreading depression was thought to have only rare genetic links to epilepsy 5, recently it has been proposed that seizure-triggered spreading depression could underlie sudden unexplained death in epilepsy (SUDEP) 6. The physiological underpinning of spreading depression is an electrical spreading depolarization (SD) of brain cells. The depolarization is associated with a large, prolonged negative shift in tissue potential that cannot be well detected with standard human electroencephalographic (EEG) technology. Nevertheless, in recent years, computational models of the dynamics of neuron biophysics have shown a linkage between seizures and SD 7, and have predicted the possibility of dynamic trajectories linking the two phenomena 8. We developed a recording system for chronic, long-term measurements that provides a view of the complex interactions between spontaneous epileptic seizures and spreading depolarizations in the intact brain 9. We here experimentally demonstrate these theoretically predicted trajectories in multiple animal models of epilepsy, showing that spontaneous single seizures are frequently associated with SD, and that SD may mediate between seizures within clusters. We therefore propose that the ictus of epilepsy may be a combination of seizures and SD.
Main
We found, from thousands of days of long-term continuous DC-sensitive chronic recordings, frequent instances of seizure associated SD in two very different chronic animal models of epilepsy: the rat tetanus toxin (TeTX) model of temporal lobe epilepsy (TLE) 10,11 (Fig. 1A) and the murine model of post-cerebral malaria (post-CM) epilepsy 9 (Fig. 1B). Shown in Fig. 1A-B are typical examples of SD following seizures, with the seizures evident from band-pass filtered signals (1-55 Hz) in the upper panels, and the SD from the low-pass filtered signals (< 1 Hz) in the bottom panels. SD either overlapped with (Fig. 1A) or followed (Fig. 1B) the seizure. In both models, the amplitude, duration and propagation between electrodes of the slow shift in tissue electrical potential are consistent with changes in extracellular potential observed during experimentally induced SD in vitro, as shown in Fig. 1C as well as other reports of acute SD 12– 16. During the large negative deflection of the tissue potential in the very low frequency range, we observed marked suppression of EEG activity (Fig. 1A). This is consistent with the spreading depression subtype of SD. The later reappearance of seizure-like spiking activity correlates with the return of the very low-frequency potential to near its baseline value. This pattern is consistent with recovery dynamics from acutely-induced SD termed spreading convulsions 4,17.

(A) Spontaneous seizure with SD activity in the hippocampus of a rat under the TeTX model of temporal lobe epilepsy. During the large negative deflection in DC potential associated with SD (bottom traces), band-pass filtered field potentials (top traces) are suppressed. Filter settings for traces shown: Seizure traces band-pass 1-50 Hz; SD traces low-pass filter below 2 Hz; EPL, ECoG posterior left; EAL, ECoG anterior left; EPR, ECoG posterior right; EAR, ECoG anterior right; HPL, hippocampal posterior left; HAL, hippocampal anterior left; HAR hippocampal anterior right; HPR, hippocampal posterior right; HVR, hippocampal ventral right. (B) Example observed from a mouse model of post-cerebral malaria epilepsy. SD waves are observed in the measured DC potential (bottom traces) from hippocampal leads following a seizure (top traces). Seizure onset and offset are marked by the red and green dashed lines, respectively. The gold line marks the onset of the first seizure-associated SD. Filter settings for traces shown: Seizure traces band-pass 1-50 Hz; SD traces low-pass filter below 2 Hz. DL, depth hippocampus left and DR, depth hippocampus right, ELA, ECoG left anterior, ERA, ECoG right anterior and ELP, ECoG left posterior, ERP, ECoG right posterior. (C) Shape of experimentally induced hippocampal SD (Top; adapted with permission from Canals et al., 2006) and (Bottom, in house slice electrophysiology recordings with the DC-sensitive acquisition system, for more details see Fig. S1).
Although seizure-related SDs often overlapped with demonstrable suppression of EEG activity, we also found post-ictal generalized EEG suppression (PGES) that occurred without concurrent SD (Fig. S2).
The large slow shifts in the tissue potential associated with SD reside in the very low frequency (1-100 mHz) range. Unless a wide digitization range and non-polarizing electrodes with sufficient surface area are used, within these ranges measurements are dominated by electrode-tissue electrochemical polarization driven by the input current of the amplifier. To eliminate the electrochemical-based signal components and to restrict the signal to what could be acquired with a standard digitizer, in most acquisition systems the measurements are high-pass filtered (e.g. > 1 Hz) and therefore slow potential shifts associated with SD are removed 18,19.
To simultaneously measure SD and field potentials we used custom-made micro reaction chamber (µRC) electrodes with electrodeposited iridium oxide films (EIROF) 20 with a direct current (DC)-sensitive acquisition system 9. The fidelity of this recording combination is demonstrated in vitro in Fig. 2. With an applied sinusoidal electric field, we observed only minor signal attenuation with 50 µm (diameter) µRC EIROF (Fig. 2B-C red trace) electrodes at frequencies relevant to SD (0.01 Hz). This is in contrast to 17 µm Nichrome electrodes (Fig. 2B-C black trace), which are included to illustrate that electrodes with poorly matched impedance – to the input impedance of the amplifier – will inherently high-pass filter the tissue potentials.

(A) Schematic of the experimental chamber for in vitro hardware validation. The chamber is built from plexiglass and contains 0.09% saline solution (blue area). The two sides of the chamber are electrically isolated from one another via clay (green area) and the only connection is through a pipette (black lines) that forms a salt bridge. The test electrodes are placed on either side of the chamber in the conductive solution. Two screw electrodes (indicated by the red circles) are used as reference and ground. An electric field is imposed by a set of platinum electrodes (indicated by the gray boxes) on the two sides of the chamber. Test electrodes, reference and ground screws are connected to the acquisition system. The sinusoidal electric field with different frequencies is applied by driving current from an isolated current supply (Analog Stimulus Isolator, AM Systems Model 2200) through platinum plates at either end of the chamber away from the testing electrodes. Testing electrodes are matched pairs of 50 um (in diameter) micro-reaction chamber EIROF, 1 mm x 2.5 mm silver/silver chloride pellets (AM Systems, Catalog #550010), and 17 um Nichrome wires at variable known distances apart. (B) In vitro measurements of phase and amplitude of the electrode potentials across applied near-DC sinusoid electric field. The large Ag/AgCl pellet (blue trace) phase and amplitude follow the sinusoid AC field (gray trace) at all frequencies shown here (0.01, 0.02, 0.04 Hz). While the EIROF electrodes (red trace) show some level of degradation both in phase and amplitude for these very low frequencies, they still sufficiently track the field. However the Nichrome electrodes (black trace) show a large lag and distorted signal. (C) Low frequency sensitivity of the recording system. The EIROF can sense and track the field across a wide range of frequencies with only minor attenuation at very low frequencies, in contrast to the much smaller and higher impedance Nichrome electrode that inherently acts as a high-pass filter for the tissue potentials and shows substantial phase and amplitude distortion.
The measurements in the included animals from both models were sufficiently stable during the entire recording periods – typically more than 2 continuous weeks – to capture similar SD events as presented in Fig. 1. We operationally define “sufficient stability” as having baseline (low-frequency) fluctuations with amplitudes substantially less than 10 mV over hour-long periods. Shown in Fig. S3 are the maximal fluctuations per hour of the unfiltered left hippocampal electrode potential over 8 consecutive days of recording in one epileptic mouse first without seizures (Fig. S3 upper panel) and then with seizure-associated SDs (Fig. S3 bottom panel). For every hour during the seizure-free period (Fig. S3 upper panel), the hippocampal measurements fluctuate smoothly with a maximal range (< 6 mV) much smaller than the >> 10 mV low-frequency potential differences associated with SD episodes. However, the within-hour fluctuations are much larger for the hours with seizures-associated SDs (magenta arrows in Fig. S3 bottom panel). The negative deflection in tissue potential during SD leads to distinct large variations in the recording electrode’s potential. These DC fluctuations associated with SDs are fully separable from steady state potentials and mechanically or electronically induced artifacts.
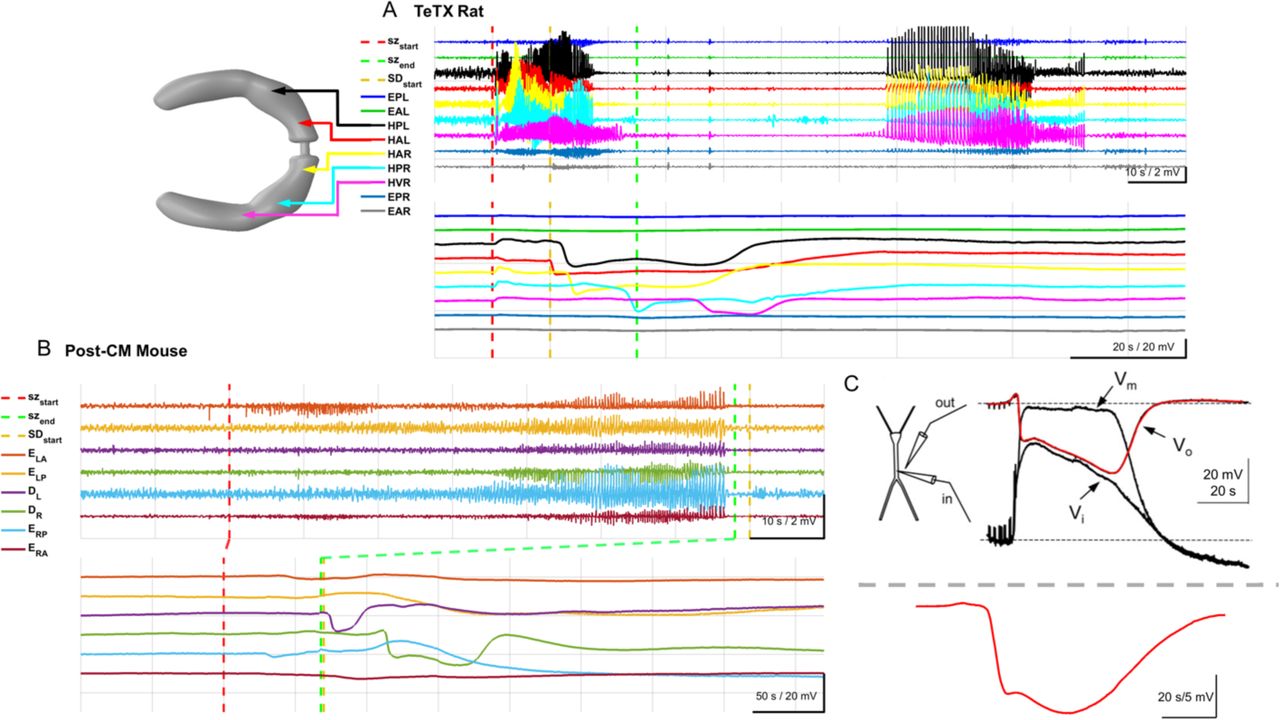
The two animal models of epilepsy utilized in this study are fundamentally different. The TeTX model of temporal lobe epilepsy is induced with intrahippocampal injection of tetanus toxin which creates a focal lesion with modulated neuronal excitability, and produces secondary generalized seizures. In this model seizures emanate from sites throughout ventral hippocampi and generalize to other hippocampal and cortical regions. SDs appeared to originate from variable sites throughout the dorsal-ventral hippocampi (Fig. S4A-C) with occasional episodes of SD invading the cortex (data not shown). SDs often occurred during or at the end of well-spaced seizures (Fig. S4B-C). In seizure clusters SD dynamics appeared to connect the individual seizures (Fig. 3A, and Fig. S4A cyan trace).
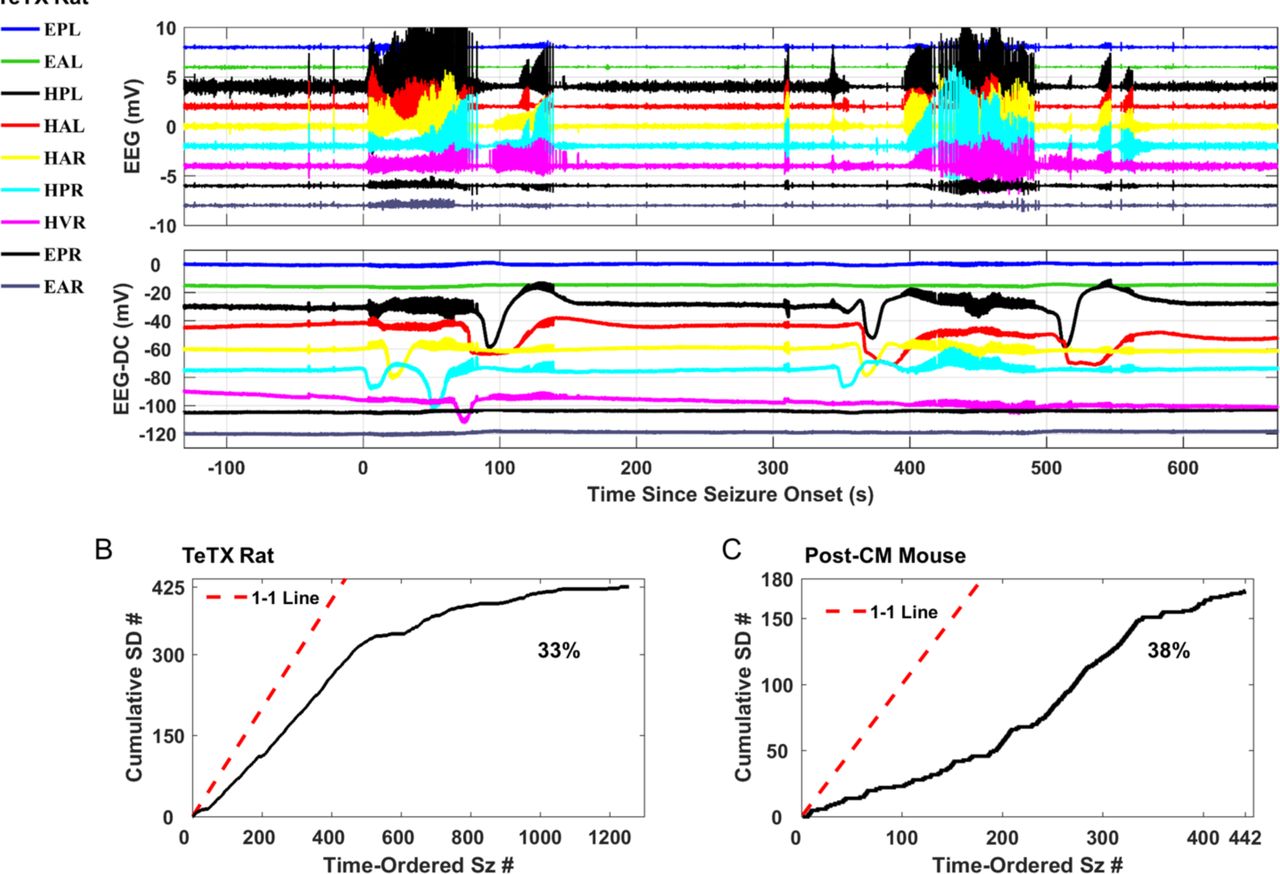
We identified seizure clusters as seizure events occurring within at least 10 minutes of each other. (A) Two seizures occur within 5 minutes with SDs occurring during and prior to seizures; the posterior and anterior left hippocampal leads capture SDs immediately prior to and after the second seizure (HPL and HAL traces). (B, C) Cumulative count of seizure-associated SDs as a function of seizures rank-ordered by time of occurrence in each epileptic model. Seizure-associated SDs occurred in 33% of the collected seizures in epileptic rats (B) and 38% of the collected seizures in epileptic mice (C). Estimated rates have propagated errors less than 2% (see methods).
(Top traces A) Bandpass filtered field potentials. (Bottom traces A) Raw (unfiltered) hippocampal and cortical measurements. Filter settings for traces shown: Seizure traces band-pass 1-50 Hz; SD traces no low-pass filter. EPL; ECoG posterior left, EAL; anterior left, HPL; hippocampal posterior left LFP, HAL; hippocampal anterior left LFP, HAR; hippocampal anterior right LFP, HPR; hippocampal posterior right LFP, HVR; hippocampal ventral right LFP (contralateral side to the tetanus toxin lesion), EPR; ECoG posterior right, EAR; ECoG anterior right.
Across 124 cumulative days of recordings from 5 epileptic rats, 425 of 1256 seizures had co-occurring SD events (estimated rate = 33% ± 1%, see methods for the propagated error) (Fig. 3B). The murine model of post-CM epilepsy 9 mimics human conditions of post-infection acquired epilepsy with long epileptogenesis 21 and spontaneous unprovoked seizures. In this model the brain undergoes widespread damage, and the seizure origins and evolution patterns vary. We observed episodes of SD occurring during or after the seizures in one or both hippocampi (Fig. S5A-C) and/or cortex (Fig. S5D) in 171 of 442 total seizures (estimated rate = 38% ± 2%) (Fig. 3C). Collectively seizures were pooled from 21 epileptic mice with 1139 cumulative days of recordings. The SD pattern was uncorrelated with seizure origin or evolution (Fig. S6A-C), and SD was observed in all four mouse-parasite strain combinations studied (Fig. S6D).
In both animal models and all instances of SD the amplitude of the negative DC deflection, duration of the deflection, propagation, and existence of a quiescence period reflective of neuronal depolarization were consistent with SD characteristics, as was the frequent observation of spiking activity at SD offset 17. The SD events in the TeTX rats were often concurrent with depression of EEG activity. Therefore we mark these SDs as spreading depression subtype of the spreading depolarization phenomenon.
In post-CM epileptic mice, the apparent propagation speed of SD from left to right hippocampus was approximately 6 mm/min. However, within hippocampi in the TeTX rats, with 3-4 hippocampal recording electrodes, the propagation speed of SD measured in the midst of prolonged and spatially extended seizures appears to be faster (6 to 40 mm/min). We hypothesize that, in these cases, the tissue is primed to support faster propagation perhaps analogous to the way that seizure propagation speeds can be parametrically modulated via neuronal excitability 22,23. SD events are shown to generate long bouts of acidosis 24,,25. It is therefore important to note that our observations are not artifacts of the pH dynamics. Although the µRC EIROF electrodes are pH sensitive (26, and as described in Methods), the expected change from SD acidosis yields positive deflections in the electrode potential, and therefore would cancel some of the actual negative shift in tissue potential observed during SD.
In order to confirm the linkage between SD and seizures, we scored data from age-matched control animals who had viable DC recordings for appearance of SD-like events. In rats controls included animals that did not receive TeTX injections (N = 2, 154 cumulative recording days), and rats with TeTX injection that did not develop epilepsy (N = 1, 80 recording days). In mice, control data included uninfected animals with no seizures (N = 17, 820 cumulative recording days), and animals rescued from CM that did not develop seizures (N = 6 mice, 282 cumulative recording days). No SD-like events were observed in any of these groups.
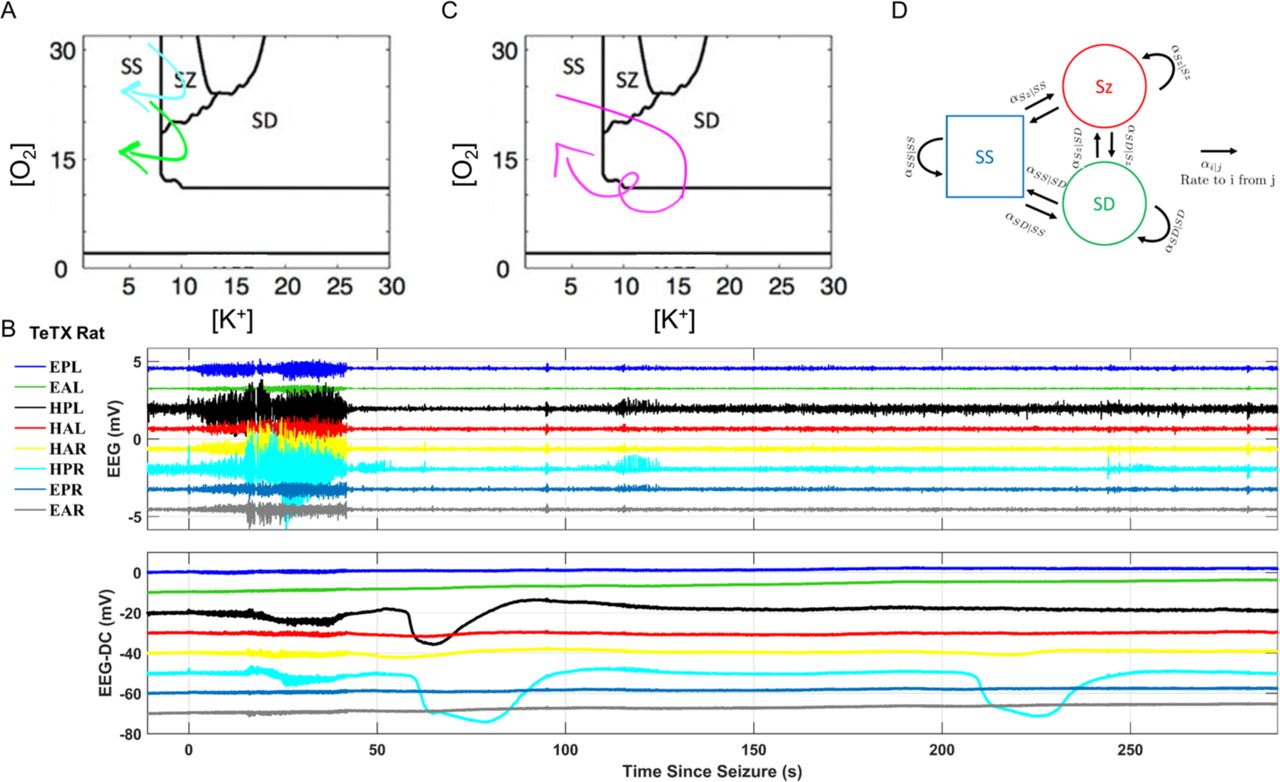
From a rest or steady state, a neuronal system exhibits excitability when in response to small perturbations it takes a dynamical trajectory determined by the presence of bifurcations in its underlying mathematical structure. Such trajectories have been extensively characterized for single neuron spiking 27,28, and with the incorporation of fast sodium and slower potassium dynamics for complex burst and seizure firing dynamics 29,30. The dynamics characteristic of experimental hypoxic seizure patterns can be described by utilizing oxygen as an experimental and theoretical bifurcation parameter 31. Combination of oxygen and potassium as state variables, as well as ion mass and charge conservation and energy balance, uncovers the unification between steady-state, spikes, seizures, and spreading depolarization 7.The subdivision of the dynamics within the oxygen-potassium state space is illustrated in Fig. 4A (adapted from 7). Cellular volume fraction as another bifurcation parameter further separates seizure from spreading depolarization dynamics during trajectories that visit them in sequence 8.
Based on computational models of the neuronal dynamics, the system (brain) can transition between steady state (SS), spreading depolarization (SD), and seizures (SZ). (A, C) Two-parameter bifurcation based on extracellular oxygen and potassium concentrations; adapted from (Wei et al. 2014). Experimental measurements are described by state-space trajectories such as SS→SZ→SS (cyan arrow in A), SS→SZ→SD→SS (green arrow in A and traces in Fig. 1A, Fig. S1B-C), and SS→SZ→SD→SS→SD→SS (magenta arrow in C, and cyclic SD in traces in B). These transitions can be cast into a discrete state transition model (D) to further calculate the transition probabilities based on variables such as extracellular oxygen, potassium concentrations, and cellular volume fraction (Ullah et al., 2015).
(Top traces B) Bandpass filtered field potentials. (Bottom traces B) Raw (unfiltered) hippocampal and cortical measurements. Filter settings for traces shown: Seizure traces band-pass 1-50 Hz; SD traces no low-pass filter. EPL; ECoG posterior left, EAL; anterior left, HPL; hippocampal posterior left LFP, HAL;hippocampal anterior left LFP, HAR; hippocampal anterior right LFP, HPR; hippocampal posterior right LFP, EPR; ECoG posterior right, EAR; ECoG anterior right.
If one classifies brain state in our measurements into the discrete states: steady state (SS), seizure (SZ) and SD, then the time series of discrete states can be represented by continuous trajectories through the oxygen-potassium state space illustrated in Fig. 4A&C. Two of the most common state series we observe are represented by the trajectories illustrated in Fig. 4A (SS→SZ→SS in cyan, and SS→SZ→SD→SS in green). Even the transition dynamics observed in Fig. 4B, in which a seizure is followed by repeated SD events, is naturally described by the looping magenta trajectory in Fig. 4C.
Because the state space of the system includes un-represented slow variables such as extracellular volume and vascular tone, trajectories can cross in this two-dimensional projection. Validation of the linkage between such computational modeling and in-vivo observed dynamics can be done through casting the measurement time series into a discrete-state transition model, as illustrated in Fig. 4D, and then statistically correlating the transition probabilities (αi.j) as a function of the modeled state variables, such as tissue oxygen pressure and extracellular potassium.
Our recording system offers, for the first time, the opportunity to investigate the theoretically predicted complex interaction between seizures and spreading depolarizations in an intact brain. Within two fundamentally different animal models of chronic epilepsy, we observed direct transitions and dynamical interplay between SDs and spontaneous seizures. Moreover, in the epileptic rats we often observe that seizures that occur in clusters are connected by SD events (Fig. 3A, Fig. S4A). Our findings suggest that beyond EEG, currently unobserved parameters such as extracellular volume, potassium, and tissue oxygenation are important in orchestrating the dynamics observed in epilepsy. Furthermore we propose an expanded definition for the event or ictus in epilepsy that encompasses dynamical trajectories that combine both seizures and SD, and better account for the electrical and behavioral manifestations during epilepsy.
Methods
All animal work was approved by and performed under administration of Institutional Animal
Care and Use Committee at the Pennsylvania State University.
Post-Cerebral Malaria Epilepsy Model
Infection and Treatment
Donor animals were infected from frozen stocks of Plasmodium berghei ANKA (PbANKA) or Plasmodium berghei NK65 (Pb-NK65) parasite, and blood was drawn on day 7 for inoculation into homologous experimental animals. Swiss Webster (SW), C57BL/6 (Charles Rivers Laboratory) and CBA/CaJ (CBA, Jackson Laboratory) male mice were infected by intraperitoneal injection of infected red blood cells from the donor animal. Age-matched control mice were inoculated with red blood cells from un-infected donor animals, and otherwise received identical drug and monitoring treatment.
Animals were treated by anti-malarial medication, Artesunate (64 mg/kg dosage), for seven days starting from day 5 (C57BL/6-PbANKA or CBA-PbANKA), day 6 (SW-PbANKA) and day 7 (SW-PbNK65) post-infection. We based our treatment plan on observations in human cases where epilepsy is a sequela of well-developed CM rather than cases with early detection and treatment.
Animal Surgery and Care
Animals were implanted with electrodes to monitor brain activity at least five days post-treatment following procedures described in 9. Briefly, four stainless steel screws (#000 self-tapping, Morris Co.) were placed over frontal (AP +1.5, ML ±2.5 mm) and S1 (AP −2.3, ML ±3.5 mm) cortices for measurements of electrocorticogram (ECoG). Two custom-made 50 µm (diameter) ultra-low impedance micro-reaction chamber (µRC)20 electrodes were further enhanced by electrodeposition of iridium oxide films (EIROF)20 to provide DC stability and high charge passing capacity. The electrodes were then implanted bilaterally in dorsal hippocampi (AP −2.3, ML ±2.0, DV −1.5 mm) to provide hippocampal depth recordings. All coordinates were Bregma referenced.
Muscle activity was monitored via a 3 mm long 50 μm gold-plated 316L stainless steel wire placed into a bluntly dissected opening within the nuchal muscles and further secured with polyglycolic acid absorbable sutures through the subcutaneous tissue. A fraction of animals were implanted with a lead in the precordium to monitor electrocardiogram (ECG) activity. Electrodes were then secured in place and electrically isolated via a 3D printed multi-groove headmount embedded in dental cement.
At the completion of the surgery, animals were housed individually in custom-made plexiglass cages each containing two enclosures with dimensions 6”W×12”D×12”H with free access to food and water, and, following recovery, were cabled for continuous video and EEG monitoring. Implanted mice were cabled to the acquisition board which hangs down through a 1.5 inch hole in the ceiling of each enclosure. The board is connected to a custom-made commutator to allow for postural flexibility and free movement of the animals. A 12 hour light-dark cycle was maintained with the lights on between 6 am and 6 pm. During the dark period infrared LED arrays were used to illuminate the cage for continuous 24-hour video monitoring. Synchronized video (at 3 frames per second) and EEG recordings began once the animals were successfully cabled.
Rat Tetanus Toxin Model of Temporal Lobe Epilepsy
Animal Surgery and Care
Male and female Long-Evans rats, weighing 250-350 grams, were implanted with recording electrodes and received tetanus injections during the same surgical procedure following methods described previously 10. In short, to induce epilepsy, 10-13 nano-grams of tetanus toxin (Santa Cruz Biotechnology, CAS 676570-37-9) dissolved in 1.3 microliters PBS mixed with 2% BSA were injected into the left ventral hippocampus (AP −5.15, ML +5.35, DV −7.65 mm) through a 30-gauge flexible cannula over 15 minutes.
Recording electrodes included stainless steel screws for measurements of electrocorticogram (ECoG) at coordinates of (AP +1.5, ML ±4 mm) and (AP −2, ML ±3 mm), and custom-made 50 µm (diameter) ultra-low impedance µRC, EIROF electrodes implanted in dorsal and ventral hippocampus (AP −2.5, ML ±2.0, DV −3.2 mm), (AP −3.9, ML ±2.2, DV −3.1 mm), (AP −5.15, ML −5.35, DV −7 mm), and (AP −6.0, ML 5.0, DV −5.5 mm) to provide differential measurements of the hippocampal local field potentials (LFP). For each hippocampal site, a bundle of two electrodes with ends 125-250 µ dorsally apart was used. All coordinates were Bregma referenced.
All rats received a lead in the precordium to monitor Electrocardiogram (ECG) activity. Electrodes were secured in place and electrically isolated via dental cement. The leads were then connected to the acquisition amplifier and all was encapsulated within a 3D printed headmount. At the completion of the surgery animals were returned to their individual homecages – standard autoclave-ready rat cages – with free access to food and water and maintained at a 12 hour light-dark cycle with lights on between 6 am and 6 pm.
Seven days post-recovery, rats were connected to a commutator at the top of the cage via a low-weight USB cable. A minicomputer (Raspberry Pi foundation, 3 model B) attached to the cage cover acquires data continuously to a network attached storage (NAS). A separate single-board computer (Raspberry Pi foundation, 3 model B) with a low-light level-compatible camera system similarly spools continuous, time-synchronized video data to the same NAS.
Animals were housed individually in custom-made plexiglass cages
Data Collection
For mice and rats all biopotentials were acquired at 24 bit resolution and 1 kHz sampling frequency (per channel) via our custom-made data acquisition system.
For mice acquisition system was designed to provide 8 channels of high quality biopotential recordings. The 24-bit digitization provides a dynamic range of 4.5 V with sub-microvolt divisions. Therefore it accommodates the amplitude range and resolution to simultaneously resolve large shifts in tissue potentials 10-30 mV) associated with SD and normal activity in the range of few millivolts associated with field potentials. This feature complemented with DC-stable µRC electrodes will eliminate the need for analog high-pass filtering prior to digitization.
For rats, we extended the acquisition system to provide 16 channels and a 3-axis accelerometer and to fit within a 3D-printed head mounted box (amplifier size: 1”W×1”D×0.25”H).
The raw data contain the information in all frequencies, including bio-potentials from neural activity, spreading depolarization, and electrochemical changes.
Data Analysis
All recorded data were inspected via in-house written Labview (National Instruments) and MATLAB (MathWorks Inc.) programs that allow for simultaneous re-referencing, filtering, spectral analysis and annotation. All data were originally referenced to a reference screw electrode. For seizure and state of vigilance scoring, the raw ECoG and hippocampal depth recordings were band-pass filtered at 1-55 Hz and 1-125 Hz; respectively, to highlight field potentials and seizure dynamics. Electromyogram (EMG) and ECG data were band-pass filtered at 1-125 Hz to extract muscle activity and cardiac dynamics. 3-axis head acceleration was band-pass filtered at 1-100 Hz.
Seizure Detection
For mice seizures were detected manually, from band-pass filtered EEG, using custom-written in-house software within Labview environment. Spontaneous seizure activity of more than 10 seconds was identified and scored for origin and evolution pattern according to previously described criteria in Ssentongo et al. 2017. Inclusion criteria for putative seizure incidents were at least one low-noise hippocampal depth recording and at least one low-noise ECoG recording. Epilepsy criteria was defined as observation of at least 2 seizures at or after day 3 post-implant, and one seizure more than 26 days post-infection. All epileptic animals with at least one ECoG and one hippocampal depth electrode with stable DC recordings throughout their lifetime were selected for further analysis.
For rats, seizures were detected automatically, from bandpass filtered EEG and head acceleration measurements, using in-house custom-written routines in Labview software and verified visually to determine precise onset and end times. Inclusion criteria for each hour of data analyzed were availability of at least one low-noise hippocampal LFP, at least one low-noise ECoG and at least one low-noise axis of head acceleration measurements. Spontaneous seizure activity of more than 10 seconds was marked as a seizure.
Spreading Depression Detection
A custom written MATLAB (Mathworks Inc.) script was used to find bouts of spreading depolarization. SD is characterized by significant negative DC changes in the signal. In order to detect such shifts, the raw EEG was low-pass filtered with a cutoff frequency of 2 Hz. We then calculated the first order time-derivative of the low-pass filtered signal and marked any instance of threshold (= 4 x standard deviation from the mean) crossing as an indicator of a SD bout. Time-series of detected SD events were visually inspected and verified to achieve temporal accuracy in SD end times which were identified as when DC potential recovered to the pre-seizure baseline.
DC Artifacts
The changes in DC potential might not all be due to physiological phenomena. Transient changes in connectivity can cause transient, sharp shifts in electrode potential. These events are often caused by mechanical factors that temporarily affect the amplifier-headmount connection such as animal handling during cleaning and measurements of parasitemia levels. During these artifacts, the DC potential rapidly rises and then recovers to its baseline value through a short recharge period.
Our SD detection algorithm did not account for such DC shifts. Thus, time-series of detected SD events were visually inspected and verified to account for false detections. These transient incidents are distinguishable from baseline DC potential fluctuations because of their relatively larger amplitude and from SD-like events due to their relatively shorter duration.
Included Data
In both animal models of epilepsy, animals were included for further analysis if they had at least one ECoG and one hippocampal depth recordings with sufficient stability. As described previously, “sufficient stability” is defined as having baseline (low-frequency) fluctuations with amplitudes substantially less than 10 mV over hour-long periods. Therefore, all included animals had stable DC recordings throughout their lifetime.
For both models, we included epileptic animals (ones that experienced spontaneous, recurrent seizures according to the criteria previously described) and control animals. Controls included both animals that received neurological insult (CM or TeTX) and did not develop epilepsy and ones that did not receive CM or TeTX.
Post-Cerebral Malaria Epilepsy Model
Overall data were collected from 21 post-CM epileptic mice with 1139 days of continuous recordings. Control data included uninfected control animals with no seizures (17 mice with over 820 cumulative recording days), and animals rescued from CM that did not develop seizures (6 mice with 282 cumulative recording days).
Rat Tetanus Toxin Model of Temporal Lobe Epilepsy
Overall data were collected from 5 TeTX epileptic rats with 124 days continuous recordings. Control data included 2 rats with 74 recording days each that did not receive TeTX injections and one rat that received TeTX injection but did not develop epilepsy with 80 days of recording. Collectively, the two models account for 2593 days of full-time continuous measurements.
Hardware Validation
The large slow shifts in the tissue potential associated with SD reside in the very low frequency (1-100 mHz) ranges. Therefore, in order to capture these events the measurements need to be free of the electrode-tissue electrochemical polarization driven by the input current of the amplifier. This is in addition to the digitization range and resolution required to simultaneously record SD and field potentials.
For evaluation of electrode polarization under DC potential changes we prepared a conductive medium from 0.09% NaCl solution (10 times weaker than standard physiological saline). The solution was then poured into the experiment chamber which is built from plexiglass (blue area in Fig. 2A). The two conductive sections (area = 2×4 cm2 and 2×0.5 cm2) are separated from one another with molding clay (green piece) and the only electrical connectivity is from a glass pipette filled with 0.09% saline.
Within this setup, a spatially uniform, AC electric field was introduced by passing current (Analog Stimulus Isolator, AM Systems Model 2200) between a pair of large platinum plates (0.7×1.7 cm2) embedded on either end of the chamber relatively far from the electrodes (distance between plates = 6 cm). Test electrodes were embedded inside the chamber at known distances from one another. Measurements were referenced to a stainless steel screw electrode placed in the chamber floor (one of the red circles in Fig. 2A).
The electrodeposited iridium oxide films (EIROF) are known to be pH sensitive26. Physiological brain pH variations occur in the time-scale of seconds to minutes. Therefore, our measurements in the very low frequency ranges are potentially combinations of changes induced by electrochemical reactions (pH) and electrical fields induced by depolarization of neural populations (SD).
We characterized the pH response of the custom-made EIROF deposited 50 µm micro-reaction chamber (µRC) electrodes in the physiologically relevant pH range of 6-8. The electrodes were placed in the Britton-Robinson buffer solution while drop-wise addition of 0.2 M solutions of NaOH and H2SO4 set the appropriate pH range (measured via a calibrated pH-meter, Anaheim Scientific P771). The test electrodes were all referenced to a pH-insensitive Ag/AgCl pellet electrode (AM Systems, Catalog #550008). The pH-insensitivity of the Ag/AgCl pellet was confirmed via measurements against a double junction Ag/AgCl reference electrode (Beckman Coulter, 3.5 M KCl, Item #A57189). We found the pH sensitivity of our custom-made EIROF deposited µRC electrodes to be 70 mV/decade at body temperature of 37°C (data not shown).
Measurement of Spreading Depolarization in Rat Brain Slice
In order to further validate our in vivo potential measurement of SD, we acutely induced cortical SD and measured tissue potential with our recording system designed and utilized for chronic measurements in epileptic rats (as previously described in Methods). The slice preparation and induction of cortical SD were in the context of experiments detailed in 32. We assembled an array of µRC EIROF electrodes according to methods described in 23. The assembly was then advanced into the slice while electrode potentials were continuously recorded. Shown in Fig. S1A is the position of electrodes with respect to the cortex. The colored crosses correspond to the colored traces of electrode potential time-series in Fig. S1C. The large negative deflection in each electrode potential was concurrent with the time SD reached the electrode as shown in Fig. S1B for the three of the recording electrodes (blue, green, black crosses in Fig. S1B).
Statistical Analysis
The fraction of seizure-associated spreading depolarization events, 33% and 38% for TeTX and post-CM model respectively, is the count of seizures with SD from all observed seizures. These counts are estimates following the binomial count statistics. Therefore, the propagated error for these estimates is  , where N is the sample size and f is the estimated
  . The propagated estimation error was 0.02 and 0.01 for TeTX and post-CM model respectively.
Acknowledgements
We thank Ali Nabi, Balaji Shanmugasundaram, and Myles W. Billard for assistance in development of the acquisition hardware, and Carlos M. Curay for animal care. This work was supported by National Institute of Health grant R01EB019804, a Multidisciplinary grant from Citizens United for Research in Epilepsy (CURE), Pennsylvania State Institute for the Neuroscience from Pennsylvania Department of Health Tobacco Funds, and a doctoral Academic Computing Fellowship from Pennsylvania State University to F.B.
References


