

Abstract
The fungus Puccinia graminis f. sp. tritici (Pgt) causes devastating stem rust disease on wheat. Infection occurs when rust spores germinate on the leaf surface and subsequently, specialized infection structures called haustoria form inside host cells followed by sporulation. Small RNA and transcriptome sequencing during Pgt-wheat infection reveals that the Pgt RNA interference (RNAi) machinery has functionally diversified. A number of Pgt RNAi genes are strongly up-regulated during late infection compared to the start of infection. This coincides with the production of two distinct Pgt small RNA (sRNA) profiles. At the start of infection, Pgt induces predominantly 21 nt sRNAs with a 5’ uracil derived from genes. In contrast, during late infection Pgt induces 22 nt sRNAs with a 5’ adenine derived from repeats. Strikingly, over 85% of Pgt sRNAs are differentially expressed during infection, compared to only 4% of wheat sRNAs. Using chromatin conformation capture assay data (Hi-C), we define Pgt centromeres and show that sRNAs up-regulated during late infection are derived from those repeat-rich, gene-poor and transcriptionally silent centromeric regions. We conclude that the Pgt RNAi machinery is highly regulated, resulting in differential accumulation of sRNA types throughout the infection cycle. Such tight temporal control of the RNAi machinery has thus far not been observed in fungi and might ensure genome stability during sporulation in rust fungi.
Importance The wheat stem rust disease caused by Puccinia graminis f. sp. tritici (Pgt) is one of the most devastating crop diseases and of significant global interest. Despite the availability of genomic resources, we have limited insight into how Pgt is able to quickly and aggressively overcome plant resistance. In this work, we deliver the first-time characterization of how Pgt utilizes small RNAs (sRNAs) during infection. Our work uncovers fundamental characteristics of the stem rust RNAi machinery and the first characterization of rust centromeres. Future research can use this knowledge to optimize methods of host-induced gene silencing where small RNAs from the plant operate via the fungus’s own RNAi machinery to silence genes important for causing disease.
Introduction
The basidiomycete fungus Puccinia graminis f. sp. tritici (Pgt) is a plant pathogen that causes wheat stem rust disease, resulting in devastating crop losses (Dubin, 2009). Pgt is a dikaryotic fungus that contains two distinct haploid nuclei. During the asexual infection phase on a cereal host, Pgt produces single-celled dikaryotic urediniospores that germinate on the leaf surface (Leonard & Szabo, 2005; Figueroa et al., 2016). Subsequently, appressoria form and penetration through stomata occurs with development of specialized infection structures called haustoria by around 2 days. Haustoria enable nutrient uptake as well as the delivery of secreted pathogen proteins called effectors into the host plant cell (Garnica et al., 2014). The start of urediniospore production occurs at approximately 6-7 days post infection (dpi) and urediniospore pustules typically erupt through the leaf or stem surface (sporulation) after 8–10 dpi (Figueroa et al., 2016). In the poplar rusts, intense cell division activity has been observed in the sporulation area (Hacquard et al., 2011).
Whilst substantial time-course transcriptomic resources have been generated for Pgt (Duplessis et al., 2011; Upadhyaya et al., 2015; Chen et al., 2017), how it utilizes its RNA interference (RNAi) machinery during the infection cycle has thus far been unknown. Small RNAs (sRNAs) are 20-30 nucleotide (nt) short regulatory non-coding RNAs that function in transcriptional or posttranscriptional gene silencing through sequence complementarity (Grosshans & Filipowicz, 2008). In plants, sRNAs are predominantly in the size range of 20-24 nt and can be divided into two classes: small interfering RNAs (siRNAs) processed by Dicer proteins from long double-stranded RNA (dsRNA) and microRNAs (miRNAs) processed from stem-loop regions of single-stranded primary RNAs (Borges & Martienssen, 2015). Endogenous dsRNA is generated by RNA-dependent RNA polymerases (RdRPs) from single-stranded RNA (ssRNA), whereas self-folding miRNA precursors are transcribed by RNA Polymerase II from MIRNA genes (Axtell et al., 2011). Both miRNAs and siRNAs are bound to argonaute (AGO) proteins to induce silencing of targets by base-pairing interactions and complementarity (Czech & Hannon, 2011). Post-transcriptional gene silencing (PTGS) is induced by sRNAs in the cytoplasm, which target complementary mRNAs for degradation or translational repression. In plants, successful identification of a target by miRNA/AGO complexes and some siRNA/AGO complexes induces PTGS and can trigger secondary siRNA production (Chen et al., 2010). AGO1, the dominant player in PTGS, preferentially interacts with sRNA with a 5’ uracil to induce silencing. In contrast, transcriptional gene silencing (TGS) is induced by nucleus-localized sRNAs through epigenetic modifications, such as DNA cytosine methylation and histone methylation, to homologous regions of the genome (Matzke & Mosher, 2014). In plants, these nucleus-localized heterochromatic siRNAs (hc-siRNAs) are the most abundant sRNAs. They are predominantly 24 nts in length, derived from intergenic or repetitive regions and are associated with the AGO4 clade to regulate epigenetic silencing through RNA-directed DNA methylation (RdDM). Adenine is the most common 5′ base of AGO4-bound 24 nt siRNAs in Arabidopsis (Lister et al., 2008). In plants, RdDM is implicated in maintaining genome stability through transposon control, pathogen defence and stress responses, intercellular communication and germ cell specification (Matzke & Mosher, 2014).
In the diverse fungal kingdom, the RNAi machinery of the fission yeast Schizosaccharomyces pombe and the ascomycete fungus Neurospora crassa are thus far the best-studied (Chang et al., 2012). Quelling is an RNAi-related gene-silencing mechanism in Neurospora that is induced by repetitive transgenic sequences and occurs in the vegetative growth stage to control transposons (Romano & Macino, 1992). In Schizosaccharomyces pombe, RNAi components are required for heterochromatin formation (Volpe et al., 2002). The roles of sRNAs in eukaryotic plant pathogens have thus far not been extensively characterized (Weiberg et al., 2014). In Phytophthora spp., sRNAs are putatively involved in effector gene and transposable element (TE) regulation and are predominantly of the size classes of 21 nt, 25-26 nt and 32 nt (Vetukuri et al., 2012). Many Phytophthora sRNAs of all size classes map to TEs, particularly to long terminal repeat (LTR) retrotransposons. Another class of sRNAs map to Crinkler effector genes and were predominantly of the 21 nt size class. In Magnaporthe oryzae, 18-23 nt sRNAs are produced from repetitive elements and are implicated in TE regulation in vegetative tissue, whereas 28-35 nt sRNAs mapping to transfer RNA (tRNA) loci are enriched in the appressoria (Nunes et al., 2011). Several cross-kingdom RNAi interactions between fungal pathogens and plants have been uncovered. Some Botrytis cinerea sRNAs silence Arabidopsis and tomato genes involved in plant immunity and are mainly derived from LTR retrotransposons and are 21 nt in size with a 5’ uracil (Weiberg et al., 2013), while Arabidopsis cells secrete exosome-like extracellular vesicles to deliver sRNAs into the fungal pathogen Botrytis cinerea to silence pathogenicity genes (Cai et al., 2018). The wheat stripe rust fungus Puccinia striiformis f. sp. tritici (Pst) produces a large number of 20-22 nt sRNAs and expresses RNAi genes during infection (Mueth et al., 2015). One 20 nt sRNA appears to target the wheat defence pathogenesis-related 2 (PR2) gene (Wang et al., 2017). The fungal pathogen Sclerotinia sclerotiorum produces mainly 22-23 nt sRNAs with a 5’ uracil from repeat-rich regions during infection (Derbyshire et al., 2019). The production of sRNAs and their potential roles in Pgt development and pathogenicity has thus far not been investigated.
Recently, the chromosome-scale assembly of Pgt 21-0 has been made available (Li et al., 2019). This assembly is fully phased with 18 chromosome pseudomolecules for each of the two haplotypes contained in the two nuclei. Chromosome-scale, long-read assemblies offer the opportunity to investigate the genomic localization of sRNAs and how this potentially links to their function. For example, highly repetitive loci such as centromeres generate sRNAs which in turn are required for silencing (van Wolfswinkel & Ketting, 2010). Centromeres are essential for chromosome segregation during cell division. Transcriptionally inactive chromatin (heterochromatin) is vital to maintain the integrity of the centromeres and is typically gene-poor, highly condensed and repetitive. Eukaryotic centromere sequences are highly diverse in sequence and can differ even between closely related species (Henikoff et al., 2001). In fungi, their lengths range from point centromeres (<400 bp), short regional centromeres (>400 bp, <20 kb) to large regional centromeres (>20 kb) (Yadav et al., 2018a). For example, the fission yeast S. pombe centromeres span between 35-110 kb and resemble those of vertebrates (central core domain of non-repetitive AT-rich DNA flanked by outer repeats), where the kinetochore is embedded in the heterochromatin of the outer repeats. In Neurospora crassa, centromeres are repetitive, AT-rich 150 to 300 kb long regions (Smith et al., 2011). The human fungal pathogen Cryptococcus harbours large regional centromeres that are ORF-free regions rich in LTR retrotransposons (Yadav et al., 2018b). RNAi has been suggested as a key determinant of longer centromeres in Cryptococcus and as a suppressor of centromeric retrotransposons to ensure genome stability (Yadav et al., 2018b). The formation of silent heterochromatin in some yeasts depends on siRNAs derived from pericentromeric regions and on the RNAi machinery (Reinhart & Bartel, 2002; Volpe et al., 2002). Genes placed near centromeric chromatin are typically silenced (Fishel et al., 1988; Pidoux & Allshire, 2005), with the strongest repression at the outer repeats (Allshire et al., 1994; Allshire et al., 1995). Centromeres are not well-studied in plant-pathogenic fungi and have thus far not been described in the genomes of rust fungi. In the rice blast fungus Magnaporthe oryzae, centromeres span 57-kb to 109-kb transcriptionally poor regions and share highly AT-rich and heavily methylated DNA sequences (Yadav et al., 2019). Here we analyse sRNA expression in Pgt at different stages during infection and find evidence for two waves of sRNAs; an early expressed wave predominantly 21 nt with 5’ uracil derived from genic sequences, and a late expressed wave of predominantly 22 nt with a 5’ adenine derived from centromeric repeats.
Results
The expression profiles of the Pgt RNAi genes suggest their functional diversification
RNAi machinery genes were previously identified in the reference genome Pgt p7a (Duplessis et al., 2011; Choi et al., 2014). We searched for the Pgt p7a RNAi genes in the gene annotation of the fully phased, chromosome-scale assembly of Pgt 21-0. Two argonaute genes, three dicer genes and five RdRP genes are present in the annotation of Pgt 21-0 on each haplotype (Table 1). We assessed the expression of these RNAi genes during a time course of Pgt 21-0 infecting wheat from 2-7 days post infection (dpi) (Chen et al., 2017) and in germinated spores and haustorial tissue (Upadhyaya et al., 2015). Clustering of the RNAi gene expression profiles showed two main groups: one set of RNAi genes (argonaute B, RdRPs B/D/E and dicers A/B) that are constitutively expressed during infection and another set of RNAi genes (argonaute A, dicer C and RdRPs A/C) that are highly expressed only during the later stages of infection (Figure 1), with no or very low expression in germinated spores and during 2-4 dpi. We did not observe differences in expression patterns of the RNAi genes between the two Pgt haplotypes. Taken together, the gene expression analysis suggests that the Pgt RNAi machinery has functionally diversified and that Pgt uses RNAi to regulate stage-specific infection processes, such as the formation of new urediniospores during late infection.
For each protein, the identifiers of the allelic proteins on each haplotype are given, with their protein sequence identity. Homologs of the Pgt p7a PGTG_13081 and PGTG_13088 dicer proteins were not found in the gene annotation of Pgt 21-0.

Hierarchical clustering of expression levels of Pgt RNAi genes in transcripts per million (logTPM, red color intensity relates to high expression strength). The Pgt RNAi genes form two main clusters of expression. The first consists of argonaute B, RdRPs B/D/E and dicers A/B that are expressed across all conditions. The second cluster consists of RdRPs A/C, argonaute A and dicer C and these are highly expressed at the later stages of infection (6-7 dpi).
Pgt produces two distinct sRNA profiles during infection, similarly to wheat sRNAs
To assess the role of the RNAi machinery during the rust infection cycle, we performed small RNA-sequencing on germinated spores, uninfected wheat and infected wheat at 3 dpi, 5 dpi and 7 dpi. Adapter-trimmed and tRNA/rRNA-filtered sRNA reads were first mapped to the wheat genome (IWGSC RefSeq v1.0) and the Pgt 21-0 genome, allowing no mismatches. Strikingly, the read alignment rates show a strong presence of Pgt sRNAs in the late infection sample (7 dpi, Table 2). The mapping rates to rust at 3 dpi and 5 dpi are low at 0.57% and 1.76%, respectively, but increase drastically to 33.9% at 7 dpi. In contrast, 70.3% of sRNA reads map to the wheat genome in the uninfected wheat samples. During infection, ∼67% of sRNA reads map to the wheat genome at 3 dpi and 5 dpi. Strikingly, at 7 dpi the sRNA mapping rate to wheat decreases to 30.3%.
To annotate high-confidence Pgt and wheat sRNAs from the sequencing data, we used the ShortStack software (Axtell, 2013). ShortStack predicts and quantifies sRNA-producing loci in a genome based on clusters of sRNA reads and miRNA-producing loci according to a series of tests, such as strandedness of the locus and the predicted precursor secondary structure. ShortStack predicted 4,599 Pgt sRNA loci (4,593 siRNAs and 6 miRNAs) and 394 wheat sRNA loci (343 siRNAs and 51 miRNAs) (Supplementary Files S1-S4). For each predicted sRNA locus, ShortStack returns the single most abundant RNA. For predicted miRNA loci, this will generally be the functional mature miRNA. The read length distributions of rust and wheat sRNA-producing loci show different patterns and deviate from a random distribution (Figure 2). The Pgt-derived small RNAs are predominantly 20, 21 or 22 nts in length, both for the single most abundant RNA in each locus as well as the total reads forming the loci. However, there are two distinct peaks at 21 nt and 24 nt for the wheat sRNAs, as is expected for plant sRNAs.
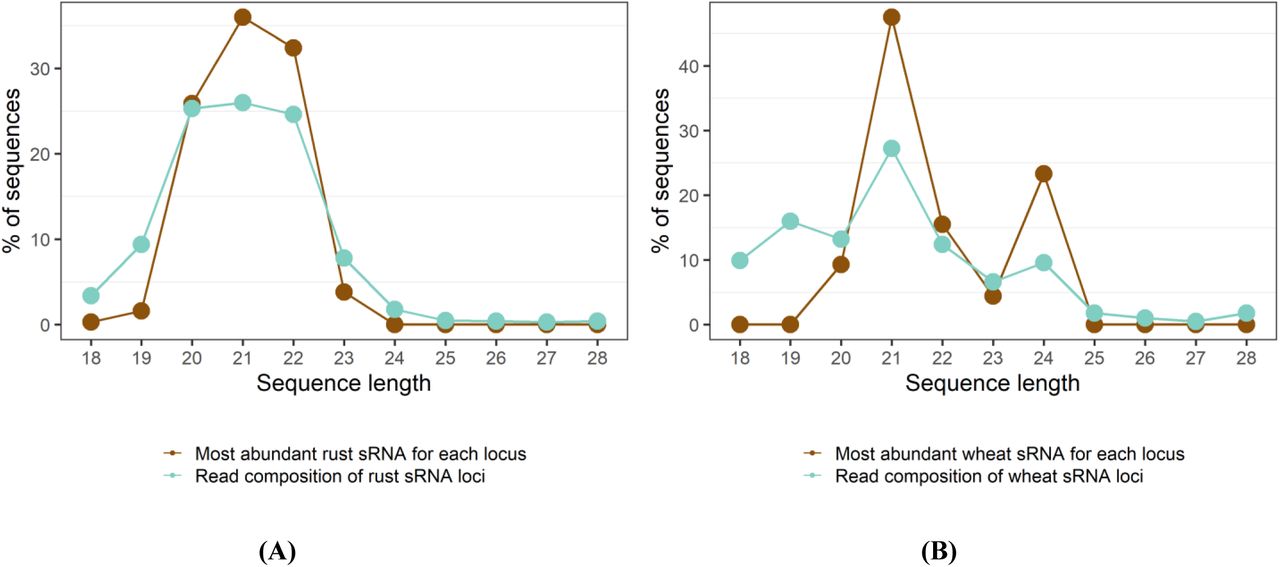
Sequence length distributions of predicted sRNAs in (A) rust and (B) wheat. The rust sRNAs are predominantly 20-22 nt in length, whereas the plant sRNAs show strong peaks at 21 nt and 24 nt.
We then assessed the 5’ nucleotide preferences for the single most abundant RNAs in each cluster. As expected, most wheat miRNAs are 21 nt and have a 5’ uracil (76.4%) while the wheat siRNAs are mostly either 21 nt with a 5’ uracil or 24 nt with a 5’ adenine. The two distinct peaks at 21 and 24 nts with their corresponding 5’ nucleotide preferences support the predicted presence of both miRNAs and siRNAs in the wheat sRNA set. The 24 nt wheat siRNAs likely represent siRNAs involved in RNA-directed DNA methylation (Lister et al., 2008; Geng et al., 2019). Two distinct classes of siRNAs also appear to be present in Pgt based on 5’ nucleotide preference, although differeing in size to the wheat siRNAs. Pgt siRNAs of length 20-21 nts have a strong preference for a 5’ uracil (∼76%), whereas 53% of 22 nt Pgt siRNAs have a 5’ adenine. Taken together, wheat and Pgt both produce two distinct siRNA classes during infection. One class prefers a 5’ uracil (21 nt miRNAs in wheat and 20-21 nt siRNAs in Pgt) and the other prefers a 5’ adenine (24 nt siRNAs in wheat and 22 nt siRNAs in Pgt).
Pgt induces early and late waves of sRNAs during infection, whereas most wheat sRNAs are not differentially expressed
Next, we assessed the differential expression of Pgt sRNAs at the start of infection (germinated spores), during early infection when haustoria are present inside the plant cells (3 dpi and 5 dpi) and during late infection when sporulation begins (7 dpi). We detected no differential expression of Pgt sRNAs between 3 dpi and 5 dpi, likely due to the low number of mapped reads (Table 2). Strikingly, 3,963 of the 4,599 Pgt sRNA clusters are predicted as differentially expressed (86.2%), with 1,631 up-regulated in germinated spores, 188 up-regulated during early infection (3 dpi and 5 dpi) and 2,364 up-regulated during late infection (Figure 3, Supplementary Files S5-S8). The six predicted Pgt miRNAs are all up-regulated in germinated spores compared to late infection. A large proportion of sRNAs (80.2%; 1,897 of 2,364) are up-regulated during late infection compared to all the other conditions (germinated spores, 3 dpi and 5 dpi). In contrast, the majority of sRNAs that are up-regulated in germinated spores (85.1%; 1,388 of 1,631) are down-regulated in late infection and not at 3 dpi or 5 dpi. This indicates that the sRNAs up-regulated during late infection are highly specific to that time point.


(A) A multi-dimensional scaling plot using the edgeR package shows the clustering of the replicates for the different samples. The 3 dpi and 5 dpi samples show less differences in expression than the germinated spores and 7 dpi samples. (B) Venn diagrams of up-regulated Pgt sRNAs shared between the different time points: germinated spores, early infection (3 dpi and 5 dpi) and late infection (7 dpi). Two major classes of sRNAs occur: one that is up-regulated during late infection (n = 1,897) and one that is up-regulated in germinated spores compared to late infection (n = 1,388).
In contrast to Pgt, which exhibits prominent waves of sRNA expression during infection, only 19 of the 394 wheat sRNAs (4.8%) are predicted to be differentially expressed. Amongst these 19 differentially expressed wheat sRNAs is only one predicted miRNA, but it does not have a match to a known miRNA in the RNACentral database (Consortium, 2016). Taken together, a major switch in Pgt sRNA expression occurs between the start of infection (germinated spores) and the late infection stage, coinciding with the differential expression of several RNAi genes (Figure 1).
The late wave Pgt sRNAs are predominantly 22 nt in length with a 5’ adenine
We assessed the length distributions and 5’ nucleotide preferences of differentially expressed Pgt sRNAs (Figure 4A). Pgt sRNAs up-regulated during early infection or in germinated spores are predominantly 21 nts in length (55.9% and 48.3%, respectively). In contrast, the largest class (43.5%) of the Pgt sRNAs up-regulated during late infection are 22 nt in length. Pgt sRNAs with no detected differential expression follow a similar size distribution pattern to those that are up-regulated in germinated spores and early infection, with 21 nt sRNAs being the most prevalent class (47.6%, Figure 4A). The majority of the 20-22 nt sRNAs up-regulated in germinated spores, during early infection and those with no differential expression contain a 5’ uracil (Figure 4B). This is also true for 21 nt sRNAs up-regulated during late infection. However, in contrast, the 22 nt sRNAs that are up-regulated during late infection have a strong preference for 5’ adenines. This resembles the occurrence of 24 nt siRNAs with a 5’ adenine in plants and suggests the specific induction of a different functional class of sRNAs during these late infection stages.
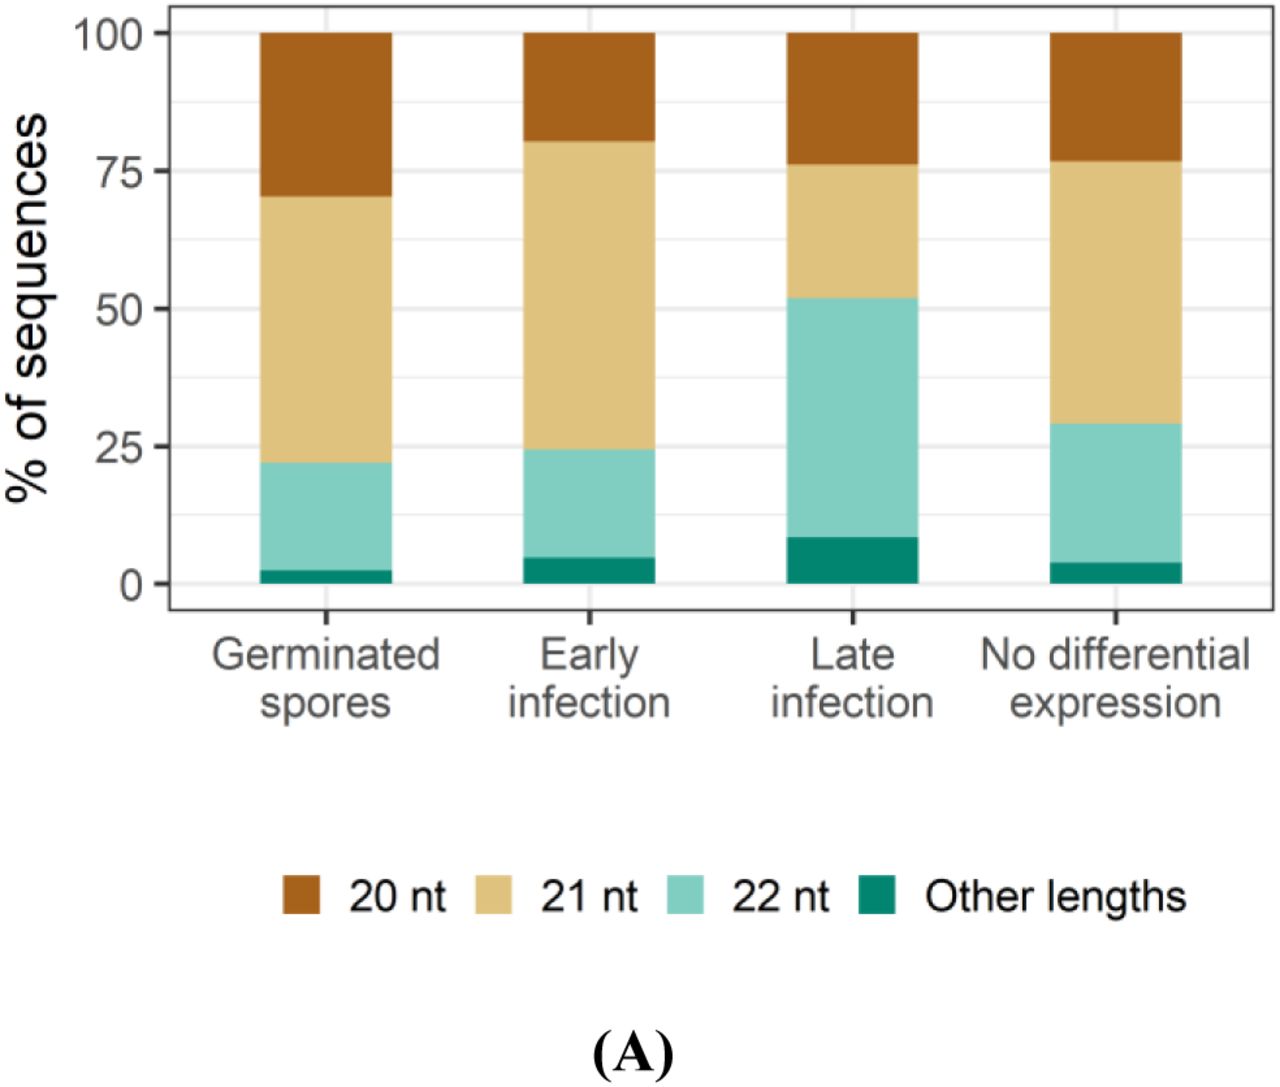
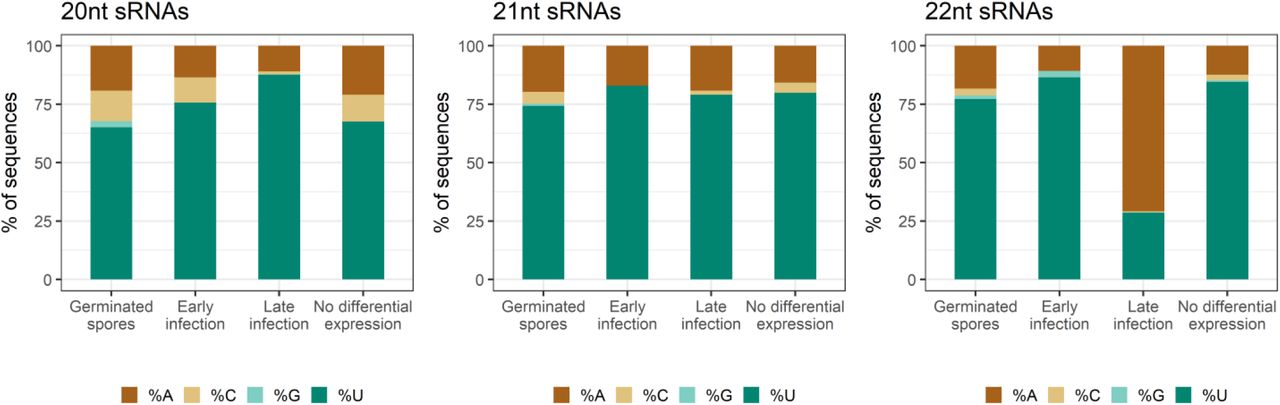
(A) Sequence lengths and (B) 5’ nucleotide distribution of Pgt sRNAs. Pgt sRNAs up-regulated during late infection differ in length distribution and 5’ nucleotide preference to the remaining Pgt sRNAs. 22 nt Pgt sRNAs up-regulated during late infection prefer a 5’ adenine, which is not observed for 22 nt sRNAs expressed in the other conditions.
The early wave Pgt sRNAs are mostly produced from genes and are conserved across the haplotypes
We further investigated the locations of the Pgt sRNAs on the chromosomes and found that similar proportions occur in each of the two haplotypes (Table 5). We then assessed if sRNAs have a homologous counterpart. For this we re-mapped the sequencing reads that define a sRNA locus to the remainder of the genome. The sRNA locus that has the highest coverage by those mapped reads is assigned as the homologous counterpart. Around two-thirds of sRNAs up-regulated in germinated spores have a homologous counterpart (66.1%, Table 5). Almost half of these homologous pairs are located on the corresponding haplotype chromosomes (82.6%). In contrast, around half of sRNAs up-regulated during late infection have a homologous counterpart (54.5%), but only 25.4% of these homologous pairs are located on corresponding haplotype chromosomes. The homologous counterparts of sRNAs up-regulated in germinated spores appear to be in synteny for the two haplotype chromosomes, as shown in Figure 5 for sRNAs on chromosome 1A. This suggests that most early infection induced sRNAs are conserved across the haplotypes.
The Pgt sRNAs map in similar proportions to the two haplotypes. More than half of sRNAs are conserved and have a homologous counterpart.
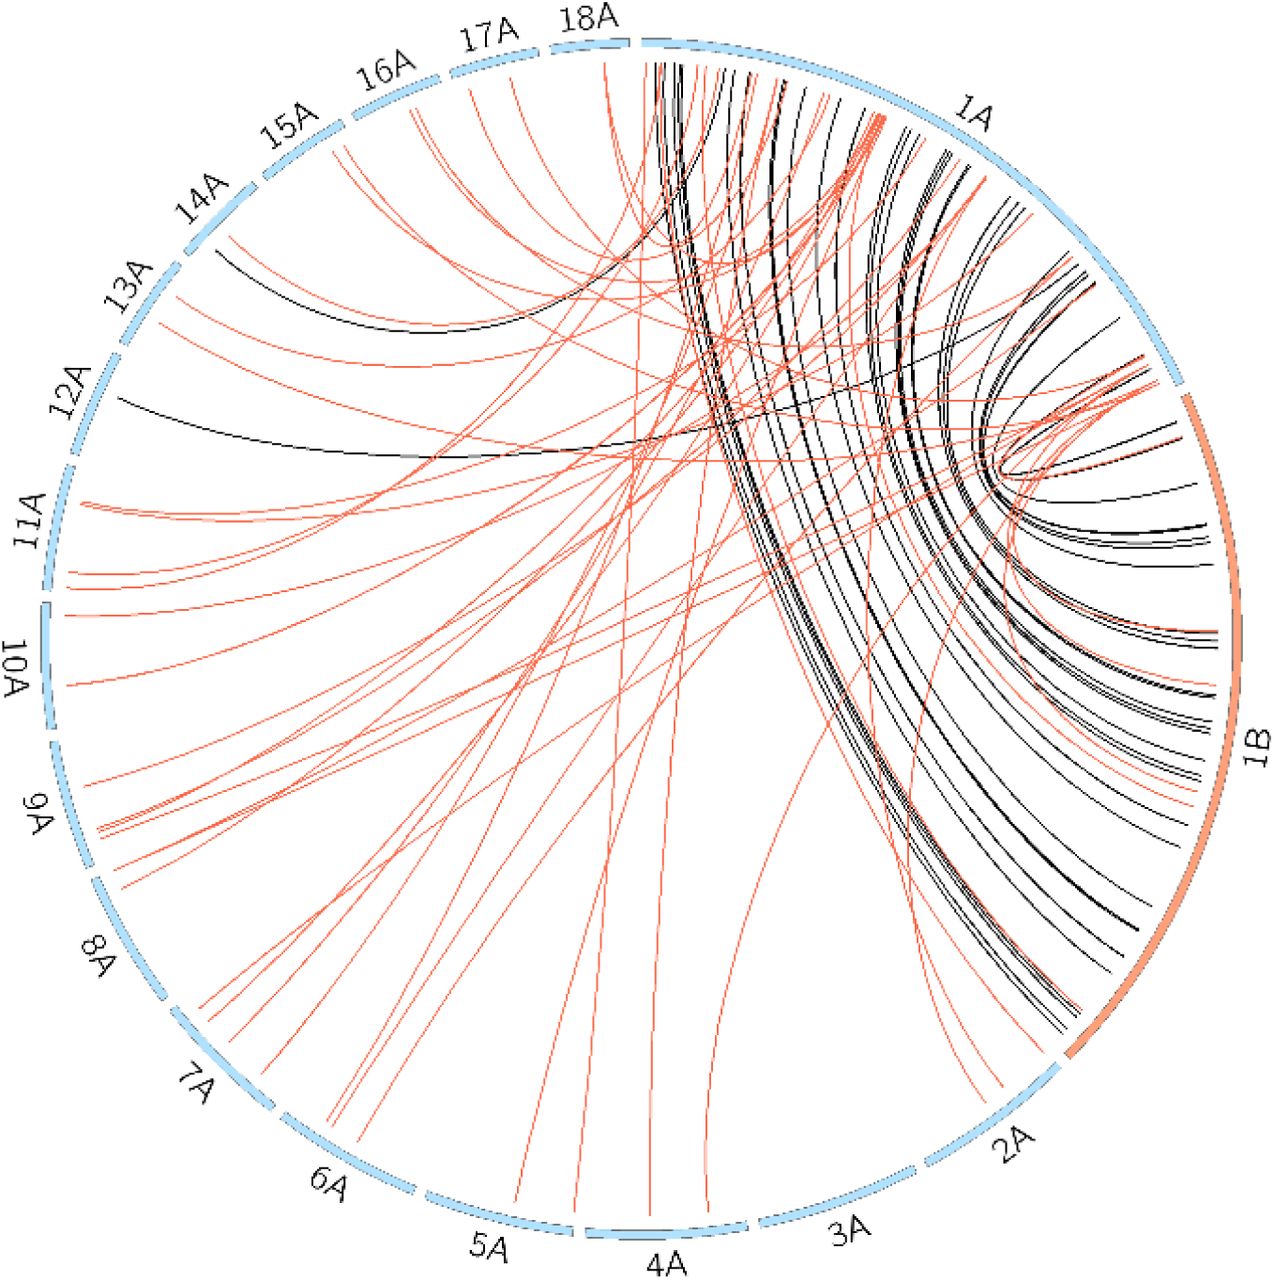
Pgt sRNAs that are up-regulated in germinated spores (late infection) and their homologous counterparts are shown with black (red) links. sRNAs that are up-regulated in germinated spores appear to be in syntenic on the two haplotype chromosomes 1A and 1B (shown at twice their size, other chromosomes shown at 0.2 their size). In contrast, sRNAs that are up-regulated during late infection have homologous counterparts on all other chromosomes except 3A and 12A.
The late wave Pgt sRNAs exhibit opposing genomic locations to the early wave sRNAs (Table 5). Pgt sRNAs up-regulated in germinated spores and during early infection predominantly map to genes (57.5% and 64.9%, respectively), compared to only 16% of sRNAs up-regulated during late infection. Pgt sRNAs induced during late infection are largely generated from repetitive elements (38.7%), in contrast to the early wave sRNAs (7.7% and 8%). Most of the repetitive elements associated with sRNAs belong to the class of LTR retrotransposons, particularly Gypsy elements.
A gene function ontology (GO) term analysis of the 1,004 genes that are associated with Pgt sRNAs up-regulated in germinated spores reveals an enrichment in proteins with protein kinase activity as well as proteins with ATP and DNA binding activity (Table 6). Interestingly, genes that produce Pgt sRNAs up-regulated in germinated spores are also enriched for proteins with histone methyltransferase activity. The enrichment analysis indicates a potential role of Pgt sRNAs in regulation of signal transduction and transcription during spore germination. No significant enrichment in functional annotation was observed for genes that produce sRNAs with no differential expression, or sRNAs up-regulated during early or late infection.
We assessed GO term enrichments of the annotated molecular function of Pgt genes that are associated with sRNAs compared to all other Pgt genes (FDR < 0.00001).
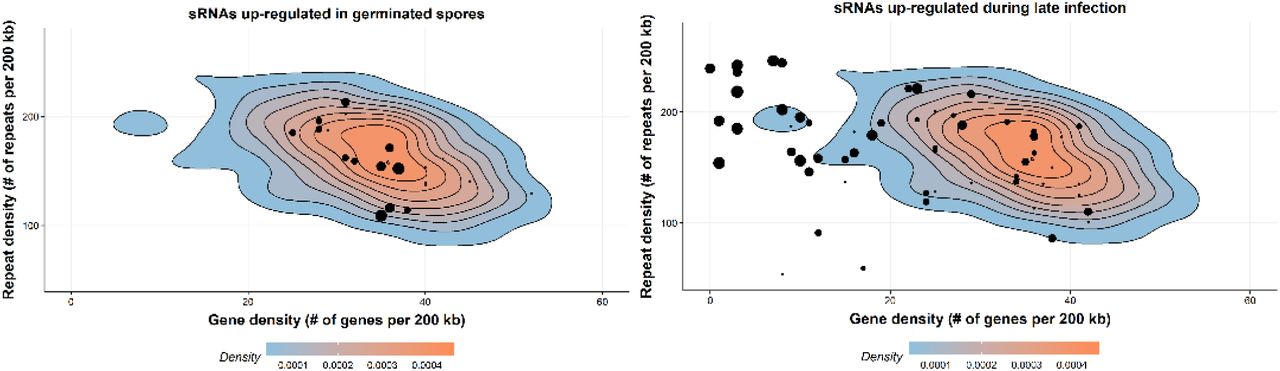
The late wave Pgt sRNAs are produced from repetitive elements in the centromeric regions
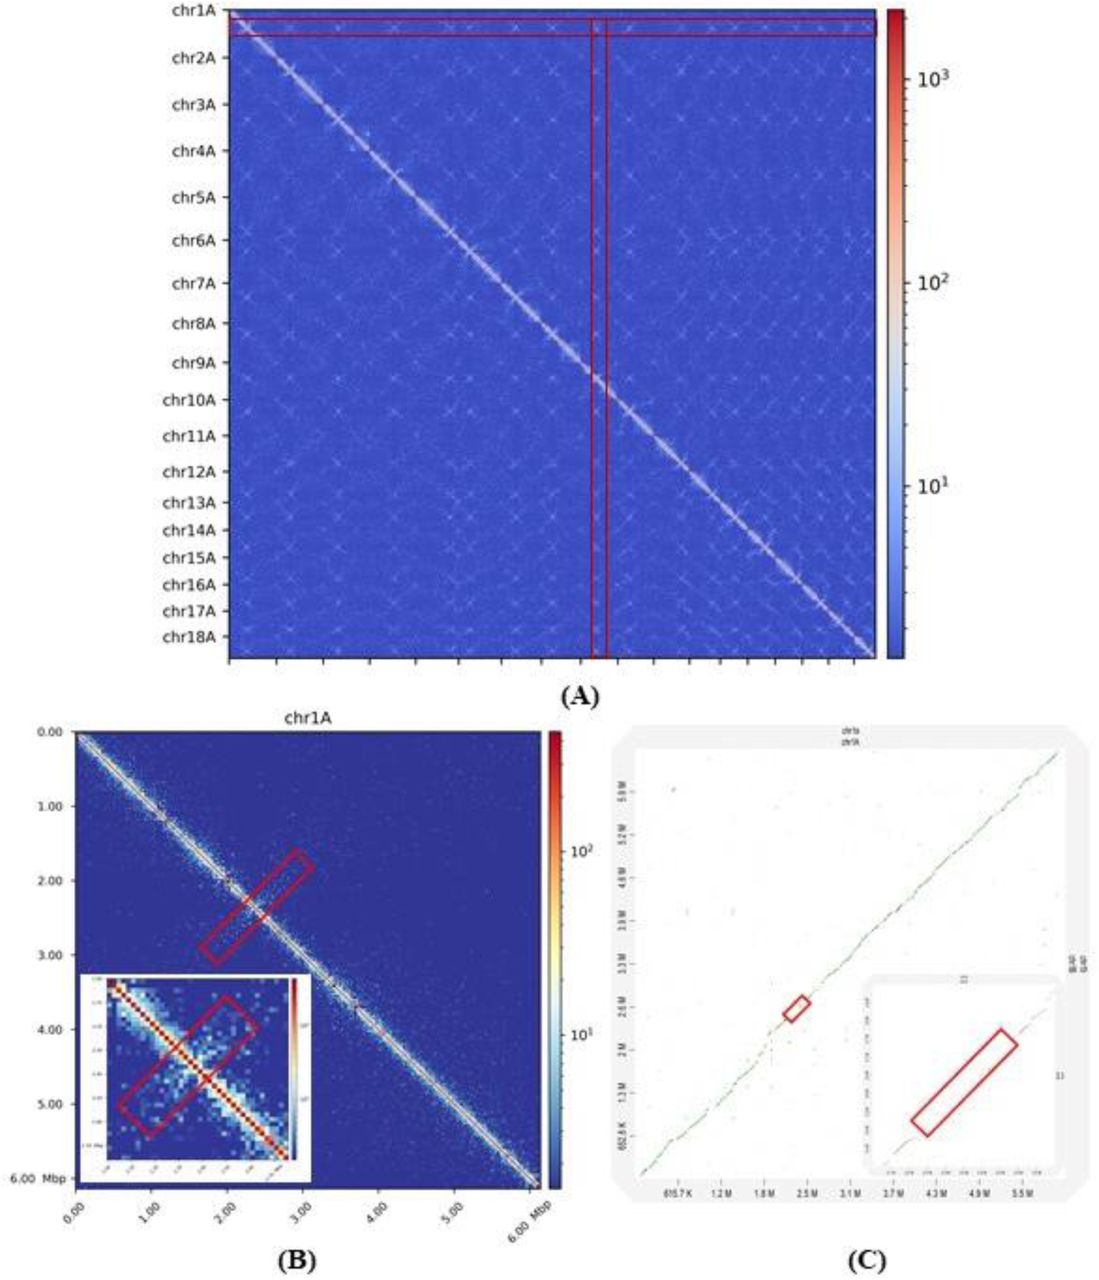
We further assessed the location of sRNAs on the chromosomes in the context of gene and repeat density. We observed a clustering of late wave sRNAs in genomic regions with low gene density and high repeat density (Figure 6) and suspected that these regions might correspond to centromeres. Transcriptionally inactive chromatin (heterochromatin) is vital to maintain the integrity of the centromeres and is typically gene-poor, highly condensed and repetitive. We used chromatin conformation capture assay data (Hi-C) from Pgt 21-0 (Li et al., 2019) to pinpoint the location of the Pgt centromeres. Fungal centromeres tend to cluster in the three-dimensional space and are visible as a distint outwards-spreading shape in a Hi-C contact map (Varoquaux et al., 2015), as seen in the contact map for the chromosomes of each haplotype (Figure 7). For example, the Pgt chromosome 1A has a centromere around position 2.36 MB and chromosome 1B at around position 2.62 MB (Figure 7). For both chromosomes 1A and 1B, a single assembled contig spans the centromeric region and an alignment shows no to very low sequence identity in that region, as opposed to the remainder of the chromosome.

Gene density and repeat density is plotted for 200 kb windows as density plots, where red corresponds to the highest occurence of points. The majority of the Pgt genome sequence has gene density of ∼30-40 genes per 200 kb and repeat density of ∼150-200 repeats per 200 kb. Pgt sRNAs are shown as black dots, with the size of the dot corresponding to the number of distinct sRNAs. Pgt sRNAs up-regulated in germinated spores are located in relatively gene-dense regions, whereas sRNAs up-regulated during late infection reside in gene-sparse, repeat-rich regions of the genome.

(A) A Hi-C contact map of the 18 chromosomes in haplotype A shows the position of the centromeres as cross-like shapes, highlighted with a red rectangle. (B) Hi-C contact map of Pgt chromosome 1A. The centromeric region can be seen at around position 2.36 MB and is highlighted with a red box. (C) Dot-plot genomic alignment of Pgt chromosomes 1A and 1B. The centromeric region displays no to very low sequence identity between the two chromosomes.
Alignment of gene expression data (germinated spores, haustorial tissue and wheat infection 2-7 dpi) to the chromosomes shows that centromeric regions are transcriptionally silent, gene-poor and appear to span at least 200 kb (Figure 8). We assessed the density of the sRNA sequencing reads along the Pgt chromosomes in germinated spores and during late infection. The reads from the late infection samples (7 dpi) form a prominent cluster on each chromosome, whereas the reads from the germinated spore samples appear to be fairly evenly distributed on each chromosome (Figure 8). Strikingly, on each chromosome the sRNAs up-regulated at 7 dpi are derived from centromeres (Supplementary Figure S9). We assessed the repeat content of the predicted centromeric regions. All of the 2*18 Pgt centromeres have a higher repeat content than the non-centromeric regions (Figure 8). The average GC content of the centromeric regions is 42.2%, compared to 43.6% of the non-centromeric regions. The most abundant repeat types in the centromeric regions are LTR retrotransposons, unknown repeats, DNA MULE-MuDR elements and LTR copia retrotransposons. LTR retrotransposons are particularly abundant and occupy on average 25.4% of the centromeric regions, as opposed to 9.8% of non-centromeric regions (Figure 8).


(A) Karyoplots of Pgt chromosomes 1A and 1B. The density distributions of sRNAs, repeat elements, expressed genes and RNAseq reads in germinated spores and at 7 dpi are shown for chromosomes 1A and 1B (20 kb windows, GS: germinated spores). Pgt sRNAs upregulated during late infection originate from the repeat-rich, gene-poor and transcriptionally silent centromeric regions. (B) The repeat content of centromeric regions is compared to the repeat content of non-centromeric regions for each Pgt chromosome. (C-D) The repeat content of Pgt centromeric regions are shown for different classes of repeats (DNA/MULE-MuDR transposons, LTR/Gypsy retrotransposons and LTR/Copia retrotransposons). Centromeres are not all enriched for the same type of repetitive element and repeat content differs between the alternate haplotype chromosomes.
TEs targeted by late infection sRNAs are associated with reduced expression of overlapping genes
Small RNAs and associated repeats can play an important role in transcriptional regulation of neighboring genes. Thus, we aimed to test if transposable elements (TEs) targeted by Pgt sRNAs have a silencing effect on nearby genes. We re-mapped Pgt sRNAs that are up-regulated during late infection without mismatches to the chromosomes. We labelled a TE as sRNA+TE if an up-regulated sRNA maps to it and as sRNA-TE if no up-regulated sRNA maps to it. To investigate the relationship between TE proximity and gene expression, we measured the distance from a gene to its nearest neighboring TE, including both upstream and downstream TEs. We then separated genes into two groups, one group containing genes with the closest TE being a sRNA+TE and the other group containing genes with the closest TE being a sRNA-TE.
We then assessed the average gene expression levels at late infection (7 dpi) and compared the different groups (Figure 9). When a TE was overlapping with or contained within a gene, then genes with a sRNA+TE were expressed at significantly lower levels, on average, than genes with a sRNA-TE. We then repeated this experiment with Pgt sRNAs that are up-regulated in germinated spores and assessed the average gene expression levels in germinated spores. We did not observe a significant effect on the expression of nearby genes (Figure 9). This suggests that the proximity to a sRNA+TE or a sRNA-TE has a significant effect on the expression of genes that overlap with TEs, and that sRNA+TEs are actively silenced by the siRNAs during late infection which leads to reduced expression of the associated genes.

(A) Genes that fully or partially contain a TE targeted by a sRNA induced at 7dpi (sRNA+TE) appear silenced when compared to genes that fully or partially contain a TE not targeted by a sRNA (sRNA-TE). (B) This effect was not observed for sRNAs induced in germinated spores. The total number of observations in each group (N) is shown on the y-axis.
Discussion
Small RNAs play a vital role in regulation of gene expression and in plant-pathogen crosstalk (Weiberg et al., 2014). Previous studies on small RNA characterization in fungal plant pathogens mostly rely on sequencing of one time point of infection, which obscures the expression profiles of pathogen sRNAs over a time course of infection. For example, a previous study in the wheat stripe rust fungus (Puccinia striiformis f.sp. tritici) sequenced sRNAs at 4 dpi and found that the majority (75 %) of the predicted 20–22 nt Pst sRNAs carry a 5’ uracil (Mueth et al., 2015). The presence of distinct sRNA profiles in mycelia and appressoria tissues was suggested in the rice blast fungal pathogen, Magnaporthe oryzae (Nunes et al., 2011). However, prominent waves of sRNA expression profiles during fungal infection of plants have thus far not been reported. Through small RNA sequencing over a time course of Pgt-wheat infection, we uncovered that Pgt produces two distinct sRNA profiles during infection.
Pgt sRNA expression appears to be under tight temporal control, with 86.2% of Pgt sRNAs differentially expressed over the time course, compared to only 4.8% of wheat sRNAs. In germinated spores and during early infection, Pgt sRNAs predominantly overlap with gene models and are 21 nts in length with a 5’ uracil. A switch to 22 nt Pgt sRNAs with a 5’ adenine occurs during late infection, which coincides with formation of new urediniospores, and these 22 nt sRNAs are mostly produced from repetitive elements located in the centromeres. The presence of two distinct sRNA profiles and their differential expression during rust developmental stages has thus far not been observed and indicates functional diversification of the RNAi machinery, with a strong role in the infection and proliferation process.
Many 22 nt Pgt sRNAs with a 5’ adenine are derived from centromeric TEs, suggesting that their primary role is in maintaining genome stability during formation of new urediniospores. The specific expression of one argonaute, one dicer and two RdRPs at the late stage of infection underlines their involvement in such a functionally diversified TE silencing pathway. This is similar to what has been reported in plants which produce PTGS-associated 20-22 nt miRNAs/siRNAs and 24 nt heterochromatic sRNAs that differ in modes of biogenesis and function (Kamthan et al., 2015). In plants, TEs are silenced mainly by transcriptional gene silencing (TGS) via 24 nt small RNA-directed DNA methylation (RdDM) (Borges & Martienssen, 2015). These 24 nt sRNAs are most abundant during seed development in plants, presumably to ensure stable inheritance of the genome. We speculate that the majority of 22 nt Pgt sRNAs are responsible for silencing of repetitive elements and the majority of 21 nt Pgt sRNAs for PTGS.
The up-regulation of 22 nt sRNAs with enrichment for 5’ adenine during late infection coincides with the up-regulation of the argonaute A gene. Similarly, the preferential accumulation of 21 nt 5’ uracil sRNAs in germinated spores and during early infection correlates with high-level expression of argonaute B and relatively low level expression of argonaute A. This suggests that similar to plants, the 5’ nucleotide of Pgt sRNAs might have a strong effect on preferential loading into different argonautes. In Arabidopsis thaliana, AGO1 and AGO10 bind preferentially small RNAs with a 5′ uracil, whereas AGO2, AGO4, AGO6, AGO7 and AGO9 prefer sRNAs with 5’ adenines and AGO5 5’ cytosines (Borges & Martienssen, 2015). The results on developmental variations in the different Pgt sRNAs and argonautes from our analysis suggest that argonaute B preferentially loads sRNAs with a 5’ uracil and argonaute A preferentially binds 22 nt sRNAs with a 5’ adenine.
The high activity of 22 nt sRNAs in the later stages of infection might ensure that the genome is passed on stably to subsequent generations through methylation and condensation of centromeres. The TE silencing function can be hijacked by some genes for regulation and we showed that this occurs in Pgt genes that contain or overlap with sRNA-targeted TEs. In plants, insertion of TE near genes can provide cis-elements for stress responsive or tissue-specific expression, and the expression level can be modulated by DNA methylation and/or histone modification at the TEs. It is likely that a similar DNA methylation or histone modification mechanism exists in Pgt, which is worthy of investigation in future studies.
Using the ShortStack software which uses criteria tailored to plant miRNA properties, we predicted only a handful of Pgt sRNAs that fulfil the criteria for miRNAs. However, it is possible that Pgt produces a larger contingent of miRNA-like RNAs that follow currently unknown fungal-specific rules. For example, plant and animal miRNAs are different in many respects such as in their degree of complementarity to their target mRNA (Millar & Waterhouse, 2005). Loci with some, but insufficient, evidence for miRNA biogenesis (such as strandedness) using ShortStack might be worth exploring as miRNA-like candidates in the future (Axtell et al., 2011). We did not perform target prediction of Pgt sRNAs due to the lack of fungal-specific targeting rules and the high false positive rate of miRNA target prediction tools (Dai et al., 2018). In future studies, small RNA-sequencing specifically of haustorial tissues can help to elucidate if haustoria are the sites of sRNA transfer between host and pathogen (Shahid et al., 2018) and we can combine target prediction with gene expression data to reduce the number of false positive predictions.
Materials and Methods
Small RNA sequencing, read processing, filtering and alignment
For rust infection, host plants (cv. Sonora) were grown at high density (∼25 seeds per 12cm pot with compost as growth media) to the two leaf stage (∼7 days) in a growth cabinet set at 18-23°C temperature and 16 h light. Spores (−80°C stock) were first thawed and heated to 42°C for 3 minutes, mixed with talcum powder and dusted over the plants. Pots were placed in a moist chamber for 24 hours and then transferred back to the growth cabinet. Leaf samples were harvested at specified days after inoculation, snap frozen and stored at −80°C until use. 100 mg freshly collected spores were germinated overnight in four 15 cm petri dishes, each containing 200ml sterile RO water. Germinated spores were harvested via filtering through nylon mesh 15 μm. Small RNAs were extracted from the germinated spores and infected leaf samples with the Purelink microRNA Isolation Kit from Invitrogen. We sequenced sRNAs (50 bp reads) from the following five conditions (3 replicates each) on the Illumina HiSeq: germinated spores, uninfected wheat and infected wheat at 3 dpi, 5 dpi and 7 dpi. Adapters were trimmed using cutadapt (-m18 –M28 -q30 –trim-n –discard-untrimmed) (Martin, 2011). Untrimmed reads, reads shorter than 18 nts or reads larger than 28 nts were discarded and flanking N bases were removed from each read (Martin, 2011). FASTQC was run on the resulting reads (http://www.bioinformatics.babraham.ac.uk/projects/fastqc/).
To eliminate reads derived from non-small RNAs, we first generated a database set of potential contaminating RNA sources. Triticum aestivum and Puccinia tRNAs, rRNAs and spliceosomal RNAs were collected from the RNACentral database (Consortium, 2016) as well as the tRNA and rRNA RFAM families RF00001, RF00002, RF00005, RF01852, RF01960 and RF02543 (Nawrocki et al., 2015), snoRNAs from dbsnOPY, 5S and 23S ribosomal RNAs from the European Nucleotide Archive (ENA) and the tRNA/rRNA file from the sRNA workbench (Stocks et al., 2012). This set of potential contaminant sequences was de-duplicated using bbmap and its tool dedupe.sh (sourceforge.net/projects/bbmap/). Reads that mapped to this set were removed using bowtie 1.1.2 (Langmead et al., 2009). To assess read length distributions across the different samples, clean small RNA reads were mapped to the wheat genome IWGSC RefSeq v1.0 (International Wheat Genome Sequencing et al., 2018) and PGT 21-0 genome (Li et al., 2019) using bowtie 1.1.2 (alignment settings: no mismatches allowed –v0; report all alignments: -a –best –strata; suppress all alignments with more than 100 reportable alignments: -m100).
Gene expression analysis and repetitive element prediction
From the same infected leaf samples, previously published RNA-sequencing data (0 dpi, 2 dpi, 3 dpi, 4 dpi, 5 dpi, 6 dpi, 7dpi) was used for the gene expression analysis (Chen et al., 2017). This was complemented with previously published RNA-sequencing data of Pgt 21-0 germinated spores and haustorial tissue (Upadhyaya et al., 2014). We used Salmon 0.12.0 to align reads to the Pgt 21-0 transcripts (Li et al., 2019) and to estimate transcript abundances in each sample. We used tximport and DESeq2 to assess gene differential expression (Love et al., 2014; Soneson et al., 2015). Differentially expressed genes were annotated with the B2GO software and GO term enrichment analyses were performed with B2GO and the category molecular function (Gotz et al., 2008). Secreted proteins were predicted using using SignalP 4 (Petersen et al., 2011).
Repetitive sequences on the Pgt chromosomes were predicted using RepeatModeler 1.0.11. We filtered repeat libraries built with RepeatModeler for non-TE protein-coding sequences using the procedure described in https://blaxter-lab-documentation.readthedocs.io/en/latest/filter-repeatmodeler-library.html. The predicted repeat library was merged with the RepeatMasker database version 20160829. Repeats were then predicted using the combined library and RepeatMasker 4.0.6.
Hi-C data analysis
Previously published Hi-C data (Li et al., 2019) available in NCBI under BioProject PRJNA516922 was analyzed using HiC-Pro 2.11.1 (Servant et al., 2015) and contact maps were plotted with HiCExplorer’s hicPlotMatrix (Ramirez et al., 2018) to identify centromeric regions.
Pgt sRNA prediction, differential expression analysis and allelic sRNA prediction
To annotate and quantify high-confidence Pgt and wheat small RNAs from the sequencing data, we used the ShortStack 3.8.5 software (Axtell, 2013) on the clean sRNA reads, allowing no mismatches (--bowtie_m 100, -v0). We further filtered the predicted sRNA clusters to include only those where >= 80% of reads are within 20-24 nts of length (recommended procedure in ShortStack to avoid degradation products) and where the cluster has >= 5 reads per million. The ShortStack software outputs sRNA cluster properties such as the most abundant sRNA (termed sRNA candidate) in the cluster, strandedness of the locus, miRNA annotation and phasing (Axtell, 2013). Strandedness of sRNA loci is determined by forcing the bowtie aligner to select one strand or the other with a probability that is proportional to the number of best sites on the strand. Stranded loci are typical of miRNA production in plants and are a requirement for annotation of a locus as a miRNA by ShortStack. We used the read counts returned by ShortStack for all predicted sRNA clusters and used edgeR (Robinson et al., 2010) to assess which are differentially expressed at any of the infection stages versus germinated spores (FDR < 0.05, fold change > 2).
All plots were produced using Ggplot2 (Wickham, 2009) and statistical significance was assessed with t-tests using the ggsignif package (https://cran.r-project.org/web/packages/ggsignif/index.html). Significance thresholds according to t-test are: NS, not significant; *, < 0.05; **, < 0.01; ***, < 0.001.
To assess if sRNAs have a homologous counterpart, we re-mapped the sequencing reads that define a sRNA locus to the remainder of the genome using bowtie 1.1.2 (alignment settings: two mismatches allowed –v2; report all alignments: -a –best –strata; suppress all alignments with more than 100 reportable alignments: - m100). If more than 25% of bases in a sRNA locus are covered by those mapped reads (using bedtools coverage version 2.28.0), it is marked as a candidate homolog. The sRNA locus with the highest coverage amongst the candidate homologs is returned as the predicted allelic counterpart. Circos 0.69.5 (Krzywinski et al., 2009) was used to plot the links between homologous sRNAs across the chromosomes.
The genomic origins of sRNAs was assessed using bedtools intersect -f 0.25 -F 0.25 and the genomic coordinates of the sRNA loci and the TEs/gene annotations.
To assess the relationships of sRNAs and TEs, we re-mapped up-regulated sRNAs to the genome using bowtie 1.1.2 (alignment settings: no mismatches allowed –v0; report all alignments: -a –best –strata; suppress all alignments with more than 100 reportable alignments: -m100). We reported repeats that overlap with those mapped sRNAs using bedtools intersect -a and those that do not overlap with mapped sRNAs using bedtools intersect -v. We then retrieved the genes that overlap with repeats using bedtools closest.
Availability of data and material
All scripts as well as code for generating the figures of this paper are available at https://github.com/JanaSperschneider/Publications_Code/2019_12_StemRust_smRNA_Paper. Sequence data for the Pgt infection RNAseq is available at the National Center for Biotechnology Information Sequencing Read Archive under bioproject PRJNA415866. Sequence data for the Pgt small RNAseq is available at CSIRO Data Access Portal under https://doi.org/10.25919/5bd93643b1e41. Hi-C is available in NCBI under BioProject PRJNA516922
Supplementary File S1: FASTA file of predicted Pgt siRNAs.
Supplementary File S2: FASTA file of predicted Pgt miRNAs.
Supplementary File S3: FASTA file of predicted wheat siRNAs.
Supplementary File S4: FASTA file of predicted wheat miRNAs.
Supplementary File S5: FASTA file of Pgt sRNAs predicted to be up-regulated in germinated spores.
Supplementary File S6: FASTA file of Pgt sRNAs predicted to be up-regulated in 3 dpi and/or 5 dpi.
Supplementary File S7: FASTA file of Pgt sRNAs predicted to be up-regulated in 7 dpi.
Supplementary File S8: FASTA file of Pgt sRNAs predicted to have no differential expression.
Supplementary File S9: Plots of Pgt chromosomes and their properties.
Acknowledgements
We thank Xiaodi Xia for excellent technical assistance. JS is supported by an Australian Research Council Discovery Early Career Researcher Award 2019 (DE190100066). BS is supported by an ARC Future Fellowship (FT180100024). We acknowledge funding support from the 2Blades Foundation.
References


