

Abstract
Analyzing the spatial organization of molecules in cells and tissues is a cornerstone of biological research and clinical practice. However, despite enormous progress in profiling the molecular constituents of cells, spatially mapping these constituents remains a disjointed and machinery-intensive process, relying on either light microscopy or direct physical registration and capture. Here, we demonstrate DNA microscopy, a new imaging modality for scalable, optics-free mapping of relative biomolecule positions. In DNA microscopy of transcripts, transcript molecules are tagged in situ with randomized nucleotides, labeling each molecule uniquely. A second in situ reaction then amplifies the tagged molecules, concatenates the resulting copies, and adds new randomized nucleotides to uniquely label each concatenation event. An algorithm decodes molecular proximities from these concatenated sequences, and infers physical images of the original transcripts at cellular resolution. Because its imaging power derives entirely from diffusive molecular dynamics, DNA microscopy constitutes a chemically encoded microscopy system.
Introduction
The spatial organization of genomes and gene products within cells and tissues is at the foundation of differentiation, specialization, and physiology in higher organisms. For example, in the central nervous system, neurons express protocadherins and neurexins in highly diverse spatial patterns that govern the cell’s intrinsic state and how it forms synapses (1,2). In the immune system, spatial co-localization of B- and T-lymphocytes expressing diverse immune receptors permits signaling feedback critical for immune clonal selection (3). In the gut, epithelial, immune, endocrine, and neural cells are spatially distributed in specific ways that impact how we sense and respond to the environment, with implications for autoimmune disease, food allergies, and cancer. In tumors, cell microenvironments may be critical for tumorigenesis (4,5), immune surveillance and dysfunction, invasion, and metastasis.
Although imaging of cells and tissues has been a cornerstone of biology ever since cells were discovered under the light microscope centuries ago, a gap has emerged between these methods and genomic measurements. Although both forms of measurement characterize a single biological reality, they profile the microscopic world differently. Microscopy in itself illuminates spatial detail, but does not capture genetic information unless it is performed in tandem with separate genetic assays. Conversely, genomic and transcriptomic sequencing do not inherently capture spatial details.
Recent approaches to bridge this gap rely on optical readouts that require elaborate experimental systems (6), physical registration and capture of molecules on grids (7,8), or an assumption of similarity among multiple samples so that distinct experiments performed on distinct specimens may be correlated (9,10). These approaches closely follow the two ways in which microscopic images have been acquired to date: (1) detecting electromagnetic radiation that has interacted with or been emitted by a sample, or (2) interrogating known locations by physical contact or ablation.
Here, we propose a novel third modality for microscopy, which requires neither optics nor physical capture from known coordinates, but relies on image reconstruction from point-proximity of individual molecules (Fig. 1). This principle, of determining coordinates not in relation to an absolute “Archimedean point” but instead in relation to one another, features prominently in the theory of sensor localization (11). Numerical work has further shown that sparse and noisy measurements of pairwise distances between points can be used to reconstruct their positions (12). We build on this theoretical concept to demonstrate a novel form of microscopy, called DNA microscopy. DNA microscopy reformulates the point-localization problem by reconstructing the positions of molecules using the stochastic output of a stand-alone chemical reaction. We confirm that DNA microscopy is able to resolve the physical dimensionality of a specimen, and then demonstrate that it is able to accurately reconstruct a multicellular ensemble de novo without optics or any prior knowledge on the organization of biological specimens.

(A-B) Method steps. Cells are fixed and cDNA is synthesized for beacon and target transcripts with randomized nucleotides (UMIs), labeling each molecule uniquely (A). In situ amplification of UMI-tagged cDNA directs the formation of concatemer products between beacon and target copies (B). The overhang-primers responsible for concatenation further label each concatenation event uniquely with randomized nucleotides, generating unique event identifier (UEIs). Paired-end sequencing generates read-outs including a beacon-UMI, a target-UMI, the UEI that associates them, and the target gene insert (C). A bird’s-eye view of the experiment (D) shows the manner in which the DNA microscopy reaction encodes spatial location. Diffusing and amplifying clouds of UMI-tagged DNA overlap to extents that are determined by the proximity of their centers. UEIs between pairs of UMIs occur at frequencies determined by the degree of diffusion cloud overlap. These frequencies are read out by DNA sequencing, and inserted into a UEI matrix (E) that is then used to infer original UMI positions (F).
Finally, we demonstrate its ability to resolve and segment individual cells for transcriptional analysis.
Results
DNA microscopy for spatio-genetic imaging
Intuitively, DNA microscopy generates images by first randomly tagging individual DNA or RNA molecules with DNA-molecular identifiers. Each deposited DNA-molecular identifier then “communicates” with its neighbors through two parallel processes. The first process broadcasts amplifying copies of DNA-molecular identifiers to neighbors in its vicinity via diffusion. The second process encodes the proximity between the centers of overlapping molecular diffusion clouds: DNA-molecular identifiers undergo concatenation if they belong to diffusion clouds that overlap. Finally, an algorithm infers from these association rates the relative positions of all original molecules.
DNA microscopy is premised on the notion that DNA can function as an imaging medium in a manner equivalent to light. In the same way that light microscopy images molecules that interact with photons (either due to diffraction or scattering or because these molecules emit photons themselves) and encodes these images in the wavelengths and directions of these photons, DNA microscopy images molecules that interact with DNA (including DNA, RNA, or molecules that have been tagged with either DNA or RNA) and encodes these images in the DNA sequence products of a chemical reaction.
With this analogy in mind, we can imagine superposing two distinct physical processes: a fluorophore radially emitting photons at a specific fluorescence wavelength, and a DNA molecule with a specific sequence undergoing PCR amplification, and its copies diffusing radially. Optical microscopes use lenses to ensure that photons hitting a detector or the human eye will retain some information, based on where they hit, regarding their point of origin. However, the “soup” of DNA molecules generated in a DNA microscopy reaction does not afford this luxury. We therefore need a different way to distinguish the identities of point sources so that all data is encoded into the DNA itself.
To molecularly distinguish point sources we rely on Unique Molecular Identifiers, or UMIs (13), consisting of randomized bases that tag a molecule before any copy of it has been made (Fig. 1A). Because the diversity of UMIs scales exponentially with their length, we have high confidence that when one long UMI tags a molecule, no other molecule in the rest of that sample has been tagged with that same long UMI. We can now use overlap extension PCR to concatenate the diffusing and amplifying copies of these UMIs (with any biological DNA sequences they tag simply carried along). The rate at which they concatenate will reflect the distance between their points of origin.
However, once we sequence the final DNA products, we are still left with the problem of how to quantitatively read out these concatenation rates from DNA sequence alone. Using read-abundances belonging to concatenated DNA products carries serious drawbacks. For example, trace crosscontamination between samples could easily introduce artifactual UMI-UMI associations, and biases in downstream DNA library preparation could heavily distort association frequencies. Most serious, however, would be PCR chimerization: any ex situ amplification of the DNA library would necessarily introduce template-switching at some rate that would corrupt the data.
We reasoned that if the overlap extension primers contained randomized bases that did not participate in priming themselves, then although each priming event would result in replacement of this randomized sequence, each overlap extension event would fix the new bases in between the now-concatenated sequences (Fig. 1B). The concatenated sequences would then carry these randomized bases forward, intact, as they amplified. These bases would from then on be a unique record of that individual concatenation event. We called these new concatenated randomized sequences Unique Event Identifiers, or UEIs, and used them to encode molecular positions into the DNA microscopy reaction.
Experimental assay for DNA microscopy to encode relative positions of molecules in cells
To demonstrate DNA microscopy, we aimed to image transcripts belonging to a mixed population of two co-cultured human cell lines, GFP-expressing MDA-MB-231 cells and RFP-expressing BT-549 cells. We reasoned that an initial proof of concept would be to recover images that appear cell-like and where GFP and RFP transcripts are positioned in mutually-exclusive cells, whereas GAPDH and ACTB, expressed in both cell lines, are ubiquitous.
In the first step of the experiment, we tag with Unique Molecular Identifiers (UMIs) cDNA synthesized in situ. We designed reaction chambers to both grow cells and perform all reactions (Fig. S1, Supp. Info.). We cultured the cells, and, following fixation and permeabilization, synthesized cDNA by reverse transcription from GFP, RFP, GAPDH, and ACTB gene transcripts (Tables S1–S2), with primers tagged with 29nt long UMIs (Fig. 1A, Fig. S2). Notably, we designed the reaction to distinguish two types of UMI-tagged cDNA molecules: “beacons”, synthesized from ACTB (chosen as a universally expressed gene whose sequence would not be analyzed in later stages), and “targets” (everything else). We achieved this distinction between beacon and target amplicons by the artificial sequence-adapters assigned to the primers annealing to each.
In the second step of the experiment, we allow beacon-cDNA and target-cDNA molecules, along with the UMIs that tag them, to amplify, diffuse, and concatenate in situ in a manner that generates a new Unique Event Identifier, or UEI, distinct for each concatenation event (Fig. 1B and S2) through overlap-extension PCR (14). By design, target amplicon-products will only concatenate to beacon amplicon-products, thereby preventing self-reaction, and the middle of each overlap-extension primer includes 10 randomized nucleotides, such that each new concatenation event generates a new 20-nucleotide UEI. Paired-end sequencing of the final concatenated products generates reads each containing a beacon UMI, a target UMI, and a UEI associating them (Fig. 1C).
The key to DNA microscopy is that because UEI formation is a second order reaction involving two UMI-tagged PCR amplicons, UEI counts are driven by the co-localization of UMI concentrations, and thus contain information on the proximity between the physical points at which each UMI began to amplify (Fig. 1D). In particular, as UMI-tagged cDNA amplifies and diffuses in the form of clouds of clonal sequences that overlap to varying extents, the degree of overlap (Fig. 1D, circle intersection) – and thus the probability of concatenation and UEI formation – depends on the proximity of the original (un-amplified) cDNA molecules (Fig. 1D, small dark circles). UMI-diffusion clouds with greater overlap generate more UEIs/concatemers, whereas those clouds with less overlap generate fewer UEIs/concatemers.
To obtain reliable estimates of UEIs between every pair of UMIs, we must address sources of noise, such as sequencing error. We cluster beacon-UMIs, target-UMIs, and UEIs by separately identifying “peaks” in read-abundances using a log-linear time clustering algorithm (Supp. Info., Fig. S3A) in a manner analogous to watershed image segmentation, but in the space of sequences. For target UMIs, this allows us to aggregate biological gene sequences originating from single target molecules and achieve low error rates by taking a consensus of the associated reads (Fig. S3B). We then assign each identified UEI a single consensus beacon-UMI/target-UMI pair based on read-number plurality, and prune the data (by eliminating UMIs associating with only one UEI) to form a sparse matrix whose elements contained integer counts of UEIs pairing each beacon-UMI (matrix rows) and each target-UMI (matrix columns) (Fig. 1E, Supp. Info.). The resulting UEI matrices, containing on the order 105 -106 total UMIs, and averaging ~10 UEIs per UMI (Table S3), form the data sets upon which we built an engine for image inference.
A “zoom” function infers local spatial encodings from UEI matrices
Next, we developed an algorithmic approach to use UEI prevalence to infer UMI proximity and reconstruct an image of the original sample and its transcripts (Fig. 1F). We first appreciate that if the UEI matrix had successfully encoded relative UMI coordinates, these coordinates would be reflected in the rows and columns of the matrix. The matrix rows and columns would span a space having a dimensionality scaling with the total number of UMIs. However, if they encoded UMI coordinates within a sample, they would collectively sweep out a far smaller dimensionality, only equal to the physical dimensionality of the sample.
As a toy example, consider a comparison between three systems in which a single target UMI (“2”) is in each of three positions in one dimension relative to two beacon UMIs (“1” and “3”) with which it forms UEIs (Fig. 2A). The target UMI begins closest to one of the two beacon UMIs, and as a result, its diffusion cloud overlaps most with that beacon UMI’s diffusion cloud. Thus, its reaction rate with that beacon UMI is relatively higher (Fig. 2B) and results in a correspondingly larger number of UEIs (Fig. 2C). If the target UMI is further away, the balance of overlaps between diffusion clouds changes. Indeed, plotting expected UEI matrix elements for the target UMI on two axes, we see that its trajectory remains onedimensional (Fig. 2D). Extending to a large population of target UMIs across many positions, these new target UMIs, just like the target UMI in the original example, also interact with the same two beacon UMIs. Therefore, we can also plot them on the same two axes, and wherever they land, we could expect them to scatter around the same onedimensional manifold followed by the target UMI of the original example. In any real data set, UEI count is affected not only by position but also by additional variables (such as amplification biases and diffusion rates), each potentially adding to the data’s total dimensionality. However, these sources of variation would be suppressed along the principle dimensions of a UEI matrix so long as their effect on neighboring UMIs is not systematically correlated.
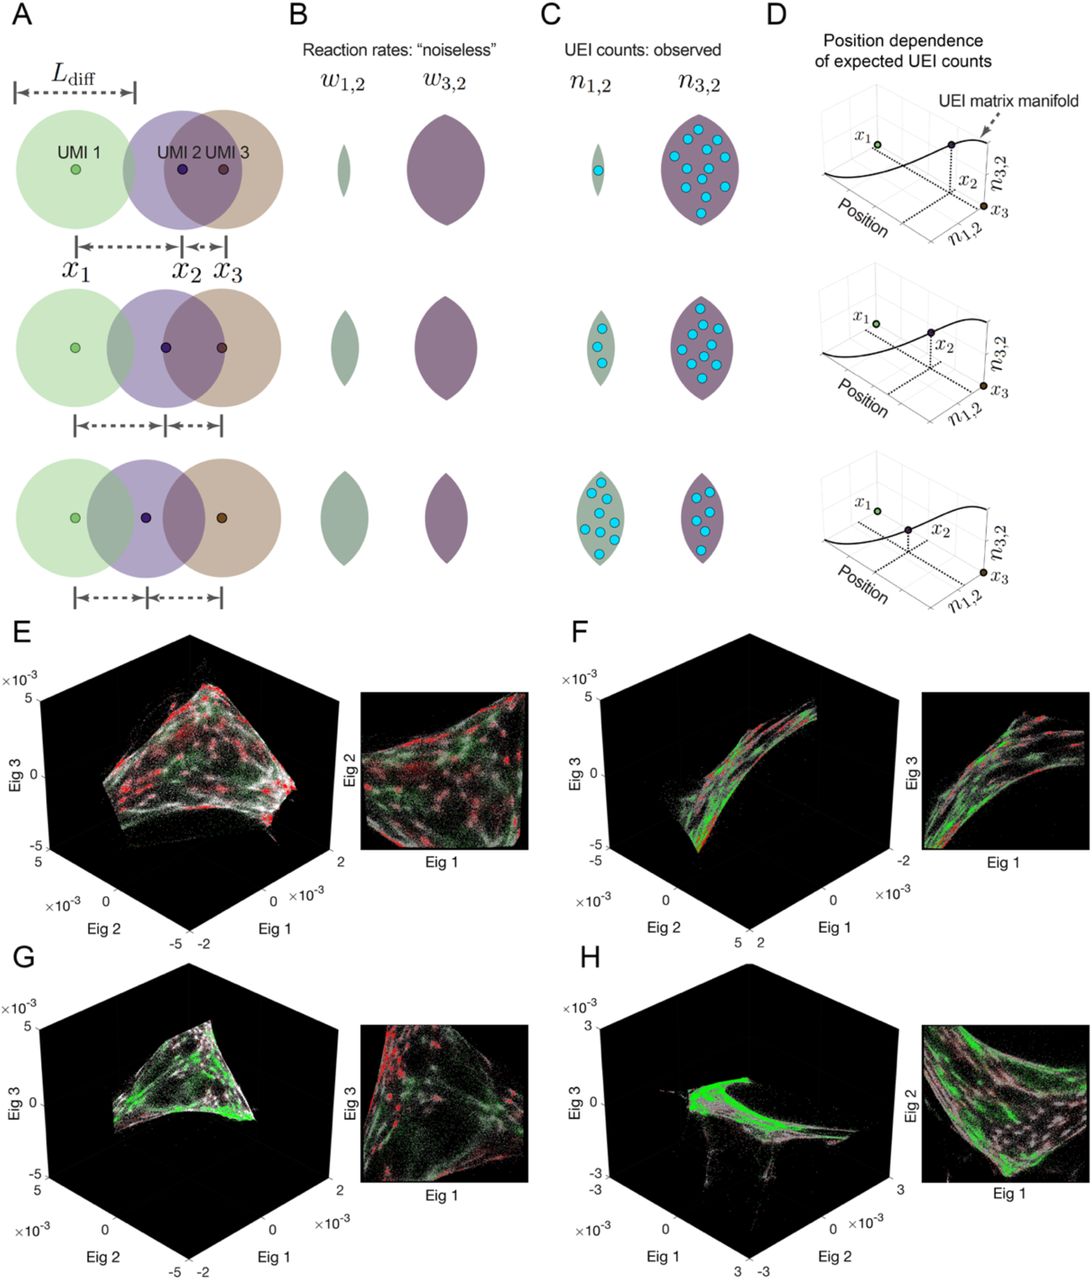
Diffusion profiles with length scale Ldiff belonging to different amplifying UMIs overlap to degrees that depend on the distance between their points of origin (A). Greater overlaps between diffusion profiles result in larger reaction rates (B), which in turn result in higher UEI formation frequencies (C). Because UEI counts are therefore proper functions of position, as a UMI relocates it sweeps out a curve along the UEI count axes equal to the dimensionality of space it occupies (D). (E-H) Data segmentation permits individual sets of 104 strongly interacting UMIs to be visualized independently. The top three non-trivial eigenvectors for the largest data segments of samples 1 and 2 are shown, along with a different, magnified view of the same plot. Transcripts are colored by sequence identity: grey = ACTB (beacons), white = GAPDH, green = GFP, red = RFP.
To identify the principle dimensions of the UEI matrix, we can analyze the graph of UMI vertices and weighted UEI count edges by constructing a Graph Laplacian matrix from the raw UEI matrix (with its diagonal elements set so that each row sums to zero). The Graph Laplacian eigenvectors with the smallest-magnitude eigenvalues would visualize the most systematic forms of variation in the DNA microscopy data (Supp. Info.) and illuminate the low-dimensional manifold, if any, it occupied. However, even a low-dimensional manifold could be folded in complex ways in the high-dimensional space formed by a full UEI matrix, making it difficult to analyze the manifold’s shape over large distances, especially in areas of the manifold that were sparsely populated. Analyzing the UEI matrix manifold therefore first requires analyzing UMI subsets corresponding to local regions of the original sample. We return to global relations in subsequent sections.
To perform this local investigation, we developed a “zoom” function for DNA microscopy data by applying a recursive graph-cut algorithm, identifying putative cuts by using the spectral approximation to the cut of minimum-conductance (15) (Supp. Info.). This criterion separates sub-sets of UMIs exhibiting UEI-flux between them that was relatively small given the number of UMIs they comprised. The algorithm first finds the sparsest cut to the entire data set, then the sparsest cuts to the resulting halves, and so on until a further sparse cut cannot be made (Supp. Info.). We then visualize each of these sub-regions by the eigenvectors corresponding to the smallest-magnitude eigenvalues of their UEI-Graph Laplacian sub-matrix.
Successful inference of local structure identifies cell-like structures with specific marker expression
Strikingly, and consistent with our theoretical reasoning, although the UMIs in these subsets fully spanned at least all three eigenvector dimensions, the manifolds swept out by the UMIs were only two-dimensional (Fig. 2E-H). This confirmed that neighborhoods of points had been successfully encoded into the UEI matrix: the dimensionality of their spatial relationships within the sample was correctly preserved.
The two-dimensional manifolds exhibited clusters of UMIs that recapitulated the genetic composition of the cell lines used in the experiment: a pervasive distribution of the constitutively-expressed ACTB and GAPDH sequences, but a mutually exclusive distribution of GFP and RFP, recapitulating their correct cell specific expression (Fig. 2E-H). An observer unaware of the spatial dimensionality of the specimen or that cells even existed could discover both by analyzing the DNA microscopy sequencing data alone. Together, these two observations confirmed both cellular and local supra-cellular resolution in DNA microscopy.
Inference of global molecular positions from DNA microscopy data
Next, we expanded our inference beyond the local scope of a few thousands of proximal transcript molecules, by developing a framework for evaluating the likelihood of a global position-estimate solution.
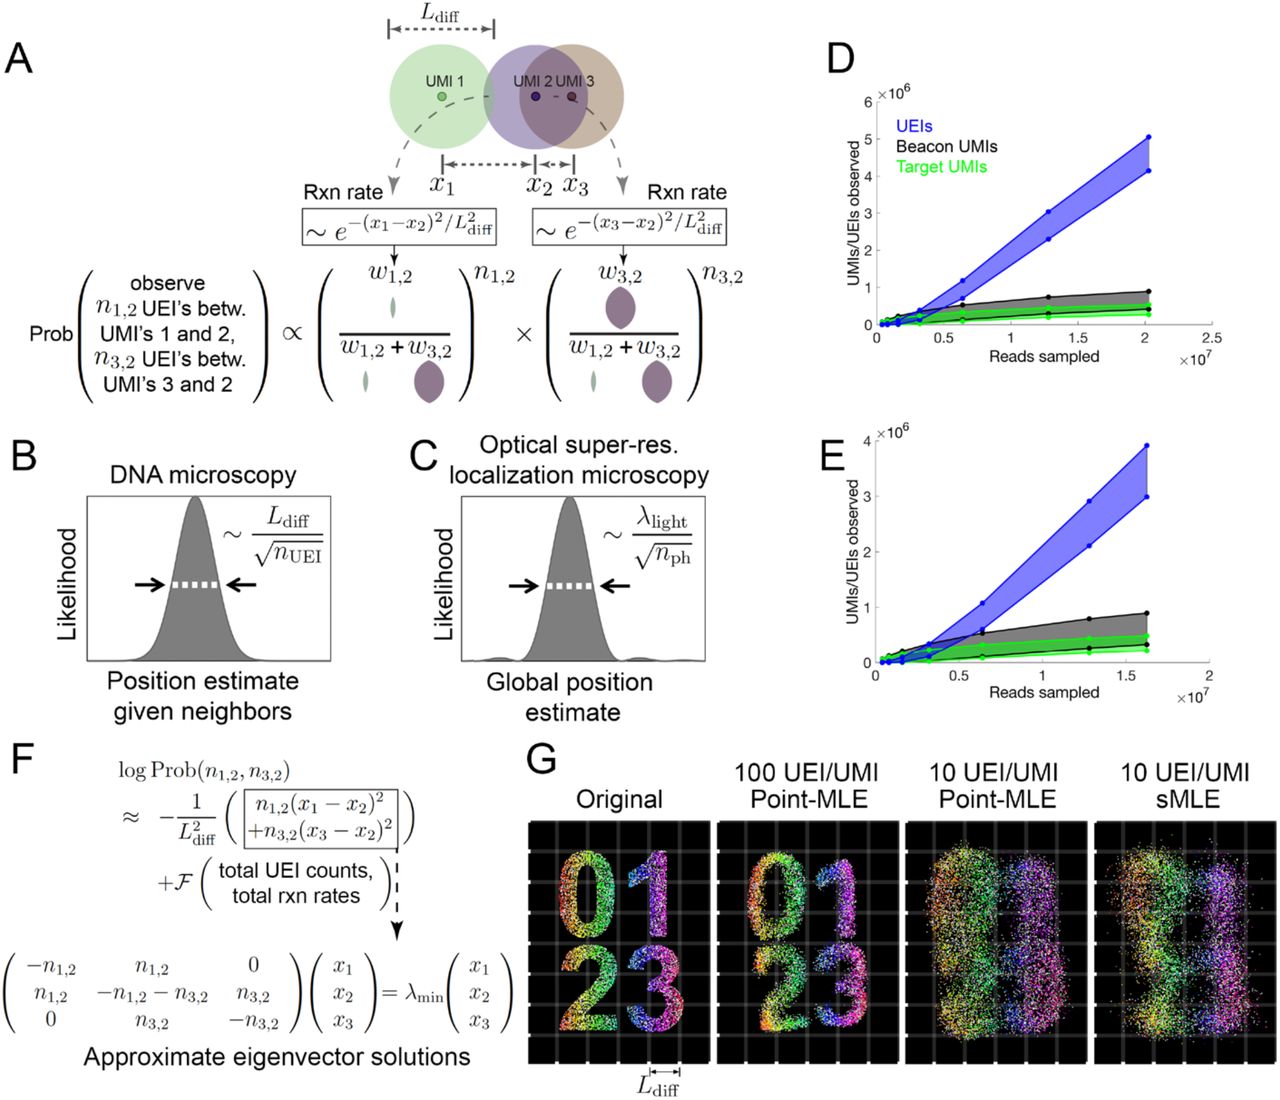
We reasoned that each UEI’s occurrence is analogous to a “coin-toss” experiment performed on every UMI-pair, with each pair’s “meeting” probability proportional to the corresponding reaction rate (Fig. 3A, Supp. Info.). In this probability function, UEIs in DNA microscopy act in the same manner as photons do in optical super-resolution localization microscopy (16): both narrow a point-spread function governed by a physical length scale (wavelength in the case of light, diffusion distance in the case of DNA) as they accrue in number (Fig. 3B,C). In real data sets, UEIs increase progressively with increasing read depth, whereas UMIs saturate more quickly (Fig. 3D,E). In this way, read depth in DNA microscopy constitutes a dial to increase the number of UEIs per UMI, enhancing an image’s resolution.

(A) Modeling diffusion of amplifying UMIs as isotropic across length scale Ldiff allows the likelihood of a UMI-position solution to be evaluated given observed UEI counts. (B,C) Uncertainty in DNA vs. super-resolution microscopy. Given its reacting partners’ positions, DNA microscopy (left) defines a UMI’s uncertainty as a physical length-scale (DNA diffusion distance, Ldiff) divided by the square-root of the number of individual quanta measured (UEIs) in a manner analogous to quanta (photons) in super-resolution microscopy (right). (D,E) Rarefaction of UMI and UEI data. Shown are curves with an upper-bound, indicating total UMI/UEI counts, and a lower-bound, indicating those from the final pruned UEI matrix, for samples 1 (D) and 2 (E). (F) The sMLE algorithm uses eigenvector solutions to part of the position-probability function to identify a linear basis for the solution to the full likelihood function. (G) sMLE enhances performance in free-diffusion simulation tests. From left: original image, results from point-MLE on simulated images with 100 or 10 UEIs/UMI, and from sMLE with 10 UEIs/UMI.
Unlike its optical counterpart, however, DNA microscopy resolves a molecule’s position by orienting it relative to other molecules, and its uncertainty is therefore a function of these relationships. A relationship between two UMIs may come in two forms: those that are direct and involve UEIs linking them, and indirect relationships that occur via intermediaries. The latter emerges in the structure of the data, but will not strongly influence UMI positions if these positions are optimized independently. This may be seen in the logarithm of the UEI-count probability function (Fig. 3F). This log-probability is the sum of two components: (1) a sum of squared-differences between positions, weighted by individual UEI counts; and (2) a function of total UEI counts and total expected reaction rates (which are themselves functions of UMI positions) across the entire data set. In order to still calculate the log-probability as a whole in a scalable way, we implemented the Fast Gauss Transform (17) (Fig. S6).
If each UMI’s position is updated independently to maximize this log-probability function, it will experience two forces, corresponding to the function’s two added components: the first which pulls together UMIs that have directly formed UEIs between them, and the second which repels all UMIs from all other UMIs. The likelihood of the position-solution is maximized when these two forces balance. During the maximization update-process, the only way in which an indirect relationship between UMIs will influence their position-solution is if intermediary UMIs that directly form UEIs with them separately have already changed position.
To ensure that large-scale optimization captures these indirect UMI relationships encoded in the data, we developed a new maximum likelihood framework, which we called spectral maximum likelihood estimation or sMLE, to generate global representations of the DNA microscopy data. Because maximizing the first component of the log-probability entails minimizing the magnitude of the sum of squared-differences, it can be individually solved by identifying the smallest-magnitude eigenvalue/eigenvector pairs of the UEI Graph Laplacian introduced earlier (Fig. 3F, Supp. Info.). Each eigenvector represents a distinct way in which UMIs can be globally rearranged to suit orientation requirements expressed by the sum of squared-differences between local points. The eigenvector with the smallest-magnitude eigenvalue represents the best arrangement, the second smallest-magnitude eigenvalue the second best, and so on. Because sums of eigenvector solutions to the local linear problem would produce solutions that themselves satisfy local constraints, sum-coefficients of these eigenvectors could act as variables in a larger-scale likelihood maximization. By seeding a solution with the two eigenvectors corresponding to the smallest-magnitude eigenvalues, optimizing their coefficients, then incorporating successive eigenvectors and repeating, we could find global solutions that were also well-constrained locally. These sMLE solutions showed strong advantages in simple simulations over maximizing the likelihood while treating every UMI independently, especially when UEI counts were limiting (Fig. 3G).
DNA microscopy correctly recapitulates optical microscopy data
We next sought to apply the sMLE inference framework to determine whether DNA microscopy could resolve supra-cellular coordinates compared to optical microscopy. To this end, we constructed reaction chambers with glass slides (Fig. S1B) and plated GFP-and RFP-expressing cells in a highly localized pattern within the chamber (Fig. S1C). We then imaged GFP- and RFP-expression in cells across the entire area of the reaction chamber using an epifluorescence microscope before the DNA microscopy reaction (Fig. 4A,B), sequenced the resulting DNA library to saturation (Fig. 4C), and applied the sMLE inference algorithm.
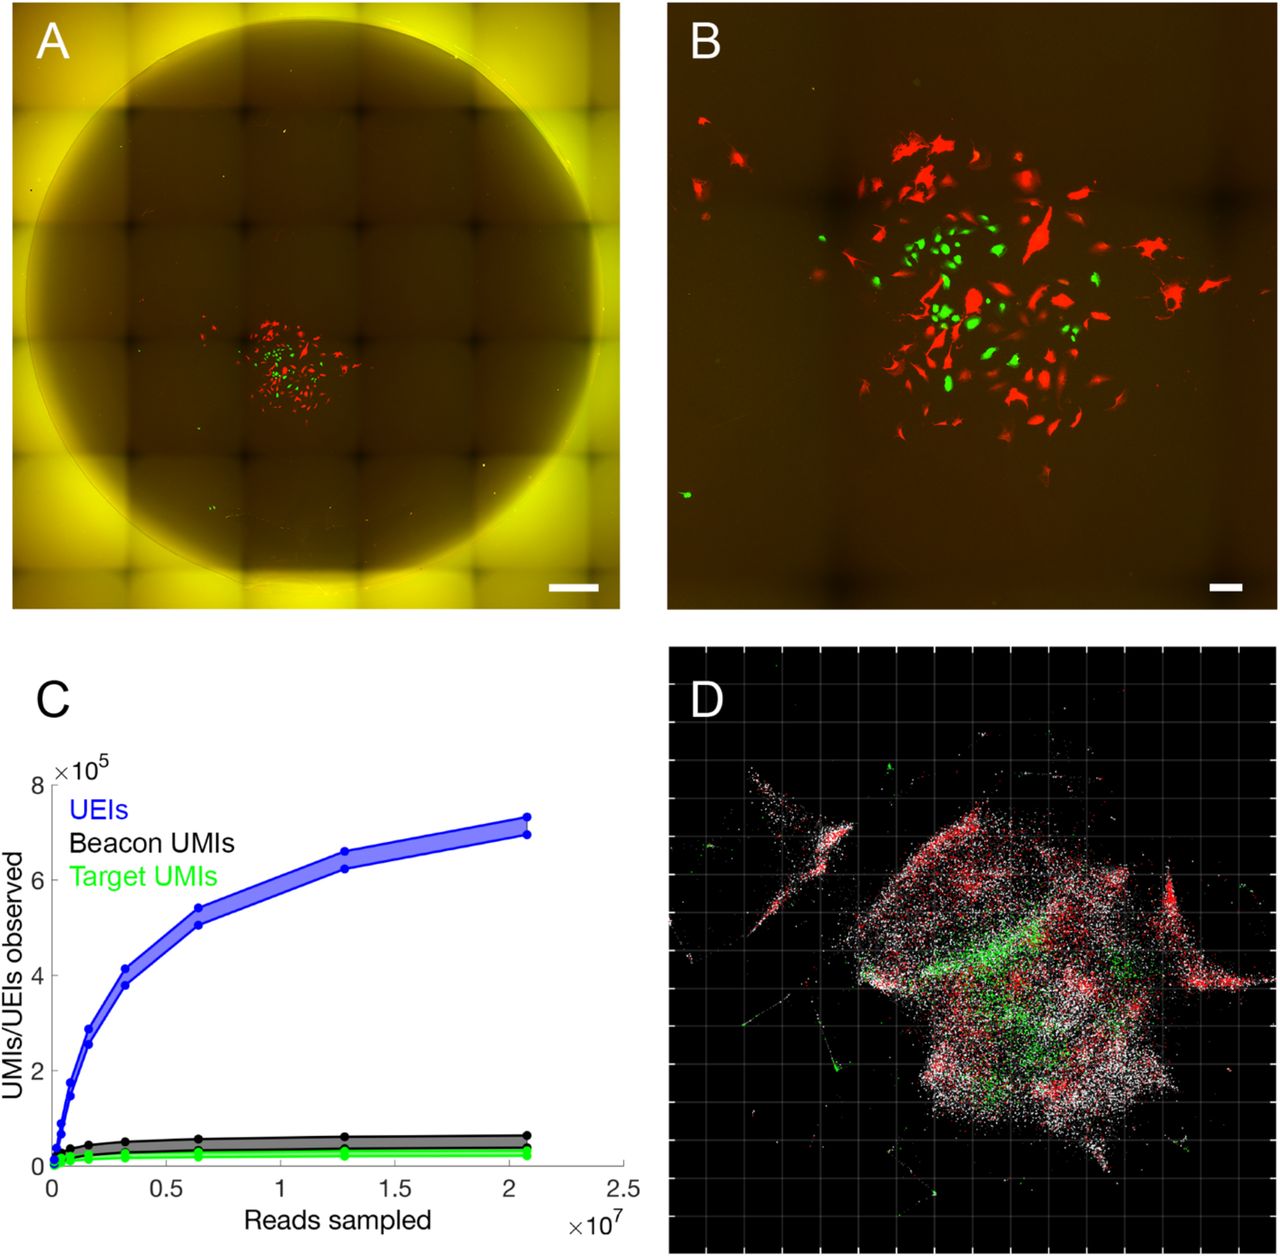
(A) Full reaction chamber view of co-cultured GFP- and RFP-expressing cells (scale bar = 500 um). (B) Zoomed view of the same cell population (scale bar = 100 um). (C) Rarefaction of UMIs and UEIs with increasing read-sampling depth. (D) sMLE inference applied to DNA microscopy data, reflected/rotated and rescaled for visual comparison with photograph. Transcripts, sequenced to 98 bp, are colored by sequence identity: grey = ACTB (beacons), white = GAPDH, green = GFP, red = RFP. Grid-line spacings: diffusion length-scales (Ldiff), emerging directly from the optimization (Supp. Info.).
Strikingly, the resulting image recapitulates optical microscopy data without systematic distortion (Fig. 4D) in both the shape of the cell population boundary, as well as the distribution of GFP- and RFP-expressing cells within it. Importantly, the inferred image preserves the correct aspect ratio: although needing to be rotated and reflected, the individual axes did not need to be independently re-scaled. This demonstrated that DNA microscopy is capable of generating accurate physical images of cell populations.
Large length-scale optimization and the folded manifold problem
We next sought to apply DNA microscopy to optimization at larger length scales. Applying sMLE inference to the original data generated from several hundred cells used to generate the original eigenvector representations (Fig. 2) gave images that reproduced the individual cell compositions of the earlier visualizations (Fig. 5). These large-scale optimizations were also robust to data down-sampling (Fig. S4). Nevertheless, the reconstructed images exhibited “folding” that indicated how the process of projecting large and curved high-dimensional manifolds onto two-dimensional planes was vulnerable to distortions. The causes for this “manifold folding” problem could be understood by examining the illustration of how low-dimensional manifolds come into being within a high-dimensional UEI data matrix (Fig. 2). Eigenvector calculation (Fig. 3F) involves identifying hyperplanes that can be drawn through these low-dimensional manifolds that maximally account for variation in the UEI data. It does this in a manner similar to linear regression, balancing the advantage of fitting certain parts of the data with the costs of not fitting other parts of the data.

Inferred large scale DNA microscopy images preserve cellular resolution. Inference using the sMLE global inference approach for sample 1 (A-E) and sample 2 (F-J), with each transcript type shown separately (A-D, F-I) or together (E and J) (although inferences are performed on all transcripts simultaneously and are blinded to transcript identity). Grid-line spacings: diffusion length-scales (Ldiff) emerging directly from the optimization (Supp. Info.).
However, this balancing can yield errors in several ways. If a large number of UMIs in one part of the data set rotate the top calculated eigenvectors (with the smallest-magnitude eigenvalues) away from UMIs in a different part of the data set, then projecting the global data set onto these eigenvectors will cause these neglected UMIs to fold on top of one another. This will produce the type of artifact observed for large scale optimization (Fig. 5). If we avoid eigenvector calculation entirely and optimize each UMI’s position independently (Fig. S5A,B) we avoid such defects, but obtain close-packed images, as predicted by simulation (Fig. 3G), that do not preserve empty space. This highlights the distinct nature of DNA microscopy’s imaging capabilities compared to light’s, where density rather than sparsity is the key challenge.
Cell segmentation can be performed on the UEI matrix based on diffusion distance
We next analyzed the degree to which the UEI matrix could be used to segment cells and analyze single cell gene expression. Importantly, up to this point, no step in the process – experimental or computational – had knowledge that cells even exist. To perform segmentation, we applied the same recursive graph cut algorithm as used earlier to generate local eigenvector visualizations of the data. By increasing the conductance-threshold dictating whether segments of the data should be left intact, we assigned transcripts to putative cells (Fig. 6A,B), again without regard to transcript identity (i.e., GFP vs. RFP). To quantify segmentation quality, we calculated the probability that, within each putative cell, the minority fluorescent gene transcript would occur at or lower than its current value, given its prevalence in the data set. We found the median p-value decayed rapidly, over a range of conductance thresholds, to <10−10, with increasing reads and resolved cells analyzed (Fig. 6C,D).

(A,B) Data segmentation recovers putative cells without a priori knowledge. Cell segmentation for samples 1 (A) and 2 (B) by recursive graph-cutting of the UEI matrix is shown with a random color assigned to each inferred cell, qualifying if it contained at least 50 UMIs and had at least one transcript each of ACTB and GAPDH. The minimum conductance threshold was set to 0.2. (C,D) Segmentation performance. The effects of cell segmentation for samples 1 (C) and 2 (D) with minimum conductance thresholds 0.14 (black), 0.2 (cyan), and 0.26 (magenta) are shown on binomial p-values quantifying segmentation fidelity (solid lines) and putative cell count (dotted lines).
Imaging large numbers of different transcripts in DNA microscopy
To demonstrate that DNA microscopy and its associated cell segmentation could be extended to larger numbers of genes, we synthesized cDNA by reverse transcription from up to 20 additional genes that were known to be differently enriched in MDA-MB-231 and BT-549 cell lines (Tables S4–S5, Supp. Info.). We performed global image inference (Fig. S5) and applied the same hierarchical cell segmentation algorithm as earlier. Pearson correlations between GFP-fraction (out of total transgene transcripts per cell) and fraction of endogenous genes expected enriched in the GFP cell line (out of total endogenous gene transcripts enriched in either cell line) gave r = 0.29-0.41 (n=764 and 265) for two experiments, respectively (p-value<10−6, permutation test). This demonstrated that the transgenes labeling these cell types retained information about cell type-specific endogenous expression, and that this information could be read out from DNA microscopy data.
Discussion
The fundamental advance of DNA microscopy is to physically image biological specimens using an unstructured and standalone chemical reaction. This makes it a distinct microscopic imaging modality in itself. As a technology, we have drawn a close parallel between DNA microscopy and optical super-resolution: both take advantage of stochastic physics to reduce measurement uncertainty beyond what may seem superficially to be a limit imposed by physics.
However, the two differ in several fundamental ways. Optical super-resolution microscopy relies on the quantum mechanics of fluorescent energy decay. DNA microscopy, however, relies entirely on thermodynamic entropy. The moment we tag biomolecules with UMIs in the DNA microscopy protocol, the sample gains spatially-stratified and chemically-distinguishable DNA point sources. This process thereby introduces a spatial chemical gradient across the sample that did not exist previously. Once these point sources begin to amplify by PCR and diffuse, this spatial gradient begins to disappear. This entropic homogenization of the sample is what drives different UMI diffusion clouds to interact and UEIs to form. It is therefore this increase in the system’s entropy that most directly drives the DNA microscopy reaction to record meaningful information about a specimen.
One key point of weakness for DNA microscopy remains the resolution of empty space, and future work will be needed to eliminate this obstacle to produce high quality reconstructions of samples over large lengths where there are gaps. It is possible that a “landmark” based approach, in which specific DNA sequences are deposited at known physical locations to assist in the image reconstruction process, will ultimately prove the most cost-effective way to achieve this. Better analytical techniques to correct for large length scale distortions may prove equally effective, without complicating the experiment itself. Nevertheless, the fact that DNA microscopy is performed entirely by pipette means that large numbers of samples can easily be processed simultaneously. The technology is therefore structurally conducive to massive throughput.
DNA microscopy offers a new form of optics-free imaging that leverages the large economies of scale in DNA sequencing. The technology does not require sacrificing spatial resolution for sequence accuracy, since it benefits, rather than suffers, from high signal density and it does not hinge on optical resolution of diffraction-limited “spots” in situ. By using chemistry itself as its means of image acquisition, DNA microscopy decouples spatial resolution from specimen penetration depth (otherwise linked by the properties of electromagnetic radiation) and thereby side-steps a tradeoff imposed by the physics of wave propagation.
Finally, because it does not rely on specialized equipment and can be performed in a multi-well format with normal lab pipettes, DNA microscopy is highly scalable. It is fully multiplex-compatible (imaging any PCR template) and uses sequencing-depth as a dial to enhance spatial and genetic detail. Moreover, because DNA microscopy reads out single-nucleotide variation in biological DNA or RNA sequences it targets, it spatially resolves the astronomically large potential variation that exists in somatic mutations, stochastic RNA splicing, RNA editing, and similar forms of genetic diversity in cell populations. We have demonstrated that it achieves this at high accuracy over long read lengths.
Our development of a chemically-encoded microscopy system leaves open both fundamental theoretical and experimental questions. On the one hand, future experimental and computational enhancements will help better resolve large length scales that include spatial gaps. On the other hand, the UEI, by effectively functioning in these experiments as a DNA-analogue of the photon, has illuminated a wider potential role for DNA as a medium for artificial biological recordings. Most directly, DNA microscopy can be applied in principle beyond the transcriptome, for example, directly to DNA sequences or to proteins detected with DNA-labeled antibodies. Looking to the future, a full exploration of individual and idiosyncratic spatial structures in the biological world by encoding them into DNA bases, instead of photonic pixels, may reveal new layers of information otherwise hidden by the limits of optical- and electron-based imaging.
Funding
This work was supported by a Simons Foundation LSRF Fellowship (J.A.W.), the Klarman Cell Observatory, and NIH R01HG009276. F.Z. is a New York Stem Cell Foundation–Robertson Investigator. F.Z. is supported by NIH grants (1R01-HG009761, 1R01-MH110049, and 1DP1-HL141201); the New York Stem Cell, Simons, Paul G. Allen Family, and Vallee Foundations; the Poitras Center for Affective Disorders Research at MIT; the Hock E. Tan and K. Lisa Yang Center for Autism Research at MIT; and J. and P. Poitras, and R. Metcalfe. AR and FZ are Howard Hughes Medical Institute Investigators.
Author contributions
J.W. conceived the project. J.W. performed all experiments and analysis. J.W., A.R., and F.Z. wrote the manuscript.
Competing interests
The authors have applied for a patent on the technology, assigned to The Broad Institute and MIT (U.S. Provisional Application 62217639). Data and software availability: Code developed for this work is available for download at github.com/jaweinst/dnamic. Raw data is available for download from the short-reads archive under SRA project number PRJNA487001.
Acknowledgments
We thank Paul Blainey and his lab for their generosity and provision of their clean room for PDMS work, as well as for particularly helpful discussions with David Feldman and Lily Xu.
References


