

Abstract
The RNA-guided CRISPR endonucleases Cas12a and Cas13a allow detection of specific DNA or RNA sequences in molecular diagnostics applications. Here, we present a novel approach that facilitates sequence detection even with the unaided eye, through solution turbidity arising from liquid-liquid phase separation of nucleic acids and positively charged polyelectrolytes. The simplicity of combining CRISPR-nuclease activity with macroscopic phase separation allows for easy and low-cost detection of specific nucleic acids in a wide range of applications.
CRISPR-Cas technology has revolutionized molecular biology by making genome editing1 and nucleic acid sequence detection2–6 efficient and accessible. CRISPR-based detection methods rely on CRISPR RNA-guided nucleases such as Cas12a7 (type V) and Cas13a8 (type VI). These proteins display non-specific cleavage activity of ssDNA (Cas12a)5 or RNA (Cas13a)2,9,10 upon recognition of their target sequences. The mechanisms employed by these enzymes rely on the formation of a complex with CRISPR guide RNA (crRNA), which then targets DNA or RNA sequences complementary to the crRNA. Importantly, the enzymes display non-specific (collateral) cleavage activity as long as a target is bound to the crRNA-protein complex (Fig. 1a,b). This activity is the mechanism that facilitates nucleotide detection assays2–5. Previously, Cas12a and Cas13a have been employed to discriminate between two variants of the human papillomavirus5 and between Dengue and ZIKA viruses3, respectively. In these studies, the detection of Cas12a and Cas13a activity relied on quenched fluorophores linked by DNA or RNA molecules. The proteins’ endonuclease activity causes a fluorescent signal by cleaving the DNA or RNA linkage between a fluorophore-quencher pair.
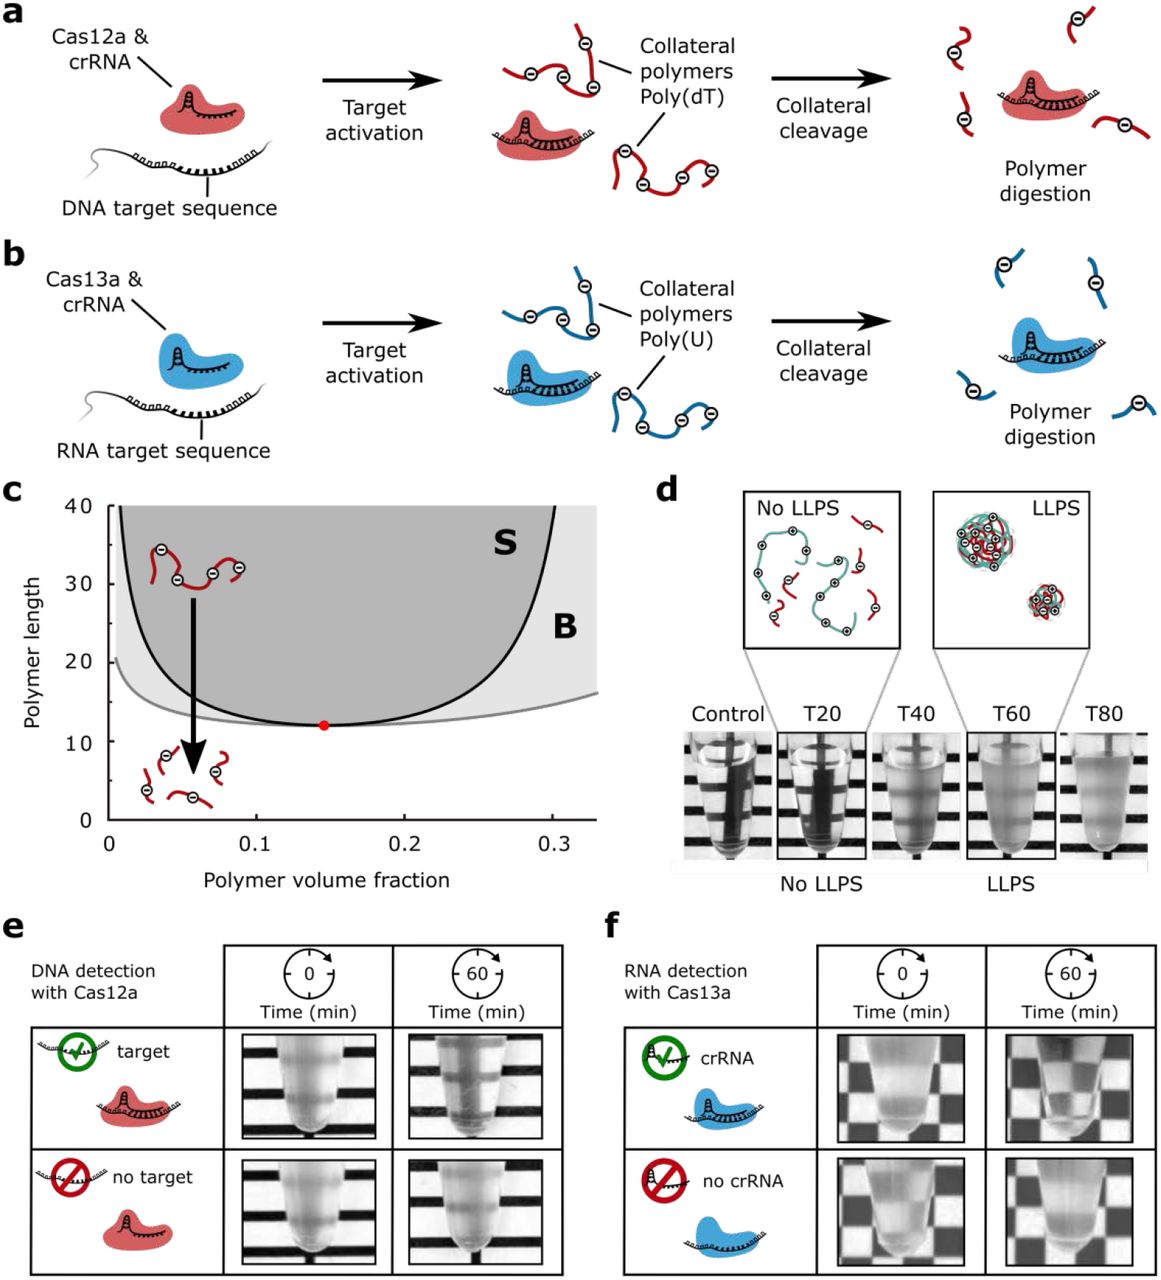
(a) RNA guided Cas12a targets DNA and when activated by a crRNA complementary sequence cleaves poly(dT) as collateral polymer. LLPS of poly(dT) can be induced with poly-L-lysine.
(b) RNA guided Cas13a targets RNA and upon activation by a crRNA complementary sequence, degrades poly(U)9. LLPS of poly(U) can be induced with spermine.
(c) Phase diagram for symmetric polymer solutions based on Flory-Huggins19,20 theory and the Voorn-Overbeek15 model (see Methods). Phase separation requires polymers longer than a minimum length for a given polymer volume fraction. The mixing state of the polymer solution is metastable in region B (light grey, above binodal curve), whereas the solution spontaneously phase separates in region S (dark grey, above spinodal curve). The red dot indicates the critical point. If polymers are shorter than the critical length, phase separation does not occur, independent of polymer volume fraction. Cleavage of polymers into pieces can prevent phase separation (black arrow).
(d) LLPS of poly(dT) and pLL depends on poly(dT) length. The pictures show mixtures with different poly(dT) length ranging from T20 to T80. Long poly(dT) (>40 nt) robustly phase separates with 5 mg/mL pLL, whereas short poly(dT) (<40 nt) does not (at equal volume fraction).
(e) Cas12a activity can be detected by eye from the absence of turbidity/phase separation. The pictures show the degrees of turbidity in samples with and without target before and after 60 minutes of incubation time.
(f) LLPS-induced detection of an RNA sequence: Cas13a was incubated with target, poly(U), and with or without crRNA. The addition of spermine after 60 minutes shows the absence of turbidity indicating Cas13a activity.
To overcome the requirement of fluorescence-based detection, we have developed a novel detection method based on liquid-liquid phase separation (LLPS)11–13. We exploit the fact that solutions of long nucleic acid polymers and positively charged polyelectrolytes can undergo phase separation into a polymer-rich and a polymer-depleted phase. This process is also known as complex coacervation14,15. LLPS increases solution turbidity, such that it is visible to the naked eye16. By using this effect in combination with the activity of CRISPR-Cas nucleases, we can robustly couple the detection of DNA and RNA sequences to solution turbidity. However, it is first necessary to understand the conditions under which solutions phase separate.
An important feature of LLPS in polymer solutions is that phase separation depends on the polymer length17,18. To investigate the effect of polymer length on the phase separation behaviour, we developed a thermodynamic model for solutions of oppositely charged polymer (see Methods)15,19,20. The model predicts that in general, one can find conditions where a solution with long polymers phase-separates, whereas a solution with short polymers does not phase-separate, but will stay uniformly mixed. This prediction is illustrated by the phase diagram of polymer solutions as a function of polymer volume fraction and polymer length (Fig. 1c). To experimentally validate the model prediction that phase separation only occurs beyond a critical polymer length, we studied mixtures of various polymer lengths using single stranded poly(dT) DNA and a positively charged peptide, poly-L-lysine (pLL, 15-30 kDa, Sigma). We found that phase separation robustly occurred for poly(dT) longer than 40 nucleotides and that phase separation was absent for shorter poly(dT). Notably, the change in turbidity of the mixtures can easily be distinguished by eye (Fig. 1d).
Having established that phase separation of poly(dT) oligonucleotides depends on polymer length, we tested the feasibility of a phase separation-based method for CRISPR-based nucleic acid detection. We mixed crRNA-guided Cas12a, with and without complementary target, and a 60-mer of poly(dT) (T60). When pLL was immediately added both solutions turned turbid, indicating the presence of sufficient long poly(dT) for visible phase separation (Fig. 1e, left column). When pLL was added after an incubation time of 60 minutes, the solution containing no target became turbid, while the solution containing the target remained transparent (Fig. 1e, right column).
To also establish a LLPS-based method for RNA detection, we identified poly(U)-RNA as a suitable RNA polymer that phase separates in the presence of the tetravalent polycation spermine16. We incubated Cas13a, the RNA target, and poly(U), with and without crRNA. After 60 minutes, spermine was added to the solutions resulting in a phase separated turbid sample in the absence of crRNA, and a clear solution in the presence of crRNA (Fig. 1f), indicating the successful activation of protein and prevention of LLPS. The result shows that LLPS-based RNA detection is compatible with Cas13a collateral nuclease activity.
For both DNA and RNA detection, Fig. 2 provides a schematic overview of the necessary steps. First, crRNA-guided Cas12a or Cas13a is incubated with the target sample and collateral nucleic acid polymers poly(dT) or poly(U) respectively. If the sample contains a target that matches the crRNA, the protein-crRNA complexes are activated and degrade the collateral polymers. In the absence of target-recognition, the proteins remain inactive and the polymers remain unaffected. After incubation, the solution is complemented with polycations and either remains clear (indicating target recognition), or becomes turbid (indicating no target recognition).

To detect specific DNA or RNA sequences in a given sample, it is mixed with crRNA-guided Cas12a or Cas13a, respectively and collateral polymers. After incubation a polycation is added to the mixture. If the target detection occurs (top), the mixture remains clear because collateral polymers had been degraded and LLPS is prevented. If no target detection occurs (bottom), the mixture becomes turbid due to LLPS of poly cation and collateral polymers. In our conditions the target detection limit (Fig. S3, Supporting Material) is comparable to reported values in the absence of amplification steps4.
Taken together, we have shown proof-of-concept that combining the activity of programmable CRISPR-Cas nucleases Cas12a and Cas13a with LLPS allows to robustly couple the detection of DNA and RNA sequences to solution turbidity. In addition, we demonstrated how polymer length affects LLPS, and thereby contribute to a better understanding of the mechanisms that lead to phase separation in the cell biological context of membrane-less organelles13. We anticipate the presented LLPS-based nucleotide-detection assays will be useful in various high-throughput or low-cost point-of-care diagnostic applications, especially where the availability and operability of high-end laboratory equipment is limited.
Author contributions
L.R., W.K.S., and S.J.J.B. conceived the study; W.K.S., J.M.J., L.R., F.L.N, and A.C.H carried out the experiments; W.K.S., and T.I, developed the theoretical model with input from L.R.; W.K.S., F.L.N., M.D., T.I., S.J.J.B., and L.R. analysed and discussed the data; W.K.S, and L.R. wrote the paper with input from all authors.
Methods
Theoretical model
Liquid-liquid phase separation occurs when the energetic penalty for mixing the two liquids is larger than the entropic gain of that mixing. For polymer solutions, whether or not they will spontaneously demix depends both on the polymer concentration and polymer length17,18,21. In this section, we present a mathematical model for the free energy of the solution, from which we can calculate the phase diagram of the solution, and find under which conditions it will undergo phase separation.
Following the seminal work by Flory and Huggins19,20 a polymer solution can be described using a lattice model, where each lattice site is occupied by any of the components from the solution11,12. The size of a lattice site is chosen to be equal to the molecular volume of the solvent v. We denote the molecular volume of each component i by Vi, and its valency by Zi. By using a mean-field approximation, one obtains an expression for the free energy in which only the volume fractions of polymers in solution are important. Based on the Flory-Huggins model19,20 and its extension to charged polymers by Voorn and Overbeek15, the free energy per unit volume f (in units of kBT) of a polymer solution with n components (including the solvent) can be written as17

For component i, ϕi denotes the volume fraction, Ni = Vi/v denotes the effective chain length, χij is the Flory-Huggins interaction parameter between components i and j, α is the electrostatic interaction parameter (α ≈ 3.655 for aqueous solutions at room temperature22) and σi = Zi/Ni is the charge density. The first term represents the entropy of mixing of the solution, and contains an explicit dependence on the effective chain length of each component. Due to its inversely proportional relation with polymer length, this term rapidly loses significance for long polymers. The second term represents the Flory-Huggins non-ionic interactions, and the third term represents the electrostatic interactions as in the Voorn-Overbeek model. For the qualitative demonstration of how polymer length influences phase separation behaviour, we make the simplifying assumption that the solution is symmetric and contains no added salts. The three components of the system are then the solvent molecules (index s) and two oppositely charged polymer species (indexes 1 and 2) of equal polymer length N1 = N2 = N; by definition Ns = 1. We further simplify our expressions by assuming that the two polymer species have equal charge density σ1 = σ2 = σ, equal polymer volume fraction  , and that the only relevant Flory-Huggins interaction is that between the polymers and the solvent, so that χ1s = χ2s = χ and χ12 = 0. In this case, the free energy can be written as

This form of the free energy determines the thermodynamic properties of the polymer solution, where the first two terms represent the entropy of mixing, and the last two terms represent energetic contributions due to polymer-solvent and electrostatic interactions between the polymer species. The system will exhibit a uniform mixed phase if f(ϕ) is a convex function, and phase separate for any concave regions of f(ϕ). For fixed values of χ and α, f(ϕ) is convex below a critical value of N, but becomes concave for longer polymers. In Fig. S4 (Supporting Material), the free energy and the chemical potential (∂f/∂ϕ) are shown for effective chain lengths larger than, equal to, and lower than the critical length. We also calculated the phase diagram shown in Fig. 1c of the main text from the free energy given in equation (2) above. The critical point (ϕc, Nc), as indicated by the red dot in Fig. 1c, can be computed from the condition that both the second and the third derivative of the free energy vanish

The critical point indicates the smallest polymer length Nc for which the solution can exhibit phase separation. The spinodal curve (black line in Fig. 1c) is given by the condition that the second derivative of the free energy vanishes

Inside the spinodal curve the solution is unstable and thus always phase separates, yielding stable coexistence of a polymer rich liquid phase and a polymer poor liquid phase. The volume fractions of the coexisting phases are indicated by the binodal curve (grey line in Fig. 1c), which is given by the condition that the chemical potential and osmotic pressure of each component are equal in both phases. To find the binodal, we (numerically) solve the simultaneous equations
 and
and
 for N ≥ Nc. Between the binodal and spinodal curves, the coexistence of two liquid phases is metastable and the solution needs to overcome an energy barrier to demix. For the diagram in Fig. 1c, we set the parameters to χ = 0.5, σ = 0.22, α = 3.655. In the absence of the electrostatic term, Flory-Huggins theory predicts LLPS to occur above a critical interaction strength12 χc = 2 for N = 1. However, for N >1, χc decreases with increasing N, and the polymer solution stays homogenous for polymer lengths of up to N ≈ 104 for χ = 0.5. The Voorn-Overbeek term in the free energy thus contributes the necessary interaction strength for phase separation to occur in the parameter regime we have chosen.
Summarizing, the presented model explains why shortening of nucleic acid polymers by the activity of Cas-proteins prevents LLPS. Initially, nucleic acid polymer length exceeds the critical length for phase separation. When degradation through Cas-proteins has occurred and nucleic acid polymer length has fallen below the binodal curve, the system can no longer phase separate. The absence of detectable phase separation indicates the protein activity.
Poly(dT) cleavage gel
To assess the collateral activity of Cas12a on T60 ssDNA with gelelectrophoresis (Fig. S1a), Cas12 was loaded with crRNA by mixing ~8.6 μM Cas12a, 10 μM crRNA (Table S1) in 1x C12RB buffer and incubating for 15 minutes at 37 °C. Additionally, five tubes were prepared, each containing 1 μM T60 and 200 nM target DNA in 1x C12RB. Loaded Cas12a was added to each of the tubes and left for time intervals 1, 15, 30, 45 and 60 minutes. The reactions were stopped by flash-freezing the reaction tubes in liquid nitrogen, and addition of RNA gel loading dye followed by heating to 70 °C for 10 minutes and quickly cooling on ice for 5 minutes prior to running the samples on a non-denaturing poly acrylamide gel.
Fluorescence assays
We used fluorescence assays to test for collateral cleavage activity of Cas12a (Fig. S1b) with target (blue line), and without target sequence (orange line). Fluorescence measurements were done (λex = 534 nm, λem = 585 nm) in a Tecan Infinite M200 PRO plate-reader. Cas12a was loaded with crRNA for a minimum of 15 minutes in 1x C12RB before the measurements, both reactions were done at 37 °C and as triplicate.
The fluorescence assay for Cas13a (Fig. S2) consisted of 50 nM Cas13a mixed with reaction buffer (1x C13RB), 0.3 ng/μL target RNA, 0.3 ng/μL crRNA, and 125 nM RNase Alert. Fluorescence (λex = 490 nm, λem = 520 nm) was recorded every three minutes using a Synergy H1 (BioTek) fluorimeter. All measurements were done at 37 °C and as triplicate.
Turbidity assays
Cas12a was loaded and activated as for the poly(dT) cleavage assay (see above). For the turbidity assay displayed in Fig. 1e, the four tubes displayed contained 187 nM of the activated Cas12a, 22 μM T60 in 1.1x C12RB buffer. The tubes shown in the upper row of Fig. 1e furthermore contained 220 nM DNA target. pLL was directly added to the tubes in the left column, to a final concentration of 0.5 mg/mL. The tubes in the right column were first incubated for one hour at 37 °C before pLL was added.
The turbidity assay for Cas13a (Fig. 1f) consisted of ~50 nM Cas13a, ~0.3 ng/μL Cas13a target and 0.1 wt% poly(U) mixed in 1.1x C13RB. The tubes in the upper row, also contained ~0.3 ng/μL crRNA for Cas13a (Table S1). The tubes in the left column contained spermine from the start of the experiment at a final concentration of 1.0 wt%, whereas the tubes shown in the right column were first incubated at 37 °C for one hour before spermine was added.
Buffer conditions and chemicals
Cas13a reactions as well as RNA/spermine experiments were carried out in C13RB buffer (40 mM Tris-HCl, 60 mM NaCl, 6 mM MgCl2, pH 7.3). Cas12a reactions and poly(dT)/pLL experiments were carried out in C12RB buffer (20 mM Tris-HCl, 66.6 mM KCl, 5 mM MgCl2, 1 mM DTT, 5% (v/v) glycerol, 50 μg/mL heparin, pH 7.5).
Poly(U) (polyuridylic acid potassium salt), spermine (spermine tetrahydrochloride), pLL (poly-L-lysine hydrobromide, 15-30 kDa), Trizma hydrochloride, sodium chloride and magnesium dichloride were bought from Sigma-Aldrich. Poly(dT) oligonucleotides T20, T40, T60, T80 were bought from Ella Biotech. RNase Alert, RNA Gel loading dye and Nuclease free water were bought from Thermo Fisher. DNase Alert was bought from Integrated DNA Technologies. RPA kit was bought from TwistDx.
Protein expression and purification
Cas12a purification
The plasmid pET21a encoding Cas12a7 (AsCpf1) was transformed into Rosetta E. coli cells, which were grown on agar plate with 100 μg/mL ampicillin and 25 μg/mL chloramphenicol. Cells were grown in LB with addition of 100 μg/mL ampicillin and 25 μg/mL chloramphenicol, to an OD600 of 0.6 (37°C, 180 rpm). Cultures were put on ice for 30 minutes, and Cas12a production was induced by the addition of 1 mM IPTG. Cultures were left for 16 hours at 18 °C with rotation (180 rpm). Subsequent steps were done at 4 °C. Cultures were spun down at 7000 g for 10 minutes, and the supernatant was discarded. Pellets were resuspended in lysis buffer (50 mM NaH2PO4, 500 mM NaCl, 1 mM DTT, 10 mM imidazole, pH 8.0) with addition of 1 protease inhibitor tablet per 50 mL of lysis buffer. Cells were disrupted in a French Pressure Cell at 1000 bar twice and spun down at 16,000 g for 30 min. Supernatant was filtered with a 0.45 μm pore size, applied to His-Select Affinity resin and incubated for 30 minutes. Resin was spun down at 2000 g for 1 minute, and the supernatant was discarded. The resin was loaded onto a gravity column and washed twice with wash buffer (50 mM NaH2PO4, 500 mM NaCl, 1 mM DTT, 30 mM imidazole, pH 8.0). Cas12a was eluted with elution buffer (50 mM NaH2PO4, 500 mM NaCl, 1 mM DTT, 250 mM imidazole, pH 8.0). The recovered protein was spun down at 14,000 g for 10 min and the supernatant was loaded onto a HiLoad 16/600 Superdex 200 PG column. Fractions of 1 mL were recovered and the protein content measured at OD280. Protein containing samples were pooled and the elution buffer exchanged with exchange buffer (20 mM Hepes, 150 mM KCl, 10 mM MgCl2, 1% glycerol, 0.5 mM DTT, pH 7.5) using a Millipore Amicon 10,000 NMWL centrifugal filter unit. Sample was spun down at 14,000 g for 10 min, and the supernatant snap frozen in fractions for further use. The final protein concentration was determined using a Bradford assay.
Cas13a purification
The plasmid3 pC013 encoding Cas13a was transformed into BL21(DE3) E. coli cells, which were grown on agar plate with 100 μg/mL ampicillin. Cells were grown in Terrific Broth (TB) medium, containing 12 g/L tryptone, 24 g/L yeast extract, 9.4 g/L K2HPO4 and 2.2 g/L KH2PO4, with addition of 100 μg/mL ampicillin, to an OD600 of 0.6 (37 °C, 180 rpm). Cultures were put on ice for 30 minutes, and subsequently Cas13a production was induced by the addition of 0.5 mM IPTG. Cultures were left for 16 hours at 18 °C with rotation (180 rpm). Subsequent steps were done at 4 °C. Cultures were spun down at 5200 g for 15 minutes, and the supernatant was discarded. Pellets were resuspended in 1xPBS buffer, and centrifuged (3220 g, 10 minutes). Pellets were resuspended in lysis buffer (20 mM Tris-HCl, 0.5 M NaCl, 1 mM DTT, 25 mM imidazole, pH 8.0) with addition of 100 u/mL benzonase, 0.25 mg/mL lysozyme and 1 protease inhibitor tablet per mL. Cells were French pressed (3 rounds at 100 kbar) and cell lysate was pelleted for 45 minutes at 16,000 g. Supernatant was filtered with a 0.45 μm pore size, applied to His-Select Nickel Affinity gel and incubated for one hour with rotation. Resin was spun down (1 minute, 2000 g), and the supernatant was discarded. The resin was loaded onto a gravity column, and washed with lysis buffer. Cas13a was eluted with elution buffer (20 mM Tris-HCl, 0.5 M NaCl, 1 mM DTT and 250 mM imidazole, pH 8.0), and dialyzed overnight against storage buffer (50 mM Tris-HCl, 0.6 mM NaCl, 5% v/v glycerol, 2 mM DTT, pH 7.5). Final protein concentration was determined using a Bradford assay.
Nucleic acid preparations
Targets for Cas12a and Cas13a
ssDNA target for Cas12a assays was ordered from Ella Biotech (5’-Cga gta aca gac atg gac cat cag ATC TAC AAC AGT AGA AAT TCT ATA GTG AGT CGT ATT ACT T-3’).
Target RNA for Cas13a assays was produced by Recombinant Polymerase Amplification (RPA, TwistDx) and simultaneous in vitro transcription of part of the tetracycline resistance gene from the plasmid pSB1T3. The target amplification was done by mixing 1 ng of plasmid with 1 μM forward primer (5’-AAT TCT AAT ACG ACT CAC TAT AGG gat gcc ctt gag agc ctt caa c-3’) containing a T7 promoter overhang, 1 μM reverse primer (5’-cct cgc cga aaa tga ccc a-3’), 4 μL Murine RNase inhibitor (NEB), 1 μL T7 polymerase (NEB), 5 mM MgCl2, 1 mM ATP, 1 mM CTP, 1 mM GTP and 1 mM UTP and RPA rehydration buffer. This was transferred into an RPA mix and 14 mM MgAc was added to start the reaction, which was left for three hours at 37 °C. Target RNA was purified using RNeasy MinElute (Qiagen), quantified using NanoDrop, and stored at −80 °C.
crRNA preparation
crRNA for Cas12a was bought from IDT. crRNA for Cas13a, guided towards RNA target, was prepared by annealing of template DNA oligonucleotides and in vitro transcription. Primers 5’-AAT TCT AAT ACG ACT CAC TAT AGG GGA TTT AGA CTA CCC CAA AAA CGA AGG GGA CTA AAA C-3’ and 5’-gcc gca ctt atg act gtc ttc ttt atc aGT TTT AGT CCC CTT CGT TTT TGG GGT AGT CTA AAT CCC CTA TAG TGA GTC GTA TTA GAA TT-3’ were mixed in 1 μM concentration and annealed by heating to 95 °C for 2 minutes and gradually cooling to 50 °C in steps of 5 °C every ten seconds, and then cooling to 30 °C in ten seconds. The resulting annealed DNA was in vitro transcribed in a mix containing 1 mM ATP, 1 mM CTP, 1 mM GTP, 1 mM UTP, 1 μL T7 polymerase, 2 μL murine RNase inhibitor and RNA polymerase buffer, to a final volume of 100 μL. Reaction was left at 37 °C for 3 hours, and cleaned using RNeasy MinElute. The concentration was determined using NanoDrop.
Acknowledgements
We thank members of the iGEM team 2017 from Delft University of Technology for their contributions: Aafke van Aalst, Kimberley Barentsen, Kelly Hamers, Floor de Jong, Fiona Murphy, Guillermo Serena Ruiz, Gabriella Tany, Isabell Trinh, Jasper Veerman, Amária Vledder and Hielke Walinga, and team supervisors Aljoscha Wahl, Cristóbal Almendros Romero, Anthony Birnie, Hirad Daneshpour, David Foschepoth, Patrick de Jonge, Sebastian Kieper, Benjamin Lehner, Rebecca McKenzie, Jochem Vink and Esengül Yildirim. The plasmids encoding Cas12a and Cas13a were a kind gift from the Feng Zhang lab (Broad Institute). This work was supported by The Netherlands Organization for Scientific Research (NWO/OCW), as part of the Frontiers of Nanoscience program, and the Fonds Ernest Solvay managed by the Koning Boudewijnstichting, Franklin L. Nobrega was supported by a NWO Veni grant 016.Veni.181.092, Stan J.J. Brouns was supported by the European Research Council (ERC Starting Grant 639707) and a TU Delft start-up grant, and L. Reese was supported by FOM programme nr. 110 (NWO). The Delft University of Technology has filed a patent application pertaining to this manuscript, on which L.R., W.K.S, and S.J.J.B. are co-inventors.


