

Abstract
Symbiosis is a key driver of evolutionary novelty and ecological diversity, but our understanding of how macroevolutionary processes originate extant symbiotic associations is still very incomplete. In this context, cophylogenetic tools are used to assess the congruence between the phylogenies of two groups of organisms related by extant associations. If phylogenetic congruence is higher than expected by chance, we conclude that there is cophylogenetic signal in the system under study. However, none of the current cophylogenetic methods quantifies the degree of cophylogenetic signal satisfactorily. We present a novel approach, Random Tanglegram Partitions (Random TaPas) that applies a given global-fit method to random partial tanglegrams of a fixed size to identify the associations, terminals and nodes that maximize phylogenetic congruence. By means of simulations, we show that the output value produced is inversely proportional to the number of cospeciation events employed to build simulated tanglegrams. In addition, with time-calibrated trees, Random TaPas is also efficient at distinguishing cospeciation from pseudocospeciation. Random TaPas can handle large tanglegrams in affordable computational time and incorporates phylogenetic uncertainty in the analyses. We demonstrate its application with two real examples. In both systems, Random TaPas revealed low cophylogenetic signal, but mapping its variation onto the tanglegram pointed two different coevolutionary processes accounting for this result. Finally, we suggest that the recursive partitioning of the tanglegram buffers the effect of phylogenetic nonindependence occurring in current global-fit methods and therefore Random TaPas is more reliable to identify host-symbiont associations that contribute most to cophylogenetic signal than regular global-fit methods. Random TaPas can be implemented in the public-domain statistical software R with scripts provided herein.
INTRODUCTION
Symbiosis is widespread throughout the tree of life and is considered as a key driver of evolutionary novelty and ecological diversity (Moran 2006; Zook 2015). Because organisms do not evolve in isolation, the evolutionary fate of symbiotic partners is intertwined at ecological and evolutionary levels, but despite the centrality of symbiosis in evolutionary biology, our understanding of how macroevolutionary processes originate extant symbiotic associations is still very incomplete (Weber et al. 2017). However, the recent emergence of robust comparative phylogenetic methods has expanded and facilitated research in this area (Hutchinson et al. 2017a). Cophylogeny, in particular, provides a quantitative framework to evaluate the dependency of two evolutionary histories (Hutchinson et al. 2017b). This approach involves some assessment of the congruence between the phylogenies of two groups of species or taxa related by extant associations, where congruence quantifies the degree of both topological and branch-length similarity (Page 2003). If such congruence is higher than expected by chance, it is concluded that there is cophylogenetic signal in the system studied (Mendlová et al. 2012).
Although cophylogenetic signal was initially interpreted as evidence of high level of cospeciation, it has been shown that other mechanisms can account for some degree of topological congruence. Particularly, complete host-switching events (i.e., colonization of a new host species followed by speciation) among closely related hosts can result in symbiont diversification mimicking the tree topology of the host, a process that has been termed pseudocospeciation (de Vienne et al. 2013). In any case, even if its causality cannot not be determined, detecting cophylogenetic signal is highly relevant because it implies that contemporary ecological associations among species have been the product of a coupled evolutionary history such that ancestral forms of each species experienced and responded to shared selection pressures (Hutchinson et al. 2017b).
The wide range of cophylogenetic methods currently available can be roughly categorized as either event-based or global-fit (Hutchinson et al. 2017a), but none of them deal with cophylogenetic signal satisfactorily. Event-based methods attempt to reconstruct the coevolutionary history of the organisms involved by assigning costs to each type of event and heuristically search for the solution(s) that minimize(s) the overall sum of costs (Charleston and Libeskind-Hadas 2014). The problem is that cophylogenetic signal can be easily overestimated because the default cost of cospeciation is assumed to be zero, which is often at odds with empirical evidence (de Vienne et al. 2013). In addition, with large datasets, the approach becomes computationally prohibitive and the influence of phylogenetic uncertainty is not explicitly considered (i.e., the single input phylogenetic trees of host and symbionts are assumed to represent the actual evolutionary relationships), which may lead to erroneous conclusions if not all clades are well supported. Global-fit methods, for their part, assess the degree of congruence between two phylogenies and can also identify the specific interactions that contribute most to overall congruence (Balbuena et al. 2013). They can handle large datasets economically in terms of computational time, and the effect of phylogenetic uncertainty can be assessed (Pérez-Escobar et al. 2016). However, current methods such as PACo (Balbuena et al. 2013) or ParaFit (Legendre et al. 2002), provide statistical evidence of cophylogenetic signal, but produce no directly interpretable statistic as for its strength and no explicit links with coevolutionary events are made.
Therefore, additional work remains to be done in this domain. Particularly, the recent, spectacular expansion of DNA sequencing and phylogenetic reconstruction is leading to increasingly common scenarios involving species-rich trees and complex host-symbiont interactions (e.g., Hutchinson et al. 2017b). Equating these elaborate systems to evolutionary Gordian knots, we present herein an Alexandrian approach to cophylogenetic signal assessment. Random Tanglegram Partitions (Random TaPas) applies a given global-fit method to random partial tanglegrams of a fixed size to identify the associations, terminals and nodes that maximize phylogenetic congruence. By means of simulations, we show that the output value produced by Random TaPas is inversely proportional to the number of cospeciation events employed to build the tanglegrams. In addition, with time-calibrated trees, Random TaPas is also efficient at distinguishing cospeciation from pseudocospeciation. The method is also useful to identify what host-symbiont associations contribute most to phylogenetic congruence because the variation in cophylogenetic signal can be mapped onto the tanglegram. We illustrate its application with two real datasets and show how it can incorporate phylogenetic uncertainty in the analyses. R scripts (R Core Team 2018) to perform Random TaPas and a user’s guide are also provided.
MATERIALS AND METHODS
The Random-TaPas algorithm
The starting point is a triple (H, S, A), where H and S represent the phylogenies of hosts and symbionts, and A is a binary matrix with rows and columns corresponding to terminals in H and S, respectively, in which extant associations between each terminal are coded as 1 and no associations as 0. The triple is often represented graphically as a tanglegram (Fig. 1), in which H and S usually are displayed face to face and their terminals are connected by lines reflecting the associations encapsulated in A. Figure 1 provides a complete overview of the Random TaPas algorithm. In short, for a large number of times (N), it selects n random unique one-to-one associations, so that each taxon in H is associated to one, and only one, taxon in S, and vice versa. (Since the aim is to find associations that maximize congruence, this is a condition to be met by any perfect host-symbiont cospeciation scenario). Then a global-fit method is applied to the partial tanglegram defined by the n associations and the statistic produced is saved. Finally, a percentile p of the distribution of the N statistics generated is set and the frequency of occurrence of each host-symbiont association of A included in p is computed.

The Random TaPas algorithm. Given a triple (H, S, A), where H and S represent the phylogenies of hosts and symbionts, and A is a binary matrix that codes the associations between terminals in H and S: 1. Set a number n less than the total number of host-symbiont associations. 2. For i from 1 to N times (where N is sufficiently large, typically ≥ 104) do 2.1. Randomly choose n unique associations in A, so that each terminal in H is associated to one, and only one, terminal in S, and vice versa. (This is a prerequisite for a perfect host-symbiont cospeciation scenario); 2.2. Produce a partial tanglegram that includes only the n associations chosen at step 2.1 by trimming A and pruning H and S; 2.3. Run a global-fit test with the partial triple and 2.4. Save the resulting statistic zi and the set of n host-symbiont associations selected at 2.1. 3. Render the frequency distribution of the zi’s and set a small percentile p where the highest cophylogenetic congruence is expected. 4. Determine how many times each host-symbiont associations occurs in p, and return their frequency distribution.
The output of Random TaPas is a frequency distribution of host-symbiont associations in which each value is expected to be directly proportional to the contribution of the host-parasite association to the global pattern of phylogenetic congruence (Figure 1). The shape of this distribution can be characterized by computing the variance to mean ratio (VMR) of the frequencies, whose value is biologically informative. In a perfect cospeciation scenario, VMR = 0 is expected because each host-symbiont association would contribute equally to the global fit, yielding a uniform frequency distribution. Thus, cophylogenetic signal would be significant and maximal. If the association between H and S were completely random, the frequency distribution would follow a Poisson distribution with VMR = 1 and cophylogenetic signal would be not significant. Finally, unequal contributions of the host-symbiont associations would lead to skewed frequency distributions with VMR >> 1 and, if significant, VMR would be inversely proportional to cophylogenetic signal.
Global-fit methods
Random TaPas can be applied in conjunction with any global-fit method. For the sake of demonstration, we chose here two very different approaches: Procrustes Approach to Cophylogeny (PACo) (Balbuena et al. 2013) and geodesic distances (GD) in tree space (Schardl et al. 2008). PACo uses Procrustean superimposition of Euclidean embeddings of the phylogenetic trees to assess phylogenetic congruence (Balbuena et al. 2013). The second approach entails computing pairwise GDs between the partial phylogenies defined by n. Most global-fit methods translate matrices of evolutionary distances into Euclidean space whose dimensionality is higher than that of tree space (Holmes 2005). So the advantage of this approach is that it skips the potential effect of this dimensional mismatch. In both methods, the value of the statistic produced is inversely proportional to statistical congruence.
PACo was performed with package paco (Hutchinson et al. 2017b) employing patristic distances as input. Its use with Random TaPas is aimed at finding the set of partial tanglegrams that minimize the square sum of residuals (m2XY) of the Procrustes superposition of host and symbiont spatial configurations in p. The use of GDs with Random TaPas attempts to find the set of partial tanglegrams in p with minimal pairwise distances in tree space. These distances were computed with function dist.multiPhylo of package distory in R (Chakerian and Holmes 2010).
Synthetic data
The operation of Random TaPas depends on three parameters: N, n and p (Fig. 1). We assessed performance with different parameter combinations and the two aforementioned global fit methods with 200 synthetic tanglegrams generated with CoRe-Gen (Keller-Schmidt et al. 2011). For a given set of input parameters, the program provides a pair of resulting ultrametric trees, a list of associations between the terminals and the number of coevolutionary events (cospeciation, duplication, sorting, and complete host-switching) involved in the construction of the tanglegram. Since it is not possible to accurately control a priori the output based on the input parameters, we first generated a library of 1,000 tanglegrams. The trees were built following a pure-speciation (Yule) model, which has been shown to describe adequately empirical phylogenetic trees (Hagen et al., 2015). For each host-symbiont pair, we specified a different random combination of input parameters sampled from a uniform distribution. The parameters and sampling ranges were: number of generations (100-200), probability of cospeciation event (0.2-1.0), probability of host-switching event (0.2-0.8) and probability of choosing a host for speciation instead of a parasite (0.7-1.0). Because our method is intended for a wider range of settings than those considered by Keller-Schmidt et al. (2011), the parameter ranges are broader than those used originally. Thus, our resulting tanglegrams included scenarios where cospeciation events ranged from very rare to very common. Since some combinations of parameters yielded trees with few terminals (≤ 15) or numbers of host parasite associations (≤ 20), we ran CoRe-Gen 1,274 times to obtain a set of 1,000 workable tanglegrams.
Given that Random TaPas is specially intended for large tanglegrams, we chose for subsequent analyses two sets of 100 tanglegrams each involving approximately 50 (mean = 50.5, median = 51, range: 47-54) and 100 (mean = 99.7, median = 100, range: 93-107) host-symbiont associations, respectively. For convenience, these subsets will be henceforth referred to as Set50 and Set100, respectively. Since some trees included terminal polytomies and GD requires fully resolved trees, we added 0.01 arbitrary units of time to all terminal branches. A limitation of Core-gen is that it only generates coevolutionary systems in which each symbiont can be associated with only a single host. Given that many real-world scenarios do not conform to this scenario (e.g., Example 2 below), we modeled the occurrence of colonization (aka host-sharing) by a given symbiont of several hosts following Drinkwater et al. (2016). For each triple, a rate of host sharing of 0%, 10% or 20% of the total available host species was set randomly. Then colonization was simulated by selecting each terminal in S and allowing the corresponding symbiont to colonize a random number x of additional hosts, {x ∈  | 0 ≤ x ≤ R × Nh}, where R represents the rate of host sharing for the given tanglegram and Nh the total number of host terminals.
Since additive trees (i.e., phylograms) estimated from molecular sequence data are commonly used in cophylogenetic analyses, we ran the simulations with the original ultrametric trees and phylograms derived from them. The transformation of the ultrametric trees into phylograms was done by multiplying their branch lengths by varying rates of molecular substitution (Brown and Yang 2011; Paradis 2014), sampled from a log-normal distribution with mean 0.01 substitutions/site/time unit (Brown and Yang 2011).
Simulations
We applied Random TaPas to Set50 and Set100 (both additive and ultrametric trees) using both PACo and GD with all combinations of the following parameter values: N=104, n= 5, 10 and 20 (Set50), and n=10, 20 and 40 (Set100) (i.e., n representing about 10%, 20% and 40% of the total associations), and p= 1% and 5%. In preliminary analyses, N= 105 was also tested with additive trees in combination with the same arrays of n and p values but the results were very similar to those obtained with N=104 (Supplementary Figures S1 and S2 in Supplementary Material). Since the increased computing time resulting from using a larger N did not result in a detectable improvement in performance of the method, N= 105 was not further considered. In simulations involving additive trees, prior to running PACo the patristic distances were rendered Euclidean by taking the element-wise square root of each cell in order to minimize geometric distortion and avoid negative eigenvalues (de Vienne et al. 2011).
For each simulation, the VMR of the frequency distribution of host-symbiont associations produced by Random TaPas was computed. We assessed the relationship between the VMRs of each set of simulations and the number of coevolutionary events (cospeciation, duplication, sorting, host-switching and colonization) associated to each tanglegram in two ways. First, regression trees were built with a recursive-partitioning function of package rpart in R (Therneau and Atkinson 2018). This approach is indicated to provide a general picture of the structure of the data and reveal complex interactions between variables (Crawley 2013). The importance of each coevolutionary event in each tree model (scaled to sum 1) was computed according to Therneau and Atkinson (2018). In addition, the coefficient of determination of each model (R2) was computed as the 1–relative error at the last split (Therneau and Atkinson 2018). Second, we computed the correlation coefficients between VMR of frequency distributions and the numbers of each of the coevolutionary events.
Pseudocospeciation experiment
In order to assess the ability of Random TaPas to distinguish between cospeciation and pseudocospeciation (de Vienne et al. 2007), we selected a triple (#63) in Set50 with high cospeciation signal. This simulated host-symbiont system resulted from 50 cospeciations, 1 sorting, 2 duplications, 1 complete host-switching and 0 colonization events. We arbitrarily selected a clade of 17 terminals to simulate rapid colonization and speciation of the symbiont lineage (de Vienne et al. 2007). In both the ultrametric and additive trees versions of the tanglegram, the branch lengths of the clade were shortened to half their original length, whereas its basal branch was lengthened to keep the original height of the clade. We applied Random TaPas to the original and modified tanglegrams using GD, N = 104, p = 5% and n = 5, 10 and 20. The ability of Random TaPas to distinguish cospeciation from pseudocospeciation was assessed by plotting as a heatmap on the tanglegram, the frequency of occurrence of each host-symbiont link and the average frequency of occurrence of each terminal in p.
Biological Examples
To gain further insight on its performance and provide further guidance to prospective users, we demonstrate the application of Random TaPas to two real-world examples. The trees, association matrices and R scripts used with each example are available at https://github.com/Ligophorus/RandomTaPas.
Example 1: Neotropical orchids and their euglossine pollinators.— We used the association data and published chronograms of pollinated orchids and their corresponding bee pollinators (Ramírez et al. 2011). The posterior probability trees of orchids and euglossine bees to build the consensus were kindly supplied by Santiago Ramírez, University of California Davis.
Random TaPas was run with GD and PACo, N = 104, n = 29 and p= 5%. This example involves 129 bee-orchid associations. The n value chosen was the maximum number of one-to-one associations that could be formed over the 104 runs, and it is close to the 20% we recommend based on results of the preceding simulations. In order to account for taxonomic uncertainty, we computed 95% confidence intervals of the host-symbiont frequencies of each association using a random sample (excluding the burn-in set) of 1,000 pairs of the posterior-probability trees used to build the consensus trees of euglossine bees and orchids. Random TaPas was run for each tree pair as specified above and the 2.5% and 97.25% percentiles of each host-symbiont association frequency were computed.
We also assessed the different contribution of each host-symbiont association to the global cospeciation signal by displaying as heatmap on the tanglegram their frequency of occurrence and the average frequency of occurrence of each terminal occurring in p. Taking the latter as a continuous trait, fast maximum likelihood estimators of ancestral states were computed with fastAnc of package phytools in R (Revell 2012), and their values were displayed on the nodes of the phylogeny as a color scale. We adopted this approach only to assess different levels of cophylogenetic signal across the tanglegram and by no means imply that we consider these estimators to reflect actual ancestral states of host-symbiont associations. In addition, we used negative binomial regressions (glm.nb function from the MASS package in R, Venables and Ripley 2002) to test for differences in average frequency of occurrence of each terminal in p among three main clades that represent each an orchid subtribe.
Example 2: Coitocaecum parvum and its amphipod host.— Data of mitochondrial haplotypes of the cytochrome oxidase subunit 1 of the trematode, Coitocaecum parvum (Crowcroft, 1945), and those of its amphipod host, Paracalliope fluviatilis (Thomson, 1879), in seven locations in South Island, New Zealand from Lagrue et al. (2016). This example is worked out in the Random TaPas User’s Guide (available at https://github.com/Ligophorus/RandomTaPas).
Random TaPas was run with GD and PACo, N = 104, n = 8 and p = 5% to evaluate the extent to which genetic differentiation among populations was coupled with local adaptation patterns (Lagrue et al. 2016). We chose n= 8 because it is a good compromise between the number of unique combinations of unique one-to-one associations that can be evaluated over 104 runs and the fraction of total number of host-symbiont associations (8 of 75, i.e., ≈ 10%). (The accompanying R script and the user’s guide demonstrates the strategy followed to choose the best n for this example). PACo by default assumes dependency of one phylogeny upon the other. Since in this case codivergence between host and parasite lineages was assumed to be reciprocal, PACo was run in symmetric mode (Hutchinson et al. 2017a). Estimation of confidence intervals of the host-symbiont frequencies and mapping of results on the tanglegram was performed as in Example 1.
RESULTS
Simulations
Not all simulations could be performed because, in some tanglegrams, the number of possible unique one-to-one associations between terminals was less than the number n set in simulations. So the number of tanglegrams produced in Set50 with n = 20, was 79; and those in Set100 with n=20 and n=40 was 99 and 63, respectively.
Forty-eight regression tree models describing the relationship between VMR of host-symbiont frequency distributions and the number of evolutionary events of tanglegrams involving the additive and the original ultrametric trees with all combinations of n and p and global-fit method employed were produced. The average and range of VMRs corresponding to each parameter combination are given in Table 1. Figure 2 shows the regression trees corresponding to Set50, additive trees, applying GD with all combinations of p and n. In general, the patterns were similar to those obtained with PACo and with other parameter combinations (Supplementary Figures S3-S9) and the R2 values suggest good agreement of the models with the data. The number of cospeciation events determined the first node in 43 of the models, but the placement of evolutionary events at subsequent nodes was very variable. In the remaining models, the number of sorting (4 instances) or duplication events (1 instance) determined the first split. These five models involved simulations in which n ≈ 10% of the total number of host-symbiont associations (Supplementary Figures S5, S8, S9). Figure 3 shows the relative importance of each evolutionary event in building the regression tree models. In 42 instances, the number of cospeciation events was the most important predictor of VMR, accounting for > 40% of the total in 38 cases. In six models, the number of cospeciation events was ranked as the second (5 cases) or third variable (1 case) in importance. These six cases involved models in which n represented ≈ 10% of the host-symbiont associations. Two and four of these were produced with GD and PACo, respectively. Five of the six cases were produced by models based on ultrametric trees and four were produced with Set100.
Mean and range of variance to mean ratios of frequency distributions of host-symbiont (h-s) associations produced by Random TaPas applied in conjunction to two global-fit (GF) methods, Geodesic Distances (GD) and Procrustes Approach to Cophylogeny (PACo) to two sets of 100 simulated tanglegrams each: Set50 and Set100 involving ≈ 50 and 100 h-s associations, respectively. Random TaPas was evaluated with both additive and ultrametric trees over 104 runs with a fixed number of unique h-s associations (n) ≈ 10%, 20% and 40% of the total number of h-s associations and percentiles (p) = 1% and 5%. (See Fig. 1 for definitions of n and p).
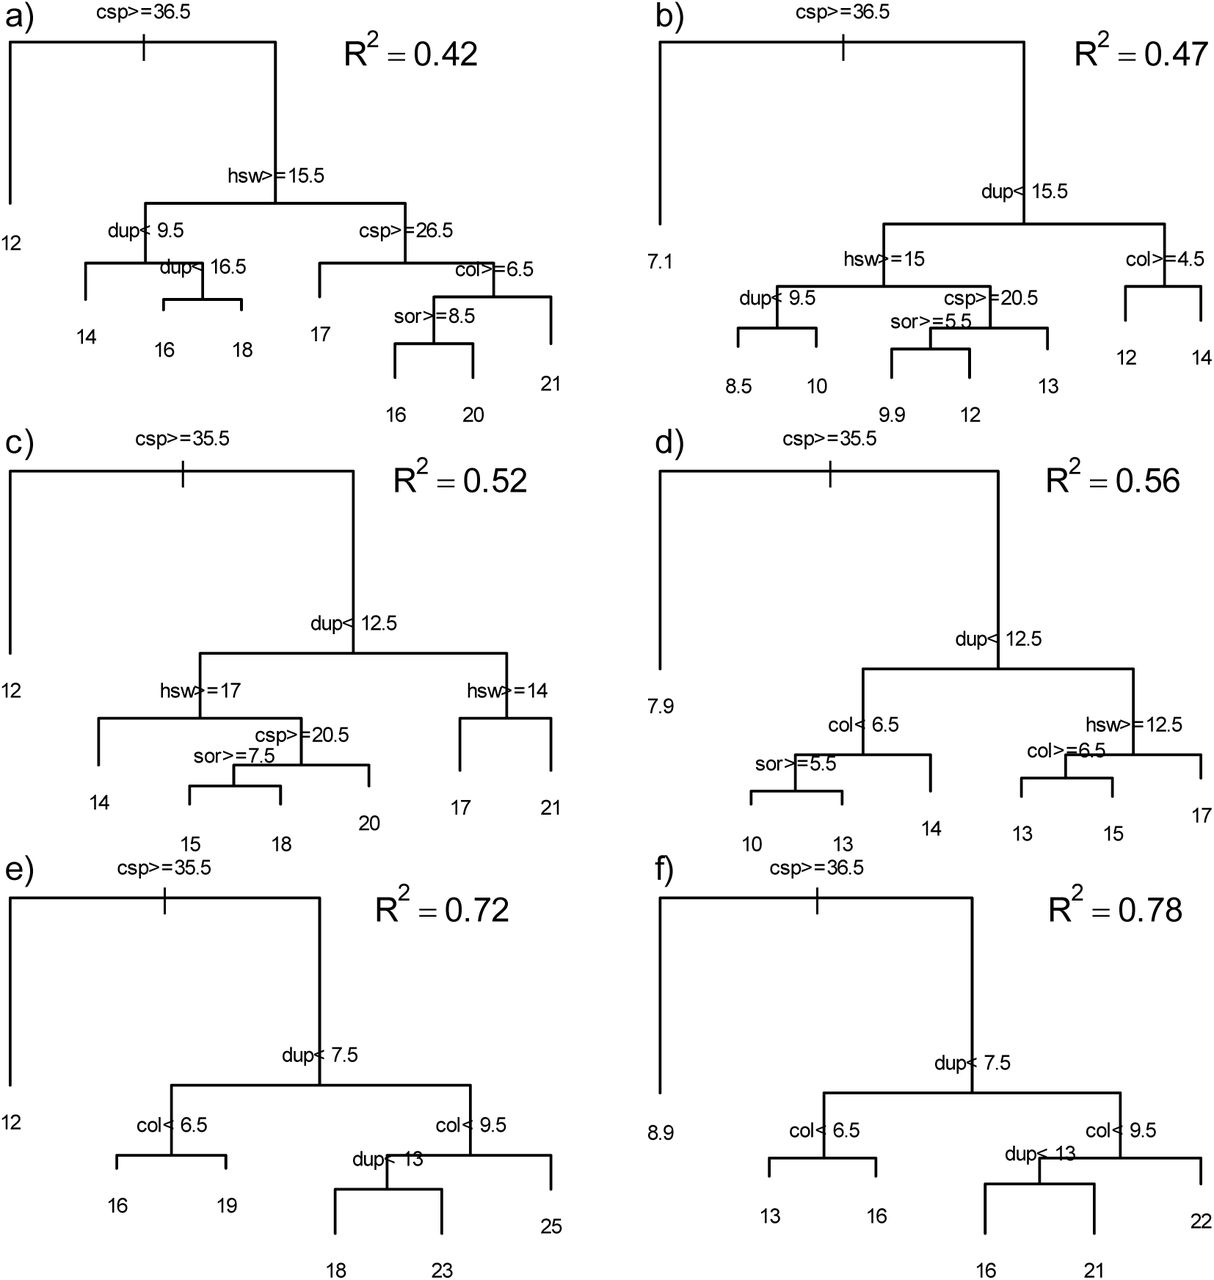
Regression trees relating the variance to mean ratio (VMR) of the frequency distribution of host-symbiont associations produced by Random TaPas with the number of evolutionary events in 100 simulated tanglegrams of ≈50 host-symbiont associations each, applying geodesic distances as global-fit method to phylograms. Expressions on nodes indicate the split criterion that shows the threshold value of the evolutionary event that was used to create the split. Branches to the left include cases that fulfill the criterion. Numbers at tips represent the average VMR of the group. Parameter combinations were as follows: (a) n = 5, p = 1%; (b) n = 5, p = 5%; (c) n = 10, p = 1%; (d) n = 10, p = 5%; (e) n = 20, p = 1%; (f) n = 20, p = 5%. Event abbreviations: csp = cospeciation, sor = sorting, dup =duplication, hsw = complete host-switching, col = colonization of new host without speciation.

Relative importance of evolutionary events to explain the variance-to-mean ratio of the frequency distribution of host-symbiont associations produced by Random TaPas with regression trees in two sets of 100 simulated tanglegrams each involving approximately 50 (a-d) and 100 (e-h) host-symbiont associations, respectively. Regression tree models were run with both additive (a, b, e, f) and ultrametric trees (c, d, g, h) applying Random TaPas with geodesic distances (a, c, e, g) and PACo (b, d, f, h) with a varying number of host-symbiont associations (n) and two percentile values (p). Event abbreviations: csp = cospeciation, sor = sorting, dup =duplication, hsw = complete host-switching, col = colonization of new host without speciation.
The correlation with the number of cospeciation events was significant (P < 0.01) in all simulations, ranging between −0.31 and −0.74. In 38 of 48 parameter combinations (16 of Set50 and 22 of Set100), the highest absolute correlations of VMR with the number of evolutionary events involved those with the number of cospeciations (Fig. 4). In the 10 remaining parameter combinations, the absolute value of the correlation coefficient with the number of cospeciation events was ranked second, but was very close to those of the first (duplications) and involved five cases each produced with GD and PACo. Eight of those cases involved simulations with additive trees and four cases represented simulations in which n ≈ 10% of the associations.

Correlation coefficients of the variance-to-mean ratio of the frequency distribution of host-symbiont associations produced by Random TaPas with the number of cospeciation events in two sets of 100 simulated tanglegrams each involving approximately 50 (a-d) and 100 (e-h) host-symbiont associations, respectively, and both additive (a, b, e, f) and ultrametric (c, d, g, h) trees applying Random TaPas with geodesic distances (a, c, e, g) and PACo (b, d, f, h) with a varying number of host-symbiont associations (n) and two percentile values (p). Event abbreviations: csp = cospeciation, sor = sorting, dup =duplication, hsw = complete host-switching, col = colonization of new host without speciation.
Pseudocospeciation experiment
In the additive trees, host-symbiont associations involving the modified clade were marked as highly congruent, showing similar values to those in the original tanglegram, independently of the n value chosen (Fig. 5). In contrast, the counterpart associations in the ultrametric trees were marked as incongruent with n = 5 and 10, but not with n =20 (Fig. 6).

Results of the pseudocospeciation experiment with one simulated tanglegram of ≈50 host-symbiont associations relating two additive trees. Random TaPas was applied with geodesic distances, p = 5% and n = 5 (a), n = 10 (b) and n = 20 (c) to the original (left) and modified (right) tanglegrams. In the latter, the branch lengths of one clade (arrow) were reduced to one half, whereas its basal branch was lengthened to keep the original height of the clade. The frequency of occurrence of each host-symbiont association in the percentile p retrieved by Random TaPas (see Fig. 1) is coded in a color scale, where red and blue denote low and high values, respectively. The points at terminals are also coded on the same scale and represent the average frequency of host-symbiont association in which the terminal is involved.

Results of the pseudocospeciation experiment with one simulated tanglegram of ≈100 host-symbiont associations relating two ultrametric trees. Random TaPas was applied with geodesic distances, p = 5% and n = 5 (a), n = 10 (b) and n = 20 (c) to the original (left) and modified (right) tanglegrams. In the latter, the branch lengths of one clade (arrow) were reduced to one half, whereas its basal branch was lengthened to keep the original height of the clade. The frequency of occurrence of each host-symbiont association in the percentile p retrieved by Random TaPas (see Fig. 1) is coded in a color scale, where red and blue denote low and high values, respectively. The points at terminals are also coded on the same scale and represent the average frequency of host-symbiont association in which the terminal is involved.
Example 1: Neotropical orchids and their euglossine bee pollinators
The frequency distributions of pollinator-orchid associations produced by Random TaPas with GD and PACo were highly skewed (Fig. 7a, b). The VMR of these frequencies obtained with the consensus trees were 30.03 and 30.29 for Random TaPas run with GD and PACo, respectively. Similar VMR values were obtained with the 1,000 pairs of trees used to compute the confidence intervals of the frequencies (Fig. 7c). Both GD and PACo revealed that nine pollinator-orchid associations were highly congruent, as they occurred in 100% of cases (Fig. 7). These associations were unrelated since involved orchids species of the three subtribes represented: Catasetinae (1 Galeandra, 1 Catasetum species), Zygopetalinae (1 Chondrorhyncha species) and Stanhopeinae (2 Coryanthes, 1 Gongora, and 2 Soterosanthus species) (Fig. 8). There were no significant differences among the orchid subtribes in the average frequency of occurrence of their terminals in p (negative binomial regression, P > 0.40 using both GD and PACo).

Results of Random TaPas applied to data of Neotropical orchids and their euglossine bee pollinators. The frequency distributions of pollinator-orchid associations were obtained with N = 104, n = 29, and p = 5% with GD (a) and PACo (b). Vertical lines represent 95% confidence intervals of the frequencies computed with 1,000 randomly chosen pairs of posterior probability trees used to build the consensus trees of bees and orchids. Horizontal lines represent the expected mean if all associations were contributing equally to cophylogenetic signal. (c) Variance to mean ratio (VMR) of the respective frequency distributions (asterisks) and boxplots of VMRs produced with the pairs of posterior probability trees generated with GD and PACo.

Tanglegram representing the association between Neotropical orchids and their euglossine bee pollinators. The frequency corresponding to each pollinator-orchid association shown in Fig. 7 is mapped using a color scale ranging from dark blue (highest) to dark red (lowest). The average frequency of occurrence of each terminal and fast maximum likelihood estimators of ancestral states of each node are also mapped according to the same scale.
Example 2: Coitocaecum parvum and its amphipod host
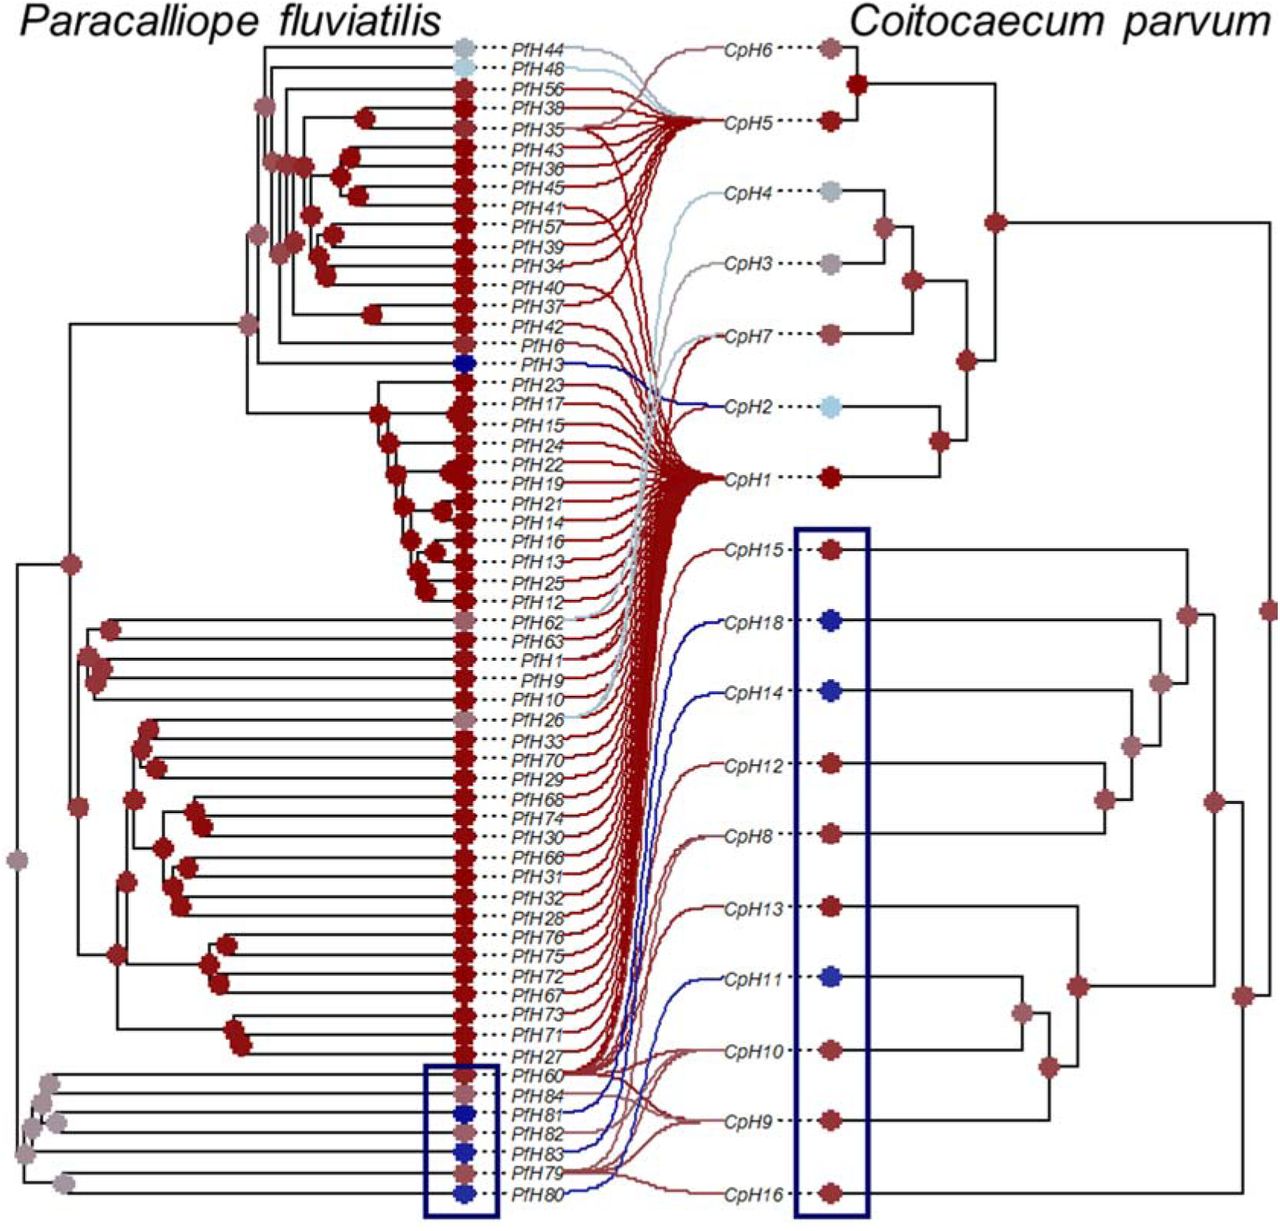
The frequency distributions of the associations between haplotypes produced by Random TaPas were highly skewed (Fig. 9). The wide confidence intervals associated with many host-symbiont associations (Fig. 9a, b) indicate the relatively high uncertainty about the placement of some nodes, but the VMRs were consistently high (> 20) (Fig. 9c). The frequencies plotted on terminals and nodes of the tanglegram indicate a higher signal between two early-branching clades of both phylogenies (Fig. 10). These represent host haplotypes from the Waikouaiti and Waitaki Rivers associated with parasite haplotypes of the latter.

Results of Random TaPas applied to study the association between haplotypes of the trematode Coitocaecum parvum with those of its amphipod host, Paracalliope fluviatilis. The frequency distributions of host-symbiont associations were obtained with GD (a) and PACo (b), N = 104, n = 8 and p = 5%. Vertical lines represent 95% confidence intervals of the frequencies computed with 1,000 randomly chosen pairs posterior probability trees used to build the consensus trees of trematode and amphipod haplotypes. Horizontal lines represent the expected mean if all associations were contributing equally to cophylogenetic signal. (c) Variance to mean ratio (VMR) of the respective frequency distributions (asterisks) and boxplots of VMRs produced with the pairs of posterior probability trees generated with GD and PACo.
Tanglegram representing the association between haplotypes of the trematode Coitocaecum parvum with those of its amphipod host, Paracalliope fluviatilis. The frequency corresponding to each trematode-amphipod association shown in Fig. 7 is mapped using a color scale ranging from dark blue (highest) to dark red (lowest). The average frequency of occurrence of each terminal and fast maximum likelihood estimators of ancestral states of each node are also mapped according to the same scale.
DISCUSSION
Herein we have developed Random TaPas that uses a given global-fit method for analysis of large tanglegrams and produces an index (VMR) that quantifies cophylogenetic signal in the data. In fact, the simulations indicated that VMR is inversely proportional to the number of cospeciation events used to build the evolutionary histories of hosts and symbionts. This is consistently shown with most parameter combination tested (particularly when n ≥ 20% of the total number of host-symbiont associations) and global-fit method used. When n ≈ 40% the correlation between VMR and number of cospeciation events tend to be higher, but note that not all simulations could be executed and those excluded represented cases with low number of cospeciation events. This is because the highest possible n of a given host-symbiont system conveys the maximum quantity of unique host-symbiont associations and its value is constrained by the nature of the joint evolutionary history. Thus this upper limit is informative of the amount of cophylogenetic signal in the system. For instance, in Example 2, out of 75 host-symbiont associations the highest possible n was 5 or 6 (depending on the randomization) over 104 trials, anticipating the low cospeciation signal detected. If possible, we recommend setting n at least 10%, and ideally around 20%, of the total number of associations because the simulation results suggest that the relationship with the number of cospeciation events becomes stronger. In addition, with ultrametric trees, n ≈ 20 % seems to provide a good balance between capturing cophylogenetic signal and detecting potential pseudocospeciation events.
The choice of p and global-fit method seems secondary to that of n, but note that p = 1% tended to produce more skewed distributions than p = 5% (Table 1). Random TaPas has been developed with two very different global-fit approaches. As noted above a potential of GD over PACo, and most other global-fit methods, is that it skips the potential effect of the dimensional mismatch between Euclidean and tree spaces (Holmes 2005). However, GD performed only marginally better than PACo in terms of relationship between VMR and number of cospeciation events, and overall results were very similar. This evidence points to robustness of Random TaPas to parameters and method utilized. In fact, the algorithm can be readily adapted to other global-fit methods. In a preliminary analysis, we ran it with ParaFit (Legendre et al. 2002), Set50, n = 20, yielding very similar results to those presented here in terms of relationship with the number of cospeciation events (unpublished data).
Although VMR can be related with the amount of cophylogenetic signal in the system, a current limitation is that it has no upper bound, and its value seems to depend on variables such as p and tanglegram size (Table 1), which makes it difficult to compare the degree of cophylogenetic signal among different data sets. So further work is needed on standardization or normalization of metrics of cophylogenetic signal. However, the results of the present or future simulations could be used as a benchmark to assess the degree of cophylogenetic signal in a given host-symbiont system. This is particularly valuable because current global-fit methods test for congruence between phylogenies, but do not quantify in a meaningful way the strength of the relationship. For instance, in Example 2, Lagrue et al. (2016) applied PACo and ParaFit to their data and reported highly significant (P < 0.001) evidence for cophylogenetic signal. Likewise, applying the same analyses to Example 1 leads to a similar conclusion (PACo: m2XY = 1.52·105, P < 0.0001; ParaFit: ParaFitGlobal = 1.18·109, P < 0.0001). However, in both examples the estimated VMR values were around 30 which falls above the ranges computed in the simulated tanglegrams, particularly the large ones (Set100) (Table 1), which strongly suggests that cospeciation (Example 1) or codiversification (Example 2) did not play a prominent role in the evolutionary history of these systems. In Example 1, the most congruent associations were scattered in the tanglegram, which agrees with the hypothesis that preexisting traits in the euglossine bees (i.e., collection of aromatic compounds), rather than cospeciation, drove floral adaptation and diversification in euglossine-bee pollinated orchids (Ramírez et al. 2011; Pérez-Escobar et al. 2017). By contrast, in Example 2, cophylogenetic signal was unevenly distributed being stronger in the early-divergent lineages of both phylogenies. This would account for the mismatch between the genetic differentiation and local adaptation patterns that Lagrue et al. (2016) found it difficult to account for, and supports a scenario of geographically structured differences in codiversification proposed by these authors.
A problem with global-fit methods is that they do not correct for phylogenetic nonindependence, so that comparison of pairwise distance matrices derived from host and symbiont phylogenies gives greater weight to pairs that include deeper most recent common ancestors (MRCAs) than those involving shallower ones (Schardl et al. 2008; de Vienne et al. 2013). To deal with this issue, Schardl et al. (2008) proposed selecting a single pairwise distance per MRCA prior to evaluation of congruence between two phylogenies globally. However, this approach is not immediately applicable to assess the contribution of individual host-symbiont associations to the global fit.
Without correction for nonindependence, phylogenetic congruence between old MRCAs is expected to be propagated towards the descendent terminals. So associations between them would tend to be identified as congruent even if the placement of their more recent MRCAs is not. In Example 2, for instance, ParaFit indicated that all except two associations contributed significantly (P<0.05) to congruence, whereas PACo rendered 45 associations in which the confidence intervals of their associated squared residuals fell below the median squared residual value (Lagrue et al. 2016). In contrast, Random TaPas identified only seven (GD) or eight (PACo) trematode-amphipod associations whose confidence intervals of their frequency of occurrence in p was above the expected frequency of a uniform distribution (perfect codiversification scenario). This restricted number of supposedly congruent associations agrees better with the low cophylogenetic signal detected. So although further work is needed to clarify this issue, we suggest that, although nonindependence is not completely accounted for in the partial tanglegrams, the evaluation of a limited set of associations over a large N seems to buffer the effect of phylogenetic nonindependence. So Random TaPas would represent a better way to determine which host-symbiont associations contribute most to cophylogenetic signal than current global-fit methods. In any case, we find that the mapping of cophylogenetic signal on the tanglegram is an extremely useful new tool for the analysis of coevolutionary histories as it allows evaluating variation in cophylogenetic signal and testing specific hypotheses, such as differences among taxa as illustrated in Example 1.
A final word of caution is that the effects of cospeciation and pseudospeciation on cophylogenetic signal can be difficult to tease apart, especially if the trees are not dated. However, one would expect pseudocospeciation to be more prevalent if host trees are clustered in few large clades and in those with rapid species turnover (rapid adaptive radiations), particularly if symbionts are highly specific (Engelstädter and Fortuna 2018). With dated trees, our results suggest that marked differences in frequency of host-symbiont associations with varying n can give clues about the presence of pseudocospeciation in the system.
In summary, Random TaPas represents a new tool for cophylogenetic analysis that provides a framework to assess cophylogenetic signal in a given host-symbiont system. In addition, it facilitates data interpretation by mapping the extent of cophylogenetic signal on the tanglegram. The method can handle large tanglegrams in affordable computational time, incorporates phylogenetic uncertainty, makes a more explicit links with cospeciation, and is more reliable to identify host-symbiont associations that contribute most to cophylogenetic signal than regular global-fit methods. For greater usability, Random TaPas is implemented in the public-domain statistical software R.
ACKNOWLEDGEMENTS
We thank Santiago Ramírez, University of California Davis, for providing the raw data of Neotropical orchids and their pollinators and for valuable indications for their analysis. Funded by the Ministry of Economy, Industry and Competitiveness, Spain (CGL2015-71146-P, MINECO-FEDER, UE). CLB is supported by a fellowship from Conselleria d’Educació, Investigació, Cultura i Esport, Generalitat Valenciana (ACIF/2016/374).
REFERENCES


