

ABSTRACT
Biodiversity is distributed unevenly from the poles to the equator, and among branches of the tree of life, yet how those patterns are related is unclear. We investigated global speciation-rate variation across crown Mammalia using a novel time-scaled phylogeny (N=5,911 species, ~70% with DNA), finding that trait- and latitude-associated speciation has caused uneven species richness among groups. We identify 24 branch-specific shifts in net diversification rates linked to ecological traits. Using time-slices to define clades, we show that speciation rates are a stronger predictor of clade richness than age. Mammals that are low dispersal or diurnal diversify the fastest, indicating roles for geographic and ecological speciation, respectively. Speciation is slower in tropical than extra-tropical lineages, consistent with evidence that longer tropical species durations underpin the latitudinal diversity gradient. These findings juxtapose modes of lineage diversification that are alternatively turnover-based, and thus non-adaptive, or persistence-based as associated with resource adaptations.
INTRODUCTION
Biological diversity is concentrated at the equator more than the poles, and in some evolutionary lineages more than others. Yet how these organic phenomena are connected is an open question. The latitudinal diversity gradient is generally attributed to stable tropical productivity (1–5), but there is far less consensus regarding why species richness is distributed unevenly across the tree of life. Phylogenetic tree shape was first characterized taxonomically as species-per-genus ‘hollow curves’ (6) and later formalized under the concept of tree imbalance or unevenness (7). To arise, more speciose clades must have been derived from faster rates of net diversification (speciation – extinction), older ages (earlier divergences), or both. However, the relative contribution of clade rates and ages to species richness is widely disputed (e.g., (8–11)). Similarly controversial are the causes of diversification-rate variation in real phylogenies, whether due to stochasticity, determinism via ecological factors or time, or artifacts from how we reconstruct evolutionary history (12–21). Latitude might determine the rates at which new species originate and persist or go extinct (2, 3, 22, 23), but so too might species’ intrinsic traits (24), some of which are correlated with latitude (e.g., (25)). Thus, understanding the causal underpinnings of uneven species richness patterns requires connecting levels of indirect (e.g., eco-geography) and direct (e.g., rates, ages) causes to assess their joint influences. Furthermore, investigating rate variation across large swaths of the tree of life simultaneously avoids ascertainment biases and methodological differences in compendia of smaller trees (26).
The last ~180-million-years of crown mammalian evolution have resulted in ~6000 living species (27, 28), which inhabit nearly all terrestrial biomes plus the open oceans, and thousands of preserved ancestors described as fossil taxa (29–31). Within this context, similarly aged clades in the mammal tree range from mega-diverse rodents (~2500 living species) and bats (~1300 species) to species-poor groups like treeshrews (20 species) and pangolins (8 species; all four share stem ages of ~60-70 million years ago [Ma] (28, 32)). The early availability of a species-level ‘supertree’ phylogeny of mammals (now cited over 1,800 times; (33)) encouraged initial studies of macroevolutionary-rate covariates (e.g., (19, 34–36)). However, because that pioneering supertree was assembled from hundreds of overlapping source trees, over 50% of its nodes were initially unresolved and then simulated to obtain a bifurcating time-scaled phylogeny (33, 37). Timings of diversification from this supertree, along with two other mammal supertrees (11, 38), were consequently shown to have inflated precision relative to the large gaps in available fossil age and DNA sequence data (28).
Here, we draw upon a new species-level, time-calibrated phylogeny for global Mammalia, which is built from a contiguous DNA supermatrix (31 genes by 4,098 species) and consists of credible sets of 10,000 trees (28). We used these phylogenies, which jointly model topological and age uncertainty, to better understand the temporal dynamics of mammalian diversification relative to the potentially causal effects of organismal and environmental factors. Our objectives were three-fold. We first tested for tree-wide and branch-specific rate variation in relation to geological events such as the Cretaceous-Paleogene (K-Pg) mass extinction to explore whether significant shifts in net diversification rates were mutually triggered. We then use neutrally defined (time-slice based) clades to explore the relative roles of clade ages and speciation rates in explaining current-day species richness. Finally, we develop the link between observed variation in speciation rates and its putative ecological causes, testing whether factors predicted to cause newly formed species to persist or go extinct are, in turn, causing the observed patterns of uneven species richness.
We focus on three potential ecological causes (vagility, latitude, and diurnality) of rate variation. First, we tested whether low-vagility species have higher speciation rates than more dispersive species, due to their greater capacity to form nascent allopatric species (39, 40). For this test, we developed an index of organismal vagility for all mammals (i.e., dispersal ability; (41)). Vagility has never been assessed across mammals, although evidence in birds using the hand-wing index supports an inverse vagility-to-speciation rate relationship (e.g., (42, 43)). Second, if unstable environments increase species ephemerality via greater lineage turnover (44), then we expect to find higher rates of recent species-specific (i.e., ‘tip’) speciation in temperate latitudes where climates were historically less stable (23, 45). To our knowledge, no latitudinal tests of tip rates have been conducted in mammals to date, but clade-level comparisons have either been inconclusive (46) or tentatively supported greater temperate than tropical lineage turnover (22, 36, 47). Lastly, we test whether diurnality (daytime activity) has increased speciation rates relative to nocturnal clades, following recent evidence that all mammals were nocturnal until daytime niches evolved ~35 Ma (48, 49). The influence of diurnality on speciation rates has thus far only been investigated in primates (50), although a mammal-wide study did investigate ancestral activity states (49). We are thus using species-level trait proxies to investigate scenarios of geographic, ephemeral, and adaptive modes of species diversification in mammals, respectively.
Overall, our approach ties together among-clade variation in rates, ages, richness, and traits using phylogenetic path analyses, to our knowledge for the first time in any taxon. By jointly assessing the causal contributions of ecological factors to the inferred tempo of mammalian lineage diversification, we are able to elucidate their relative importance to generating uneven species richness patterns. We uncover that vagility and diurnality are greater causes of recent speciation-rate variation than latitude, with rate variation in turn contributing more to uneven species richness than differences in clade age.
RESULTS AND DISCUSSION
Tree-wide lineage diversification relative to the K-Pg event
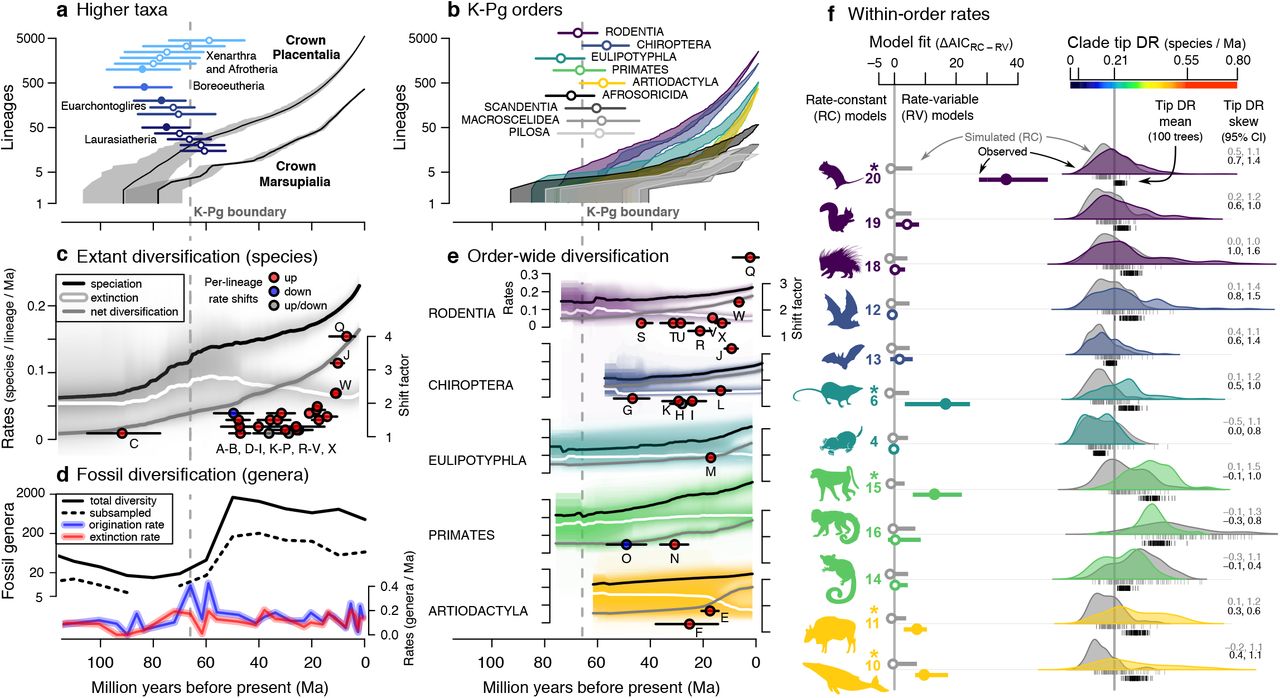
The Mammalia tree shows substantial unevenness in species richness across major named clades (Fig 1a). We first evaluated evidence for whether early placentals diverged before, after, or during the K-Pg event, known as the short fuse, long fuse, and explosive models, respectively (51). The first four placental divergences unambiguously preceded the K-Pg (Fig. 2a; filled circles), followed by the next 21 divergences with CIs that overlap it (Fig. 2a–b). Therefore, we detect a Cretaceous “fuse” of ~25-Ma between the radiation of crown Placentalia and nine of 18 crown orders (Fig. 2b), in line with some estimates (32, 52), but longer than others (e.g., (33)).

(a) The maximum clade credibility topology of 10,000 node-dated trees, with numbered clade labels corresponding to orders and subclades listed in the plot periphery: Eulipoty., Eulipotyphla; Carn., Carnivora; Artio., Artiodactyla. Scale in millions of years, Ma. Branches are colored with tip-level speciation rates (tip DR metric) and marked with 24 inferred shifts in branch-specific net diversification rates (nodes A-X; shifts with multiple circles occurred on either branch, not both). Tip-level rates are reconstructed to interior branches using Brownian motion. (b) Per-species ecological traits: allometric index of vagility (dispersal ability), diurnality (predominant daytime activity), and north-south latitudinal extent (see Methods for details). Silhouettes are from phylopic.org and open source fonts.

Lineage-through-time plots and estimated crown ages for (a) all superordinal divergences (y-axis does not apply to error bars), and (b) placental orders with crown age estimates overlapping the Cretaceous-Paleogene extinction event (K-Pg, dashed gray line; means and 95% CIs; filled circle if statistically different). (c) Rate-through-time plots for speciation, extinction, and net diversification (summarized from Fig. 1 rate shifts; medians from 10 trees, 95% CIs in light gray). (d) Fossil genus diversity through time for all Mammalia, including subsampled genus richness (quorum 0.5) and per-capita rates of genus origination and extinction. (e) Extant rates and lineage-specific rate shifts for the five most speciose mammal orders (same symbols as in c). (f) Rate variation within subclades of these five orders as numbered from Fig. 1; left: difference in AIC between best-fit models of diversification for trees simulated under rate-constant birth-death (gray) versus observed mammal trees (color; filled circle and * if ΔDAIC on 100 trees is statistically different); and, right: tip-level speciation rate (tip DR metric) distributions of the same simulated and observed subclades (gray versus color, one tree), comparing variation in clade tip rate mean and skew across 100 trees. The last 2 Ma are removed from parts c-e to focus on pre-recent rate dynamics.
Modeling branch-specific rates across the tree shows a pulse in both speciation and extinction near the K-Pg (Fig. 2c) that remarkably matches concurrent fossil evidence for increases in origination and extinction (Fig. 2d; synthesized from the Paleobiology Database (30)), as well as tree-wide shifts to higher net diversification rates in the 5-Ma following the K-Pg (Fig. S5-S7). Such dynamics of lineage turnover following the K-Pg are previously reported in fossil eutherians (51, 53), as attributed to selective extinction followed by ecological opportunity for the surviving mammal lineages (54, 55). Thus, this fossil-calibrated molecular phylogeny (28) appears to reflect dynamics evident from the fossil record alone.
Branch-specific rate shifts relative to time and traits
We recover shifts in net diversification rates at 24 consistent locations in the mammal tree (Fig. 1a, 2c, e; shifts are present in ≥ 50% of maximum shift credibility trees using BAMM (56), see Supplementary Materials Fig. S7, Table S1). The earliest rate shift occurs in either crown Placentalia (1.1x higher than the median background rate of 0.138 species/lineage/Ma) or Boreoeutheria (1.6x, node C in Fig. 1a). These shifts involve 18 different lineages, 15 of which are consistent increases. The only rate decrease was in the strepsirrhine primates (lemurs, lorises, and galagos; node O). Two other shifts are alternately up or down, depending on the tree sampled (nodes H, P; Fig. 1a). This result compares to 27 rate-shifted clades detected on the original mammal supertree using an earlier method (15 increasing and 12 decreasing (19)—but note caveats about the identifiability of downshifts (57)). Overall, rate increases nearer the present are higher, with a 2.2x mean in the Miocene versus 1.3x in each the Oligocene and Eocene (Fig. 2c; df=2, F=7.772, P=0.003). This result is consistent with the expectation for extinctions deeper in the tree to have reduced our ability to quantify more ancient shifts (56, 58), as well as fossil and molecular evidence that younger clades tend to have faster rates of diversification (21).
Species in rate-shifted clades overall have dissimilar ecologies (Fig. 1b), yet share more attributes than expected if idiosyncratic mechanisms were entirely fostering major radiations. We note the conspicuous latitudinal pattern of alternating south-north-south endemism among major rodent clades, which may relate to historical biogeographic incumbency (e.g., (59)). Strikingly, the two largest rate increases (4.0x and 3.2x) occurred in lineages with disparate life modes but similar propensities for genetic isolation: the fossorial tuco-tucos of South America (Ctenomys, node Q), and the Indo-Pacific flying foxes (Pteropus, node J; Fig. 1a). Thus, small burrowers and large flyers both show similar signatures of recent and rapid speciation under conditions of insularity, although in subterranean and oceanic realms, respectively. Tree-wide tests of traitdependent speciation suggest that high vagility is marginally associated with novel rate regimes (STRAPP (60) one-tailed test, P = 0.08), which is contrary to the inverse vagility-to-speciation relationship we expected (39, 40). However, these tests are complicated by the fact that many high-vagility lineages are also diurnal, and diurnality is a clearly associated with shifts to higher speciation-rate regimes (P = 0.027; Fig. S8). Diurnality-associated rate shifts in simian primates, carnivorans, cows, and whales (shifts N, D-F, and Q; Fig. 1a) also contain a majority of high-vagility species (>1 km natal dispersal distance), and many with large latitudinal breadths (Fig. 1b). We thus highlight the need to tease apart the relative contributions of vagility, latitude, and diurnality to understand their effects upon rate heterogeneity in mammalian clades.
Named clade rate variation
Beyond rate-shifted clades, we consider diversification-rate variation within the five most speciose placental orders (Fig. 2e-f). Testing fits to diversification models of rate-variable processes through time (RV, exponential or linear; (61)) versus rateconstant ones (RC, single rates of birth or death), we find greater fits to RV models in five of the 12 named subclades examined (Fig. 2f; Table S2). The mouse-related clade of rodents (clade 20 in Figs. 1, 2f) has a branching pattern best fit by RV processes in all 100 trees examined, as expected from the seven branch-specific rate shifts already uncovered in that clade (nodes R-X in Figs. 1, 2). Shrews, catarrhine primates, and the cow- and whale-related clades of artiodactyls join mice in showing greater RV fits than expected from RC simulation, as well as one rate shift each (clades 6, 15, 10, and 11; Fig. 2f).
Since jump-shift processes were not directly compared to time-varying RV ones, or to tree-wide shift scenarios (Fig. S5-S7), these models were not differentiable by our tests. In theory, they may require considerably more fossil data to be identifiable (62). Nevertheless, clade-specific fossil and molecular evidence supports our assertion that ancestral whales and dolphins entered a novel macroevolutionary regime, including selection toward larger body sizes (56, 60, 61, 63). Bats, on the other hand, display an inconsistent fit to RV models of diversification (clades 12-13, Fig. 2f), and an inconsistent number of rate shifts between our study (six, nodes G-L, Fig. 1a) and a previous one (two, nodes H and J; (64)). We suggest that high levels of topological uncertainty, which is arguably greater in bats than other orders (65), is contributing to the equivocal modeling of RC, RV, and jump-shift processes across credible tree sets for bats (Table S2).
As an additional, more sensitive, test of within-clade rate variation, we use clade-wide distributions of tip-level speciation rates as assessed using the tip DR metric (66) (Fig. 2f). Broadly, we recognize substantial heterogeneity in tip rates across the mammal tree, sometimes with a few high-tip-rate species nested together with lower-rate species (Fig. 1a), resulting in long right-side tails in the tip-rate distributions (positive skew, e.g., bat and rodent clades 12 and 18; Fig. 1a, 2f). We propose that tip rate skew measures aspects of within-clade speciation-rate variation that is otherwise uncaptured by fitting a priori models of the diversification process (Table S3), and thus offers a distinct predictor of among-clade variation in species richness.
Time-slice clade richness relative to ages and rates
The relative importance of clade ages (time) versus rates of speciation and extinction (whether stochastic or ecologically deterministic) as an explanation of extant diversity levels is widely debated (8–12, 16, 17). Original claims that uneven trees are random outcomes of constant-rate diversification (e.g., (67)) have been refuted (10, 13, 18). However, past efforts to separate these hypotheses have focused on named clades (e.g., (10)), which are biased by subjective delineation and often vast age differences (mammal families range 3.8–59.0 Ma in mean crown ages; (28)).
To avoid problems associated with subjective clade definitions, we sliced phylogenies at five-million-year intervals and took the tipward clades as objective units for analysis (Fig. 3). Time-sliced clades thus account for the ‘pull of the present’ in modern trees (58) by analyzing successive levels of rootward covariance among clade crown age, species richness, tip rate mean and skew, and mean ecological traits. If time-constant rates predominate (11, 12, 17), crown ages will explain the most among-clade variation in species richness. In contrast, if rate variation is strong, as we already recognized for some nodes and named clades (Fig. 2) and expect from varying ecological regimes (7, 19, 39, 68), diversification rates will have the greater explanatory power.

(a and b) An example subclade of 64 species, the rodent family Heteromyidae, is divided into time-sliced clades in the same way as for all Mammalia. Branch colors in the family-level phylogeny correspond to tip-level diversification rates (tip DR) calculated on the full tree, and red symbols are sized according to estimates of species vagility. An example time slice for 5-Ma tipward clades is shown with summaries of tip DR mean and vagility (harmonic and geometric means) to compare to clade crown age and richness. (c) Example Mammalia-wide time slice at 35 Ma delimiting clades for multivariate PGLS (phylogenetic generalized least squares) analysis on log clade richness, as was performed on 100 trees throughout this study. Observed mammal clades are compared to clades from simulated rate-constant trees of the same age and richness. (d) Results for clades defined at time-slices every 5 Ma for log clade richness and its variance, as compared among empirical mammal trees and simulated trees.
We find that clade age and richness are positively correlated—yet significantly less so than the unique effects of tip rate mean and skew on richness (Fig. 4, multivariate PGLS; Fig. S10 for univariate and taxon-based results). Critically, clade tip rate mean has stronger effects on richness than expected from simulated birth-death trees containing only stochastic rate variation (Fig. 4b). Clade tip rate skew is also significant, especially so at deeper time slices (Fig. 4c), confirming that single speed-ups in diversification within a clade (e.g., due to a rate shift in one lineage) can drive much of its overall species richness today. These analyses are robust to the influence of species that are missing DNA sequences and imputed (Fig. S10). Our findings thus support arguments that ‘ecology’ (broadly defined to include any extrinsic or intrinsic factor that alters macroevolutionary-rate processes) is a greater cause of species richness variation than time (16); however, both clearly contribute to observed richness (adjusted-R2: 0.88 full model versus 0.74 with tip rate mean only and 0.26 with crown age only, means of 100-tree PGLS among 35-Ma clades). Jointly analyzing richness determinants in time-sliced clades offers an objective way to assess age and rate effects that, in turn, enables tests for which ecological factors are driving that rate variation.

(a) The log species richness of clades tipward of each 5-Ma time slice (dotted lines from 5-70 Ma) across a sample of 100 phylogenies (maximum clade credibility tree shown) is best predicted jointly by clade crown age, (b) clade tip DR mean, and (c) clade tip DR skew. Multivariate phylogenetic analyses of clade richness in observed trees (grey) is compared to trees simulated under rate-constant birth and death with different extinction fractions, ε (colours in legend; PGLS on standardized data with 95% confidence intervals [CIs] on parameter estimates). Solid black lines are the observed best-fitting models given random effects of time slice and tree.
Linking uneven rate variation to ecological factors
We performed phylogenetic path analysis (69) to assess the hypothesized effects of species vagility (39, 40), latitude (22, 23), and diurnality (48) upon the joint, yet unequal, contributions of rates and ages to extant species richness variation (Fig. 5, Methods, Fig. S4). Here, the time-sliced clades allow us to distinguish trait-rate dynamics that are localized near the species level (if traits drive ephemeral speciation (44) or if they evolved very recently) from those that occur deeper in the tree and persist (if traits evolved anciently and did not affect extinction rates). Our assembly of species-level traits across Mammalia (Fig. 1b) enables us to directly pass information to clade-level means, thereby summarizing the ecological ‘essence’ of that clade for a given trait. However, we note that other statistical moments (e.g., trait variance or skew) may prove useful for future study.

(a, top panel) Distribution of tip-level speciation rates (tip DR metric, harmonic mean of 10,000 trees) relative to per-species estimates of vagility (maximum natal dispersal distance), diurnality (0=nocturnal or cathemeral, 1=diurnal), and absolute value of latitude (centroid of expert maps) across 5,675 species (excluding extinct and marine species). Loess smoothing lines visualize general trends (blue, span=0.33). Tip-level effects (bottom panel) from univariate PGLS between tip speciation rates and ecological traits subset across trophic levels (1000 trees, 95% CI, colored if significant). (b) Phylogenetic path analysis (69) of putative causal relationships between traits and rates leading to clade species richness for time-sliced clades. Path thickness, color, and directionality denote median coefficients of model-averaged analyses. The bottom panels provide per-estimate uncertainty across time slices (slope ± SE, 1000 trees). Non-zero estimates, either positive (blue shades) or negative (red shades), are totaled in the right margin; paths present in >500 trees are bolded and displayed in path model whereas others are dashed.
At the species level, we find that low-vagility mammals have higher tip speciation rates, especially in herbivores and carnivores (Fig. 5a; ecological trait ~ rate PGLS (70)). Effects of vagility on clade tip rate mean are weakened at deeper time slices, where they are instead recorded on tip rate skew (Fig. 5b). We interpret these short-lived effects of vagility on speciation rates as consistent with expectations that nascent allopatric species are produced at a high rate, but are ephemeral, going extinct before they can expand their geographic range (39, 40, 44, 71). While the nearly 20% of mammal species that are endemic to islands complicates our allometric vagility index, we note that the ~10-million-year ‘threshold’ whereby low-vagility lineages find an adaptive zone, evolve greater vagility, or vanish is robust to multiple sensitivity tests (Fig. S13-S14). The influence of vagility on mammal diversification, however, might be non-linear as it is in birds (e.g., humped (39) or sigmoidal (43)).
To test the causal role of environmental stability in the generation of mammalian tree shape (3, 23, 45), we evaluate the impact of latitudinal centroid distance from the equator upon speciation rates. Contrary to the expectations of ephemeral speciation processes driving recent, high rates of speciation at temperate latitudes (22, 23, 45), we find no effect of absolute latitude on tip-level speciation (Fig. 5a). Instead, strong positive associations with latitude only arise at deeper time slices, and without any corresponding effects on clade tip rate skew (Fig. 5b). Similarly weak latitude-to-rate effects in young clades and species of birds (22, 45, 66, 72) appear to emphasize that species turnover cycles are erasing a portion of the latitudinal effect. We suggest that the traditionally invoked tropical ‘cradle’ (higher speciation) and ‘museum’ (lower extinction (3)) should re-focus upon the combined turnover of those processes and test whether extratropical species are ‘cycled’ faster than tropical species. Extratropical lineages may not cycle fully, but instead persist through climatic oscillations in glacial refugia (73). In that case, the Eocene-Oligocene (~34 Ma) expansion of temperate habitats (3) may have initiated converse latitudinal gradients in species turnover rates and total richness. Within North America, the fossil record suggests the latitudinal gradient in mammalian richness was not established until ~15 Ma (74).
Lastly, we queried the effect of diurnality, a core behavioral trait thought of as a temporal niche innovation (48). We find that repeated origins of daytime activity since the late Eocene (~35 Ma (48, 49)) are associated with faster speciation, both at the present (Fig. 5a) and among time-sliced clades at 10 Ma (Fig. 5b). These findings complement the signature of greater diurnal activity on rate-shifted clades (Fig. S8), as well as place previous findings of rapid diversification in diurnal lineages of primates (50) in a broader context. We suggest that inverse effects of diurnality on tip rate skew at deeper time slices (Fig. 5b) are misleading given the evolution of daytime activity ~35 Ma, well after a ‘nocturnal bottleneck’ among K-Pg-surviving mammals (48, 49). We posit that greater daytime activity is an example of an adaptive divergence in niche traits that has decreased extinction rates via competitive release (i.e., an ‘ecological opportunity’; (68, 75)), and therefore led to greater species richness via persistence.
CONCLUSION
Our analyses here connect ecological factors to their time-scale-dependent effects on speciation and diversification in mammals. We detect cross-clade signatures of intrinsic (vagility, activity pattern) and extrinsic (latitude) factors driving aspects of lineage diversification at nested phylogenetic levels. We hypothesize that two main processes are at work. First, turnover-associated speciation is acting on short timescales due to geographic isolation among low-vagility species, and on longer time scales, from the dynamics of extratropical climates. Second, persistence-associated speciation is occurring in diurnal lineages as an example of a trait that adaptively couples greater speciation with lower extinction rates. Traversing from the first to second macroevolutionary mode may be possible if otherwise ephemeral allopatric species enter novel regions of ecological space, either via niche evolution or extrinsic opportunity, to then differentially persist under lower extinction risk (44, 68, 71, 75). Future tests that leverage direct measurements of fossil extinction rates in lineages that have evolved low vagility or diurnality will be valuable for assessing the frequency of these contrasting diversification modes.
Overall, we show that ecological factors influence speciation rates, but the effects manifest at different hierarchical levels of the tree due to apparent differences in associated lineage turnover. The longstanding gradient of greater tropical than temperate environmental stability has led to longer species durations for tropical mammals. Geologically recent processes associated with species turnover or adaptive persistence are not yet studied for most of life, but our results for mammals suggest that lineage-level gradients in these novelty-originating processes have causes that are rooted in the dynamics of population-level gene flow. Efforts to connect evolutionary levels from individual organisms to speciose clades thus appear most promising for understanding the causes and consequences of geographically and phylogenetically uneven species richness across the broader tree of life.
METHODS
Mammalian phylogeny and species trait data
We leveraged the recently constructed species-level mammal trees of Upham et al. (28) to conduct all analyses. Briefly, these phylogenies include 5,804 extant and 107 recently extinct species in credible sets of 10,000 trees. They are built using a ‘backbone-and-patch’ framework that used two stages of Bayesian inference to integrate age and topological uncertainty, and incorporate 1,813 DNA-lacking species using probabilistic constraints (available at vertlife.org/phylosubsets). We compared credible sets of trees built using node-dated backbones (17 fossil calibrations) and tip-dated backbones (matrix of modern and Mesozoic mammals), as well as taxonomically completed trees (5911 species) versus trees of DNA-only species without topology constraints (4098 species).
Our workflow for gathering trait data involved (i) unifying multiple trait taxonomies (e.g., EltonTraits v1.0 (76), PanTHERIA (77)) to our phylogeny’s master taxonomy; and (ii) interpolating home range area and vagility to the species level using known allometric relationships in mammals (Fig. S2). Vagility was calculated as the maximum natal dispersal distance per individual (km) and interpolated for each species following our updated version of Whitmee and Orme’s (41) best-fit equation, which applies species means of body mass, home range, and geographic range (Fig. S3). Note that our vagility index does not account for locomotor abilities (e.g., flying or arboreality), but rather captures aspects of space use that scale allometrically across mammals.
Tip-level speciation rates
We calculated per-species estimates of expected pure-birth diversification rates for the instantaneous present moment (tips of the tree) using the inverse of the equal splits measure (66, 78). This metric has been called ‘tip-level diversification rate’ (tip DR) because it measures recent diversification processes among extant species (79). However, to avoid confusion with ‘net diversification’, for which tip DR is misleading when extinction is very high (relative extinction >0.8 (80)), we here refer to tip DR as a tip-level speciation rate metric. At the tip level, we show that tip DR is tightly associated with model-based estimators of speciation and net diversification rates in our trees (Fig. S1a). At the clade-level, we measure ‘clade tip speciation mean’ as the harmonic mean of tip DR among species, which is known to converge to the maximum likelihood estimator of pure-birth diversification rate in clades with >10 species (66, 78). We show that clade tip DR mean indeed best approximates pure-birth clade rates for time-sliced clades in our mammal trees (R2: ~0.7 versus ~0.5 for birth-death speciation and net diversification rates; Fig. S1b).
Branch-specific and tree-wide rate shifts
We performed searches for macroevolutionary shifts using BAMM v2.5 (56), a reversible-jump algorithm for sampling birth-death rate regimes without a prior hypothesis. We evaluated the number and location of rate shifts on 10 trees from the node-dated sample of complete mammal trees. We summarized across the most likely shifts per tree—called maximum shift credibility (MSC) sets (Fig. S7)—using the ratio of the mean net diversification rate of all branches inside the shifted clade (clade rate) and outside that clade (background rate) to calculate the rate shift magnitude and direction for each MSC set (Table S1). For tree-wide rate shifts, we compared results from TreePar (34) and CoMET (81) (see details in Fig. S5-S6).
Comparisons with fossil genus diversification
To assess the congruence of our molecular phylogeny-based rate estimates with rates estimated from the fossil record, we analyzed Mammalia fossil occurrence data from the Paleobiology Database (30). Grouping by genus after excluding ichnotaxa and uncertain genera, we recovered 71,928 occurrences of 5300 genera, which we then binned in 10-Ma intervals (taxa spanning boundaries go in both bins) and used shareholder quorum subsampling (SQS (82); quorum size: 0.5) to maximize the uniformity of coverage. We then calculated corresponding origination and extinction rates per stage using the per-capita rate method (83).
Likelihood testing for models of diversification
We analyzed the branching times of 27 named subclades (11 orders and 16 suborders) that contained ≥ 25 species. For each subclade, we tested 10 models developed by Morlon et al. (61): two rate-constant (RC) models, constant pure-birth and birth-death; and eight rate-variable (RV) models, with exponentially and linearly time-varying rates. We fit models for 100 trees of the empirical subclades and their matching RC-simulated trees (null models, simulated under the empirical extinction fractions of ~ε=0.65 over 100 trees using the “pbtree” function in phytools (84)). Subtracting AICc scores of the best-fitting RC and RV models provided the ΔAICRC-RV test statistic (85) per tree and subclade for comparison to the simulated null distribution (alpha=0.05; see Table S2).
Time-sliced clades and clade-level tests of species richness variation
To objectively define clades, we arbitrarily drew lines (referred to as “time slices”) at 5-Ma intervals and took the resulting tipward (all the way to the extant tip) monophyletic clades as non-nested units of analysis. The rootward relationships of those clades (the “rootward backbone”) was retained for each interval, giving the expected covariance structure among clades when performing phylogenetic generalized least squares (PGLS) analyses (see Fig. 3 for illustration). We used the “treeSlice” function in phytools to construct clade sets across Mammalia trees and the three sets of RC simulations, empirical (ε=0.65), low (ε=0.2), and high (ε=0.8), also comparing our results to analyses on traditional taxon-based clades (genera, families, and orders; Fig. S10-S12). All PGLS was performed excluding extinct species, using Pagel’s “lambda” transformation in phylolm (optimized for large trees (86)), and repeating the analysis across 100 or 1000 trees. We also performed multivariate analyses including percent of DNA-sampled species per clade to test whether our results are unaffected by imputing DNA-missing species (Fig. S10).
Tip-level tests of speciation-rate correlates
To examine correlative structures underlying observed tip-rate variation, we performed tip-level PGLS analyses between species’ ecological traits and tip DR values across 1000 trees, focusing on a 5675-species data set that excluded all extinct (n=107) and marine (n=129) species. We followed Freckleton et al. (70) in using trait ~ rate models in our tip-level PGLS analyses to avoid identical residuals in the dependent variable (i.e., sister species have identical tip DR values, which otherwise violates the assumed within-variable data independence in bivariate normal distributions). The trait ~ rate approach was previously applied using tip DR in univariate contexts (87) (see Fig. S13-S14 for sensitivity tests).
Clade-level tests of speciation-rate correlates
At the clade level, univariate PGLS was performed typically (rate ~ trait models), since clade tip DR mean gave independent values to sister clades. These analyses were conducted on 1000 trees by analogy with those previous, except that per-clade trait summaries were standardized predictors (mean centered, standard deviation scaled) using geometric means for vagility and arithmetic means otherwise. We also performed tests for trait-dependent speciation using rate-shifted clades identified in BAMM runs on 10 mammal trees (STRAPP (60) method), which corrects for phylogenetic pseudoreplication similar to PGLS except instead via the covariance structure among rate regimes (see Fig. S8).
Phylogenetic path analyses
We performed path analysis aiming to fully resolve correlational structures and thereby translate from the language of statistical association to causality. For phylogenetic path analyses, we used PGLS to test statements of conditional independence (69) across 27 pre-selected path models (Fig. S4). For each tree and clade set, we used “phylopath” (88) to analyze models and perform conditional model averaging. Time-sliced clades at 10-, 30-, and 50-Ma intervals were analyzed and compared to analogous results using taxon-based clades (Fig. S12).
Funding
The NSF VertLife Terrestrial grant to W.J. and J.E. (DEB 1441737 and 1441634) and NSF grant DBI-1262600 to W.J. supported this work.
Author contributions
NSU and WJ conceived the study; NSU and JAE collected and curated the data; NSU performed all analyses and wrote the first draft of the manuscript, with contributions to revisions from all co-authors.
Competing interests
None.
Data and material availability
All data and code is available in the manuscript and after publication on Dryad (also to be available at github.com/n8upham/).
Acknowledgments
We thank I. Quintero, M. Landis, D. Schluter, A. Mooers, A. Pyron, G. Thomas, D. Greenberg, S. Upham and E. Florsheim for conceptual discussions that improved this study; B. Patterson, K. Rowe, J. Brown, T. Colston, T. Peterson, D. Field, T. Stewart, J. Davies, and three anonymous reviewers for comments on earlier drafts; and M. Koo, A. Ranipeta, and J. Hart for database help. Artwork from phylopic.org and open source fonts.
Footnotes
Paper was split in half, with the phylogeny-building components separated out from the main manuscript here, which now focuses solely on the comparative analysis of mammalian evolutionary rates. The other half of the paper is now accepted at PLOS Biology (https://doi.org/10.1371/journal.pbio.3000494). The present manuscript is now in review, with a new Fig 1, additional Fig 3, and revised supplementary information.
References
- 1.↵
- 2.↵
- 3.↵
- 4.
- 5.↵
- 6.↵
- 7.↵
- 8.↵
- 9.
- 10.↵
- 11.↵
- 12.↵
- 13.↵
- 14.
- 15.
- 16.↵
- 17.↵
- 18.↵
- 19.↵
- 20.
- 21.↵
- 22.↵
- 23.↵
- 24.↵
- 25.↵
- 26.↵
- 27.↵
- 28.↵
- 29.↵
- 30.↵
- 31.↵
- 32.↵
- 33.↵
- 34.↵
- 35.
- 36.↵
- 37.↵
- 38.↵
- 39.↵
- 40.↵
- 41.↵
- 42.↵
- 43.↵
- 44.↵
- 45.↵
- 46.↵
- 47.↵
- 48.↵
- 49.↵
- 50.↵
- 51.↵
- 52.↵
- 53.↵
- 54.↵
- 55.↵
- 56.↵
- 57.↵
- 58.↵
- 59.↵
- 60.↵
- 61.↵
- 62.↵
- 63.↵
- 64.↵
- 65.↵
- 66.↵
- 67.↵
- 68.↵
- 69.↵
- 70.↵
- 71.↵
- 72.↵
- 73.↵
- 74.↵
- 75.↵
- 76.↵
- 77.↵
- 78.↵
- 79.↵
- 80.↵
- 81.↵
- 82.↵
- 83.↵
- 84.↵
- 85.↵
- 86.↵
- 87.↵
- 88.↵


