

ABSTRACT
Aggressive and invasive tumor cells often reside in hypoxic microenvironments and rely heavily on rapid anaerobic glycolysis for energy production. This switch from oxidative phosphorylation to glycolysis, along with up-regulation of the glucose transport system, significantly increases the release of lactic acid from cells into the tumor microenvironment. Excess lactate and proton excretion exacerbate extracellular acidification to which cancer cells, but not normal cells, adapt. We have hypothesized that carbonic anhydrases (CAs) play a role in stabilizing both intracellular and extracellular pH to favor cancer progression and metastasis. This is likely in concert with the ion transport family. Here, we examined the patterns of selected ion transporter expression, the mechanisms underlying alterations in glucose metabolism, and pH regulation in human breast cancer cells. Our results show that members of the proton transport family are differentially expressed within the molecular subtypes of breast cancer. The most aggressive form of breast cancer, triple negative breast cancer (TNBC), appears to coordinately express monocarboxylate transporter 4 (MCT4) and carbonic anhydrase IX (CA IX). Proton efflux, as measured by the glycolytic rate assay, showed pH dependence and a requirement for CA IX expression. Isoform selective sulfonamide-based inhibitors of CA IX did not alter proton flux, which suggests activity is not necessary for this regulation. This supports a mechanism that utilizes the intramolecular H+ shuttle system in CA IX to facilitate proton efflux.
Introduction
The tumor microenvironment provides metabolic challenges to tumor cells (1). Intermittent hypoxia, induced by alterations in blood flow, alters expression of genes involved in glucose metabolism through the transcription factor, hypoxia inducible factor 1 (HIF1) (2–4). Cells switch from dependence on oxidative phosphorylation to accelerated glycolysis for their energy production (4). This glycolytic switch increases the production of lactic acid reducing extracellular pH (pHe) (5). Ultimately, this condition becomes imprinted so that it is maintained even in the presence of oxygen, which was described by Otto Warburg nearly 100 years ago and coined the “Warburg Effect” (6–8). Cancer cells that adapt to these conditions proliferate rapidly and are resistant to both radiation and chemotherapy (4). Normal cells in this environment become apoptotic and suffer cell death. This leads to increased space in which cancer cells expand. Thus, the glycolytic phenotype is advantageous for cancer progression and metastasis (3, 4, 8, 9).
To accommodate the increasing concentration of lactic acid inside cells, it has been proposed that proton-specific transporters are induced in cancer cells to normalize intracellular pH (pHi) (5). Indeed, it has been shown that pHi in the cytoplasm of tumor cells (pH 7.2-7.4) is similar to that of normal cells (10, 11). However, the pHe surrounding tumor cells is strongly acidic (pH 6.5-6.8) (11). One of the key players in maintaining the relationship between pHi and pHe in tumor cells is thought to be the monocarboxylate transporters (MCT1 and MCT4) (12, 13). These transporters co-transport lactate with a proton. Other proteins that may participate in pH regulation include the Na+/H+ exchanger (NHE1), the Na+/HCO3- co-transporter (NBCn1) and the vacuolar ATPase (vATPase) (12, 14–18). Additionally, previously published studies performed using glycolytic-deficient cells showed that CO2 might also contribute to acidification of the tumor microenvironment (19, 20). CO2 is itself a weak acid oxide and can react with water to form HCO3- and a H+. This process occurs naturally but is enhanced by as much as 1000-fold by carbonic anhydrases (CAs). CAs are a family of metalloenzymes that consist of seven distinct classes, including the α-CAs which is the only class found in humans (21, 22). The CA isoforms catalyze a reversible reaction regulate HCO3- and protons that leads to the pH differential across the membrane of cancer cells. In the first of two independent stages, CO2 undergoes hydration within the active site to form a Zn-bound bicarbonate, which is subsequently exchanged for H2O releasing the bicarbonate (Equation 1). In the second stage, the Zn-bound water is deprotonated regenerating the Zn-bound hydroxyl (Equation 2). This second step is regulated by the proton shuttle histidine (His) residue, which has an “in’ and an “out “confirmation.


The α-class of CAs consists of twelve catalytically active isoforms that differ in tissue distribution and subcellular localization (23). Of the human isoforms, only membrane bound carbonic anhydrase IX (CA IX) and carbonic anhydrase XII (CA XII) have been linked to cancer (10, 23). Both isoforms display their catalytic domains from the exofacial side of the plasma membrane (22). More attention has been placed on CA IX, as this isoform is upregulated by hypoxia, is associated with more aggressive forms of cancer, and is predictive of worse patient outcome (24–27). There is evidence that CA IX forms functional interactions with specific ion transporters accelerating their activity (24, 28, 29). It is also hypothesized that CA IX forms a metabolon with these transporters and CA II to maintain the glycolytic phenotype by ‘cycling’ substrates between tumors cells and the microenvironment to regulated pHi (10, 16, 23, 24, 28–30). Our lab, and others, have hypothesized that CA IX serves to regulate pHe by responding to changes in substrate concentration (10, 19, 20). As pHe decreases, CA IX sequesters protons in the form of CO2 and H2O through the dehydration reaction (26, 31). As pHe increases CA IX produces HCO3- and H+ via the hydration reaction (26). Overall, this adjusts the pH to ~6.8. Exciting new data in the tumor setting supports this hypothesis, leading to the idea that CA IX serves as a pH-stat within the tumor microenvironment providing a survival and metastatic advantage to cancer cells that adopt the glycolytic phenotype (32). This role also prevents over-acidification, which could lead to the death of both normal and cancer cells (32).
Previous work has shown that the MCT transporters interact with CA IX (24, 29). Expression of CA IX increases MCT transport activity by a non-catalytic mechanism involving the H+ shuttle mechanism mediated by His200 (24, 29). This residue is analogous to His64 in the ubiquitous, cytosolic CA II isoform (33, 34). We wondered if expression patterns of proton transporters, across cancer cells, would influence the ability of CA IX (or CA XII) to enhance proton efflux. To test this hypothesis, we first determined the effect of hypoxia on common ion transporters in cell models of breast cancer, including both triple negative (TNBC) and ER-positive luminal phenotypes. Our results show differential expression between and within different molecular subtypes of breast cancer cells most of which were insensitive to hypoxia. Knockdown of neither CA IX nor CA XII influenced ion transporter expression. We then assessed proton efflux using the Glycolytic Rate Assay method developed by Seahorse. These results showed that TNBC cells were significantly more glycolytic than control cells or ER-positive luminal breast cancer cells. Surprisingly, CA expression had little effect on lactate production. However, CA IX expression, and extracellular pH, did influence proton excretion rates leading to enhanced acidification of the extracellular environment. These data support a role for CA IX, but not CA XII, in proton export.
Results
Proton transporter expression is associated with survival in breast cancer patients
Breast cancer patient survival is often predicted by gene expression patterns. To determine if expression of ion transporters has predictive value; we examined publicly available microarray data accessible through the Kaplan-Meier database (kmplot.com/analysis/). We used the web tool developed by Lanczky et al. to query these databases (35). Figure 1 shows that overexpression of V-ATPase (Figure 1A) is a positive prognosticator across all breast cancer subtypes. Overexpression of NHE1 also predicts better outcomes (Figure 1B). In contrast, MCT1 overexpression is associated with decreased survival (Figure 1C). Relative to MCT1, overexpression of MCT4 is a much stronger predictor of poor patient survival (Figure 1D). These data show, at least at the mRNA level, differences in proton transporter expression do have predictive value for patient outcome.

Kaplan Meier plots in all breast cancer patients. mRNA from all breast cancer patients (unrestricted analysis) was probed for proton transporters. A) Expression of ATP6V0A1 gene subunit, a component of the vATPase protein, was probed for using Affimetrix ID 212383_at. B) The gene that encodes the NHE1 protein, SLC9A1, was probed for using Affimetrix ID, 209453. C) SLC16A1 (encodes MCT1 protein) was probed for using Affimetrix ID, 202235_at. D) The SLC16A3 gene, which encodes the MCT4 protein, was probed for using Affimetrix ID, 202856_at.
Proton transporters are differentially expressed in breast cancer cells and tissue
An important feature of cancer cells is the overexpression of transporters, which are important for maintenance of the glycolytic phenotype (4). Therefore, in this section, we compared protein expression of a specific set of transporters including V-ATPase, NHE1, and MCT 1/4 in selected breast cells lines, with differential CA IX and XII expression (Figure 2A). These data show that transporter expression varies among cell lines and under different conditions. We examined two luminal ER-expressing cell lines: T47D and MCF7. The T47D cells displayed strong V-ATPase and NHE1 protein expression. Neither transporter showed sensitivity to hypoxia. These cells showed exclusive expression of CA XII, which was not induced by hypoxia (Figure 2A). In contrast, the MCF7 cells showed low V-ATPase and MCT1 expression, as well as low expression of CA XII and inducible CA IX expression (Figure 2A). The TNBC cell lines, UFH-001 and MDA-MB-231 also showed variations in ion transporter expression. In UFH-001 cells, but not MDA-MB-231 cells, there was strong MCT1 and MCT4 expression with limited sensitivity to hypoxia (Figure 2A). In our hands, only the UFH-001 cells expressed CA IX, which was significantly upregulated by hypoxia (26, 27). The control, MCF10A, cells showed little proton transporter expression but did exhibit hypoxic-dependent expression of CA IX protein (Figure 2A).

Cell specific protein expression of transporters in TNBC and luminal breast cancer cell lines and tumor grafts. A) Breast cell lines were grown to ~75% confluency and then exposed to normoxic (N) or hypoxic conditions (H, 1% O2 for 16 h). After 16 h, the cells were rinsed with PBS and lysates extracted using RIPA buffer containing protease inhibitors. Equal concentrations of protein were loaded onto SDS PAGE gels, and then transferred to nitrocellulose for western blot analysis. B) Frozen tissue samples from UFH-001 derived xenografts (#1 and #2) and patient derived tumorgrafts (#3 and #4) were homogenized in RIPA buffer containing proteinase inhibitor, resolved on a 10% SDS-PAGE gel and then transferred to nitrocellulose for western blot analysis. C) UFH-001 and T47D empty vector (EV) controls as well as their respective CA IX knockout and CA XII knockdown were cultured and then exposed to either N or H (16 h). After which cell lysates were collected and equal volumes of proteins loaded onto SDS PAGE gels for western blot analysis. Membranes were probed for CA expression (CA IX, CA XII and CA II), and transporter expression (V-ATPase, NHE1, MCT1, MCT4 and GLUT-1). GAPDH was used as a loading control.
An RNA sequencing experiment using the UFH-001 cells under normoxic and hypoxic conditions support the protein expression data. Hypoxia shows a distinct transcriptional profile based on heat map comparisons to normoxic conditions (Figure 3A). On inspection, we used information specific to the ion transporters and CA family members. Specifically, very few transcripts of NHE1 and V-ATPase were detected and expression of neither was sensitive to hypoxia (Figure 3B). MCT1 and MCT4 showed higher gene expression than NHE1 and vATPase. Only MCT1 transcription was significantly upregulated by hypoxia (q value = 0.0013). Also, of note is the strong transcription of CA IX and CA II. Hypoxia increased CA IX transcription by over 5-fold (q value = 0.0013), while CA II transcription decreased but not significantly (q value = 0.0817) (Figure 3B). CA XII gene expression was extremely low (Figure 3B), which correlates with undetectable CA XII protein (Figure 2A). However, hypoxia increased CA XII transcription by nearly 3-fold (q value = 0.0013). The complete data set for these RNA seq data has been deposited in the GEO repository (accession number GSE123856).

RNA sequencing support protein expression data. A) A heat map was generated from a list of 623 differentially expressed genes (DEG) that had a log2 fold change > 1 and FDR (q-value) ≤ 0.05. Color key is shown separately. Red represents upregulated genes; green represents downregulated genes. B) FPKM values are represented for the ion transporters of interest, along with three members of the carbonic anhydrase family. C) FPKM values for two of the glucose transporter family: GLUT1 and GLUT3. * represents q ≤ 0.05 for hypoxia vs normoxia.
To determine if transporter expression was affected by the presence or absence of membrane bound CAs, we utilized RNAi strategies to knockdown CA IX expression in the UFH-001 cells and CA XII in the T47D cells (Figure 2B). We chose these cells because of their specific expression of CA IX and CA XII, respectively. When compared to empty vector (EV) controls, our data showed that knockdown of CA IX or XII expression had little effect on the expression of proton transporters. In this experiment, we also probed for CA II expression (Figure 2B). This revealed that UFH-001 cells have high levels of CA II relative to T47D cells, which have little to no expression. CA II expression is not under the influence of hypoxia and is also unaffected by CA IX knockdown.
To evaluate whether these same proton transporters play a role in vivo, we generated xenografts (UFH-001, duplicate tumors #1 and #2, Figure 2C) and TNBC patient derived tumor grafts (PDX) (HCl-001 duplicate tumors, #3 and #4, Figure 2C). In UFH-001 xenografts, both isoforms of MCT were expressed, although MCT4 expression patterns were higher relative to MCT 1. NHE1 expression was variable, and there was a total lack of V-ATPase. CA IX expression was also variable, but CA II expression was consistent between tumor samples and UFH-001 cells. In the PDX model, there was also strong MCT4 expression, but essentially no MCT1. NHE1 was present while V-ATPase was not observed. CA IX and CA II expression was again high. It is noteworthy that MCT1 is missing in the PDX model (Figure 2C). We have been unable to grow tumors from the T47D cells so were unable to compare the expression pattern of xenografts with a luminal PDX model so did not pursue this approach.
CA IX expression enhances proton efflux in triple negative UFH-001 cells
Cells in culture exhibit increased glycolysis perhaps because they have an unrestricted source of glucose. Cancer cells also exhibit increased glucose uptake and enhanced glycolytic rates as part of the glycolytic switch (4). This is due, in part, by increased expression of GLUT1, which consequently increases glucose uptake into the cell (36). In this section, we utilized both glucose transport and glycolytic rate assays to determine the glycolytic phenotype in UFH-001 and T47D cells (Figure 4). Using a traditional glucose transport assay, we measured uptake of [3H]2-deoxyglucose which is trapped as [3H]2-deoxy-6-glucose phosphate. Figure 4A demonstrates that glucose transport in UFH-001 cells was greater than that observed for MCF10A and T47D cells. Even when CA IX is knocked out in these cells (in this case by a Crispr strategy), glucose uptake, although slightly decreased, was not significantly affected (Figure 4A). This slight decrease in glucose uptake may reflect GLUT1 protein expression (Figure 4B). Transport activity in T47D cells was significantly lower than UFH-001 cells, which is consistent with reduced expression of GLUT1. Despite robust expression of GLUT1 in the control MCF10A line, transport activity was also lower than that of the UFH-001 cells. Hypoxia increased both glucose uptake and GLUT1 expression in all cell lines.

Glucose transport and GLUT1 expression in breast cancer cells. A) Deoxyglucose uptake was assessed in breast cell lines under normoxic conditions or 16 h of hypoxia. B) CA and GLUT1 expression were probed for in lysates isolated for the same cell lines in Panel B, Normoxia = N and hypoxia = H, GAPDH was used as a loading control.
The glycolytic rate assay (Seahorse Biosciences) was used to determine proton excretion rates from glycolysis (GlycoPER) of the breast cancer cell lines relative to the MCF10A cells (Figure 5). This assay measures both extracellular acidification rate (ECAR) and oxygen consumption rate (OCR). ECAR represents proton production from glycolysis and OCR represents oxygen consumption by oxidative phosphorylation. Cells are provided glucose at the start of the experiment and then treated with a cocktail containing rotenone/antimycin (Rot/AA) to block oxidative phosphorylation and then deoxyglucose (DG) to block glycolysis. Raw data are shown in Figures 5A and 5B. Figures 5C and 5D represent the calculated rates that account for the contribution of CO2 to extracellular acidification derived from mitochondrial activity. The resulting value, GlycoPER, is the rate of protons extruded into the extracellular medium from glycolysis. This assay also allows for the measurement of changes in the rate of glycolysis, in real-time. For hypoxic cells, 100 μM desferroxamine mesylate (DFO) was added during the glycolytic rate assay to mimic the effect of hypoxia. CA and ion transporter expression, in the presence of DFO, were comparable to those observed under hypoxic conditions (Supporting Figure 1).
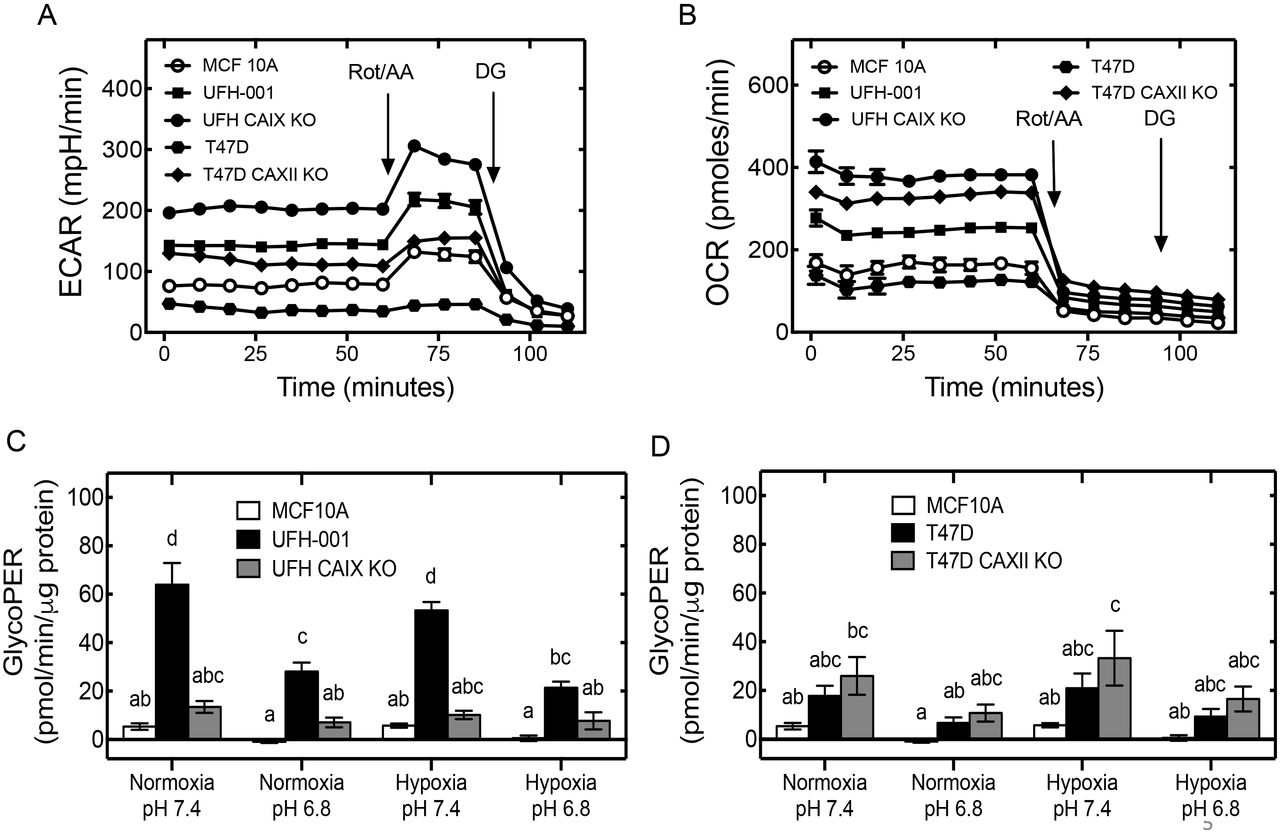
The glycolytic phenotype in breast cancer cells. A) Extracellular acidification rate, ECAR and B) oxygen consumption rate (OCR) were determined in MCF10A, UFH-001, T47D and the respective KO cells after sequential compound injections. Rot/AA (rotenone and antimycin cocktail) and DG (deoxyglucose). Proton extraction rate from glycolysis (GlycoPER) was assessed in C) UFH-001 empty vector control (EV) and CA IX KO versus MCF10A cells and in D) T47D empty vector control (EV) and CA XII KO cells versus MCF10A cells, under different conditions.
Results for the glycolytic rate assays show that the UFH-001 cells have significantly higher GlycoPER (proton efflux) when compared to the MCF10A cells, under all tested conditions (Figure 5C). These conditions include the chronic exposure to normoxic and hypoxic treatment, and acute exposure to physiological pH (7.4) and the pH that is observed in hypoxic tumors (6.8). CA IX knockout significantly reduced GlycoPER relative to UFH-001 cells under all but one condition (hypoxia at pH 6.8). pH had an independent effect on GlycoPER. Low pH reduced GlycoPER in UFH-001 cells relative to pH 7.4 under both normoxic and hypoxic conditions. The GlycoPER pattern in T47D cells was strikingly different (Figure 5D). In fact, there was little statistical significance across the conditions, although an upward trend in CA XII knockout cells relative to control T47D cells was observed. However, the GlycoPER rate in UFH-001 cells was 2-3 times higher than that in T47D cells except for the hypoxic, pH 6.8 condition (compare Figure 5C with 5D). GlycoPER in CA IX knockout cells (UFH-001) was not significantly different from that of CA XII knockout cells (T47D). Overall, these data suggest that CA IX expression does not affect glycolytic activity directly but does contribute to extracellular acidification.
CA catalytic activity is not required for glucose uptake and decreased glycolytic rate in breast cancer cells
Ureido substituted benzene sulfonamides (USBs) have been shown to potently inhibit CA IX and CA XII activity, over the off target cytosolic and ubiquitously expressed CA II, using stop flow kinetics (SFK) of purified recombinant proteins (33, 37). More recently, we have shown that these same inhibitors selectivity target and inhibit CA IX activity over CA XII in the context of “intact” breast cancer cells, using membrane inlet mass spectrometry (MIMS) (38). We used these inhibitors (Supporting Figure 2A) to determine if the reduction of GlycoPER in CA IX KO cells (Figure 5C), relative to the control UFH-001 cells, was related to its enzymatic activity. This does not appear to be the case, as the inhibitors did not affect the rate of GlycoPER under either normoxic or hypoxic conditions (Supporting Figure 2B). Glucose transport rates were not affected either (Supporting Figure 2C). The same was true for glucose transport activity in T47D cells (Supporting Figure 2D). These data show that inhibition of CA IX or CA XII activity, using USB compounds, does not influence glucose uptake or proton efflux, at pH 7.4.
CA expression does not affect extracellular lactate concentrations in breast cancer cells
In normal cells glucose is converted, via multiple steps in glycolysis, to pyruvate which in turn is converted to either lactate (in the absence of oxygen) in the cytoplasm or (ultimately) to CO2 and water (in the presence of oxygen) in the mitochondria. The conversion of glucose to lactate, as a result of enhanced glycolytic rates, leads to a net increase in lactate production and excretion from the cytosol to the extracellular environment. Based on GLUT1 expression and glucose uptake (Figure 4), and GlycoPER (Figure 5), we would expect higher lactate production in the UFH-001 cells relative to T47D cells. However, this was not the case (Figure 6). Lactate production in UFH-001 and T47D cells was essentially the same under normoxic conditions (Figure 6A). That said, both cell types produced more lactate than did the normal MCF10A cells. When the cells were exposed to 16 h of hypoxia, lactate levels in UFH-001 cells increased relative to its normoxic control although this did not reach significance (Figure 6A). Extracellular lactate concentrations in hypoxic T47D cells did not change relative to the normoxic controls. Ablation of neither CA IX in UFH-001 cells nor CA XII in T47D cells affected extracellular lactate levels (Figure 6A).

Lactate concentrations in breast cancer cells. A) Lactate concentration was assessed in breast cell lines under normoxic conditions or 16 h of hypoxia. Lactate concentration was assessed in B) UFH-001 empty vector control (EV) and CA IX KO versus MCF10A cells and in C) T47D empty vector control (EV) and CA XII KO versus MCF10A cells, under normoxic conditions or 16 h of hypoxia plus an addition 3 h in the presence of DFO (100 μM) and different pH values.
We also determined if changes in pH affected extracellular lactate concentrations in our cell lines (Figures 6B and 6C). To replicate the protocol used for the GlycoPER assays, we first exposed cells to either normoxic or hypoxic conditions for 16 h. Then, cells were washed and exposed additionally to normoxic conditions or in the presence of the hypoxic mimic, DFO, for 3 h at different pH values. Our results showed that UFH-001 cells trended toward higher levels of extracellular lactate when exposed to hypoxia, relative to normoxia, but that no difference was detected between cells cultured at physiological pH (7.4) versus those cultured under low pH (6.8) conditions (Figure 6B). Once again, ablation of CA IX had no significant effect on lactate levels during the 3 h period. Lactate concentrations in the medium from T47D cells were significantly higher than that of MCF10A cells under all conditions (Figure 6C). However, neither hypoxia nor pH affected lactate concentrations. Together, these data show that neither CA IX nor CA XII expression, nor pH, had any significant effect on the amount of lactate exported by the cancer cells.
CA IX expression influences pHe of breast cancer cells
Acidification of the tumor microenvironment is another typical feature of highly glycolytic tumor cells (3, 8). The conversion of glucose to lactate, as a result of enhanced glycolysis, not only increases in the production and export of lactate, but also protons. Consequently, this leads to deceases in pHe, which favors tumor growth and metastasis (8). In this section, we studied the effects of initial pHe on a time-dependent end point pH in UFH-001 and T47D cells (Figures 7 and 8). In Figure 7, we measured pHe in UFH-001 EV, and UFH-001 CA IX KO cells under normoxic or hypoxic conditions in comparison to MCF10A cells, where the initial pH is indicated on the x-axis and the final pH is viewed on the y-axis. These experiments were performed in HCO3- free medium to avoid buffering effects. Our results show that the medium pH for MCF10A cells remained similar over the 24 h period, even when cells were exposed to low pH conditions and/or under hypoxic conditions (Figures 7A-7C). For the most part, medium pH values for UFH-001 cells with or without CA IX were significantly higher than that of MCF10A cells, under both normoxic and hypoxic conditions (Figure 7A). At 16 h of incubation, the difference in hypoxic UFH-001 cells compared to MCF10A cells is lost. However, the knockdown cells still have significantly higher pHe values related to the MCF10A cells (Figure 7B). Over the 24 h time course, we detected a downward trend in pHe in all UFH-001 cells under all conditions (Figure 7A-7C). At 24 h the most striking effect was the significant decrease in pHe under hypoxic conditions in the normal UFH-001 cells at both starting pH values (Figure 7C). Knockout of CA IX reversed that trend (Figure 7C). This suggests that CA IX expression contributes to acidification of the medium.
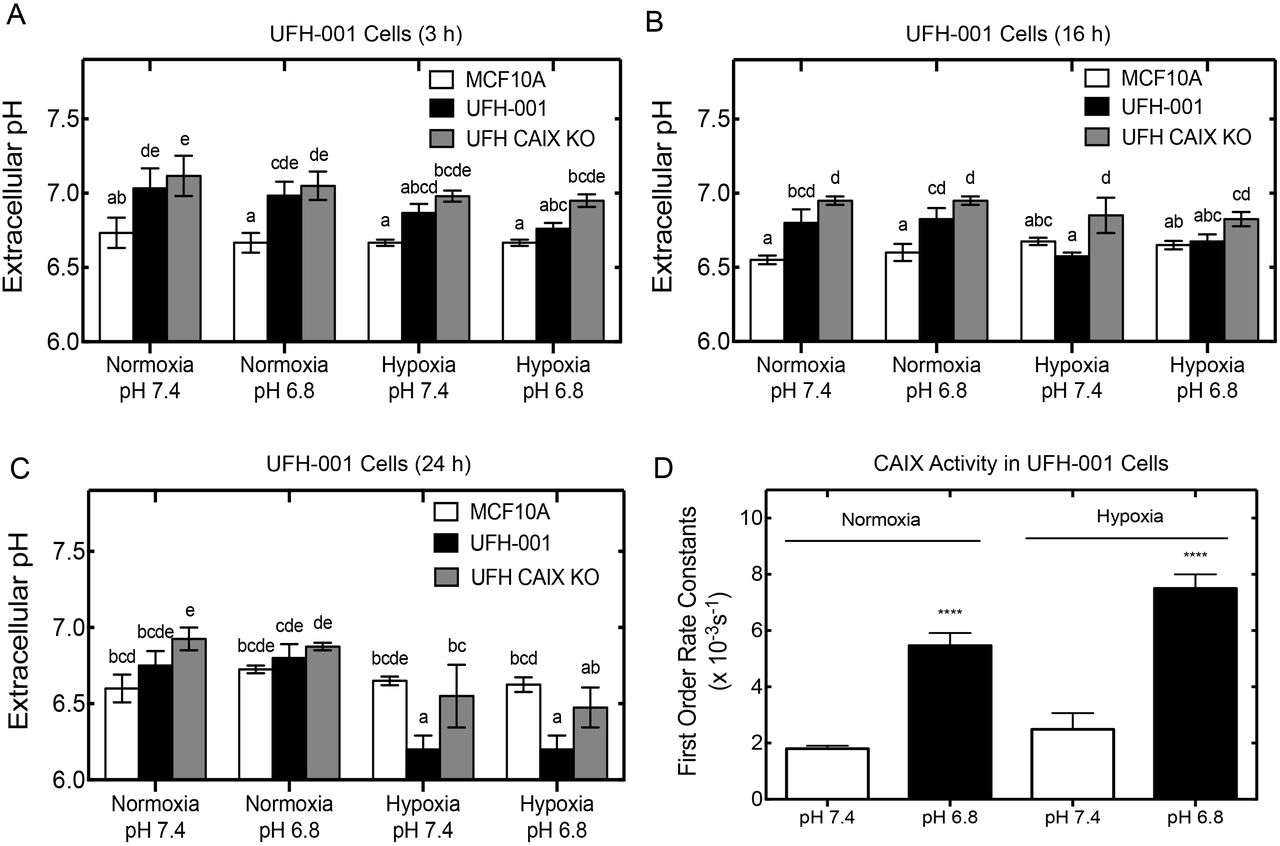
Comparison of pHe measurements in breast cancer cell lines. MCF10A, UFH-001 empty vector control and CA IX KO cell lines were allowed to grow in 35 mm dishes until they reached 50-75% confluence. After which, the medium was changed and bicarbonate free DMEM was added. Cells were then exposed to different conditions for a duration of A) 3 h, B) 16 h and C) 24 h. At each time point, pH of the medium was measured using a pH meter and presented as pH/plate of cells. D) CA IX activity under low (6.8) or physiological (7.4) pH and normoxic or hypoxic conditions was measured using the MIMS assay and first order rate constants calculated. ***p < 0.001.

Comparison of pHe measurements in breast cancer cell lines. MCF10A, T47D empty vector control and CA XII KO cell lines were allowed to grow in 35 mm dishes until they reached 50-75% confluence. After which, the medium was changed and bicarbonate free DMEM was added. Cells were then exposed to different conditions for a duration of A) 3 h, B) 16 h and C) 24 h. At each time point, pH of the medium was measured using a pH meter and presented as pH/plate of cells. D) CA XII activity under low (6.8) or physiological (7.4) pH and normoxic or hypoxic conditions was measured using the MIMS assay and first order rate constants calculated. ***p < 0.001.
We also performed activity studies using our MIMS assay (31) and the results show that CA IX activity increased as pHe decreased (Figure 7D). We have shown that this increase in activity is due to a shift from the hydration to the dehydration direction. We have also previously shown that recombinant CA IX, but not CA II nor CA XII, is folded and active at pH values as low as 3.0. We repeated the pH experiment with the T47D cells. These cancer cells also initially displayed significantly higher pHe values than the MCF10A cells at both high and low starting pH, whether exposed or not to hypoxic conditions (Figure 8A). By 24 h (Figure 8C), the significant difference, observed at both 3 h (Figure 8A) and 16 h (Figure 8B), diminished. Unlike the UFH-001 cells, there was no decrease in pHe in T47D cells with or without CA XII expression under hypoxic conditions (compare Figure 8C with Figure 7C). Yet, low pH increases CA XII activity although the activity only increases by about 50% compared to the 2.5-fold increase in UFH-001 cells (Figure 8D). Taken together, these results show that CA IX, but not CA XII, contributes to extracellular acidification in breast cancer cells.
Discussion
Our studies show that members of the ion transport family are differentially expressed in breast cancer cells (Figure 2). The transport function of MCT4 favors lactate export and appears to be preferentially expressed in the aggressive, UFH-001 cells, which exhibit the TNBC phenotype, and whose expression is preserved in the UFH-001 xenografts and PDX (TNBC) model. The UFH-001 cells also express MCT1, but its expression is reduced in UFH-001 xenografts relative to MCT4 and is absent in the triple negative PDX model. In contrast, it appears that the V-ATPase is associated with luminal breast cancer and CA XII expression. Kaplan Meier data from all breast cancer patients show that MCT4 expression is associated with poor patient outcome, while V-ATPase is associated with better prognosis, consistent with the differential expression shown in our study (Figure 1). Others have shown that the MCF7 line expresses MCT1, which favors lactate import, which we have confirmed here, although the expression is significantly lower than in the UFH-001 cells (Figure 2). Lee et al. have shown that increased lactate levels are associated, in vivo, with overexpression of CA IX (32). The UFH-001 cells endogenously express CA IX and high levels of extracellular lactate, although hypoxia does increase both CA IX expression and lactate production (Figure 6). Yet, knockdown of CA IX does not affect extracellular lactate levels under either normoxic or hypoxic conditions. It is noteworthy that neither MCT1 nor MCT4 protein expression is particularly sensitive to hypoxia, although there is a significant 2.3-fold increase of MCT1 at the transcriptional level. Lee et al. also showed that most of the increases in total lactate levels in the tumor setting resulted from intracellular lactate accumulation, with no difference in extracellular lactate concentrations between cells in which CA IX was overexpressed compared to controls (32). Perhaps these data explain the lack of observable difference in extracellular lactate levels between our CA IX expressing UFH-001 cells and those in which CA IX expression was ablated. The T47D line expresses little MCT1 or MCT4 yet extracellular lactate concentration is surprisingly similar to that of the UFH-001 cells. Perhaps, these cells express one of the other MCT family members (12).
The glycolytic rate assay revealed that CA IX expression is associated with high rates of proton export relative to either the control MCF10A cells or the T47D cells at pH 7.4 (Figure 5). Because MCT1 and MCT4 are the only ion transporters overexpressed in the UFH-001 cells, it is likely that they are responsible for both lactate and proton transport. Catalytically, CA IX at pH 7.4 might be expected to participate in extracellular proton production (19, 20, 26, 32, 38). Yet, USB inhibition of CA IX’s catalytic activity did not alter proton flux (Supplemental Figure 2). That said, CA IX knockdown significantly decreased proton flux (Figure 5). Glycolytic flux and pH regulation are likely connected. Our studies show that CA IX in UFH-001 cells, in the absence of a buffering system under normoxic conditions, both reduces and stabilizes pH at ~6.8 over time. Under hypoxic conditions, where CA IX activity is substantially increased, pHe drops significantly (Figure 7). This phenotype is partially rescued by CA IX ablation. These data support the studies of Swietach et al. and Lee et al. who have shown that the pHe of CA IX expressing spheroids and tumors is much lower than observed for controls (19, 20, 32). Together, these data provide evidence that CA IX does participate in acidification and pH control of the tumor microenvironment. Thus, CA IX acts as a pH-stat that sets an acidic microenvironment, which can be tolerated by cancer cells both in vitro and in vivo (19, 20, 32).
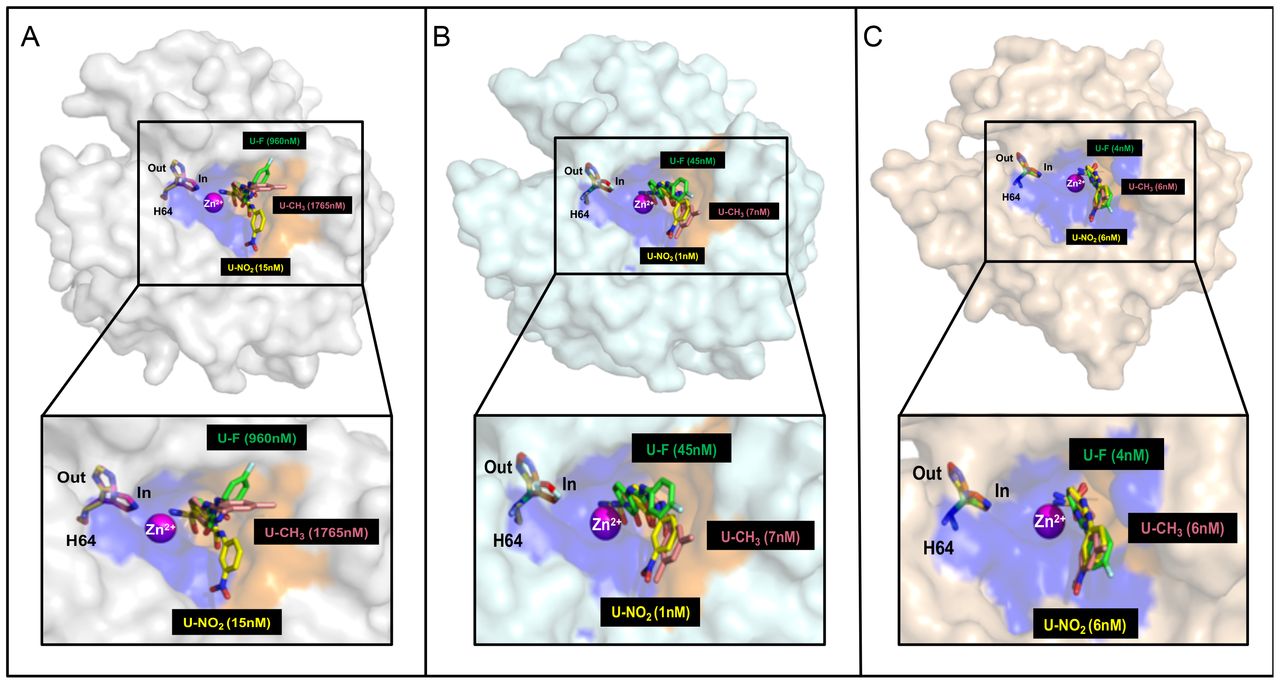
However, our data, and those of others, question the role of catalytic activity in pH control. Jamali et al. have demonstrated that CA IX augments MCT1 and MCT4 transport activity, but not expression, the latter of which is corroborated by our studies (24). They also proposed that the effect of CA IX on MCT function occurred via a non-catalytic mechanism (24). They showed that the histidine involved in proton shuttling in CA IX (Equation 2) is important in collecting intracellular protons and to accelerate their export through MCT. In CA IX, this histidine is found at position 200 (24). The CA isoform that has been well studied, CA II, has this histidine at position 64 (34). We have used the CA II numbering system to show the position of this histidine in structural models of CA II (Panel A), CA IX (Panel B), and CA XII (Panel C) (Figure 9). It is clear that this histidine occupies a separate space (the hydrophilic side of the catalytic pocket) from the USB inhibitors (binding in the hydrophobic pocket), suggesting that the proton transport function of this residue can act independently from the hydration/dehydration reaction (Equation 1). Thus, CA IX could sequester protons through this “antenna” and pass them on to the MCT transporters as suggested by the Becker group (24, 29). CA IX also contains a unique proteoglycan (PG) domain, which is negatively charged. Ames et al. have shown that the PG domain also facilitates MCT transport activity (29). The PG domain is absent from CA XII which may underlie our observation that the T47D cells, which express only CA XII, does not influence proton efflux, even though CA XII contains an analogous His64 (at position 94) (22). This may suggest that the PG domain plays an important role in proton-coupled lactate transport in cancer cells.

USBs bound in the active site of CAs. Surface representation of compounds U-CH3 (pink), U-F (green) and U-NO2 (yellow) in complex with monomers of CA II (gray), the CA IX-mimic (cyan), and modeled into the active site of CA XII (wheat). Catalytic zinc (magenta sphere) and His64 (H64, mutilcolored, in and out positions) are also shown. CAII numbering is used in these structural models. The analogous histidine in CA IX is at position 200, and at position 94 in CA XII.
Overall, the fact that CA IX knockdown, but not inhibition of CA IX catalytic activity, affects proton flux leads us to support the model that emphasizes the importance of the proton shuttle activity of His200 located in catalytic domain of CA IX and the PG domain, which is the unique extension of CA IX (39). In both cases, it is His200 and the PG domain that facilitate proton transfer to the monocarboxylate transporters (MCT1 and MCT4) to enhance proton-dependent lactate flux. To be a more effective therapeutic tool, we speculate that the design of CA IX-specific inhibitors within the catalytic site must also interfere with the proton shuttling activity of His200.
Experimental Section Cell culture and hypoxia
The MCF10A cells were plated at a density of 20,000 cells/mL in 10 cm dishes, and cultivated in in DMEM/Ham’s F12 medium, supplemented with 5% horse serum (Sigma Aldrich), 10 μg/mL insulin, 20 ng/mL epidermal growth factor (EGF) (Upstate Biochem) and 100 ng/mL dexamethasone (Sigma). T47D cells were plated in 10 cm dishes at 20,000 cells/mL and maintained in McCoys 5A medium supplemented with 10% FBS and 10 μg/mL insulin. MCF7 cells, plated in 10 cm dishes at 20,000 cells/mL, were maintained in DMEM supplemented with 10% FBS and 0.01 μM estrogen (Sigma Aldrich). UFH-001 and MDA-MB-231-LM2 cells were plated in 10 cm dishes at a density of 10,000 cells/mL and maintained in DMEM supplemented with 10% FBS. All cell lines were maintained at 37 °C in humidified air with 5% CO2. Experiments were conducted when cells achieved ~70% confluency, unless otherwise specified. For hypoxia treatment, cells were placed in humidified Billups Rothenberg Metabolic Chambers and exposed to 1% O2, 5% CO2 and balanced N2 for designated times 37 °C. Desferoxamine mesylate (DFO) is an iron chelator that mimics hypoxia. For DFO treatment, a 10 mM stock was prepared in dH2O and filter sterilized. A final concentration of 100 μM DFO was used. All cell lines were authenticated and validated.
RNA sequencing analysis
UFH-001 cells were exposed to either normoxic or hypoxic conditions (16 h). RNA isolated from these cells was checked for integrity using the Agilent Bioanalyzer 2100 system (Agilent Technologies, Santa Clara, CA) and quantified using a Qubit fluorometric assay (Thermo Fisher Scientific, Waltham, MA). Poly-A enriched mRNASeq libraries were prepared following Illumina’s TruSeq Stranded mRNA LT library preparation protocol (Illumina Inc., San Diego, CA) using 1 μg of total RNA. All samples were individually barcoded and quantitated with the KAPA Library Quantitation Kit for Illumina Platforms (Kapa Biosystems, Wilmington, MA) in conjunction with an Agilent Bioanalyzer DNA 1000 analysis (Agilent Technologies, Santa Clara, CA) for fragment size determination. The average fragment size was approximately 300 bp. 1.8 pM of the pooled libraries with 1% PhiX spike-in was loaded on one NextSeq 500/550 75 cycle High Output Kit v2 sequencing flow cell and sequenced on the Illumina NextSeq 500 sequencer. Filtered reads were mapped onto the Homo sapiens genome (Homo_sapiens.GRCh38.82) using Tophat2 v2.0.13, and processed by Cufflinks (v.2.2.1) for transcript abundance estimation and pairwise differential expression gene (DEG) analysis (40, 41). A total of 1,487 genes were upregulated and 1,459 genes were down regulated (p-value ≥ 0.05, Fold Change (FC) ≥ 1 and log2FC ≥ 0). A heat map was generated from a list of 623 DEG that had a log2 fold change > 1 and FDR (q-value) ≤ 0.05 using heatmap.2 in R. Individual FPKM (Fragments Per Kilobase per Million reads) expression values were used to investigate the transcriptional effect of hypoxia on key transporters and CA genes. An FDR (q-values) ≤ 0.05 was considered significant.
Xenograft and tumor graft models
All procedures were conducted in accordance with the NIH regulations and approved by the University of Florida IACUC. Both xenografts and a PDX model were used for the in vivo identification of proton transporters. For xenografts, a total of UFH-001-Luc cells were suspended in culture medium and injected into the 4th mammary gland of NOD/SCID mice (Jackson Laboratory), aged around 10-12 weeks old. The TNBC-derived tumor grafts were generated from cryo-preserved tissue (HCl-001, originally developed in the Alana Welm lab, also injected into the 4th mammary gland of NOD/SCID mice (42). When tumor volume reached 500 mm3, the mice were sacrificed, and dissected tumor was homogenized in RIPA buffer, containing protease inhibitor (Sigma Aldrich), using an Omni homogenizer. Protein concentrations were determined by the Markwell modification of the Lowry method and used to determine protein loading for SDS-PAGE analysis (43).
Preparation of cell lysates and western blot analysis
Cells were washed 3x with ice-cold phosphate buffered saline [PBS, 120 mM NaCl, 2.7 mM KCl, 10 mM NaH2PO4.H2O and 10mM Na2HPO4 (pH 7.4)] and then exposed to RIPA buffer supplemented with protease inhibitor for 15 min on ice. Cell lysates were then scraped from the plates and clarified by centrifugation at 55,000 rpm for 60 min at 4°C. The clarified supernatants were collected and stored for protein analysis. Proteins were separated by SDS-PAGE and visualized using immunoblotting. Images were scanned and cropped (Adobe Photoshop version 11) for proper illustration of results.
Knockdown and deletion of CA expression
LentiCRISPR v2 was used to knockout CA IX expression in UFH-001 cells as previously described (27). GFP expression was monitored to confirm efficiency of transduction. Stably transduced UFH-001 and T47D cells were established by puromycin (2 μg/mL) selection (Sigma Aldrich). CA IX knockout and CA XII knockdown were confirmed by western blotting.
Glucose transport assay
Glucose transport activity was measured according to previously published methods (44). For these experiments, we plated MCF10A and T47D cells, along with CA IX KO (UFH-001) cells and CA XII KO (T47D) cells at a density of 30,000 cells/35 mm plate. UFH-001 cells were plated at 10,000 cells/plate. At 50-75% confluency, the cells were divided into two groups. The control group was incubated under normal culture conditions, while the second group was exposed to 16 h of hypoxia. Cells were equilibrated in KRP buffer for 10 min at 37°C. Cells were then exposed or not to 40 μM cytochalasin B (a glucose transporter specific inhibitor that provides non-specific uptake), from a stock dissolved in DMSO for 10 min. This was followed by 10 min incubation with 0.2 mM [3H]-deoxyglucose. The reaction was terminated when cells were washed with ice-cold PBS and air dried at room temperature. To quantify radioactivity, the cells were lysed in 0.1% SDS and counted by scintillation spectrometry. Rates are presented as the concentration of [3H]-deoxyglucose uptake per min per plate.
Glycolytic rate assay
MCF10A (5,000 cells/well), UFH-001 (2,500 cells/well) and T47D (10,000 cells/well) as well as the respective, CA IX KO (4,500 cells/plate) and CA XII KO (10,000 cells/plate) cells were seeded in 96 well plates and allowed to grow for 3 days. On day 3, medium was changed, and cells exposed to 16 h of hypoxia. On the day of the experiment, now day 4, cell culture medium was replaced with the glycolytic rate assay medium (XF Base Medium without phenol red plus 2 mM glutamine, 10 mM glucose, 1 mM pyruvate and 5 mM HEPES). For hypoxic cells, 100 μM DFO was added to the glycolytic rate assay medium. These cells were then incubated for 1 h in the absence of CO2 and transferred to the Seahorse XF96 extracellular flux analyzer (Seahorse Bioscience). If present, ureido substituted benzene sulfonamide inhibitors (USBs) (5 μM), dissolved in assay medium, were administered via the first injection port for acute treatment. A rotenone/antimycin cocktail (Rot/AA) and deoxyglucose (DG) were placed in the second and third ports, respectively, and added sequentially during the assay. Glycolytic rate was measured according to the manufacturer’s instructions and results analyzed using the XF report generator.
Carbonic anhydrase inhibitors
CA catalytic activity was blocked with three USB compounds; U-CH3 (4-{[3,5-methylphenyl)carbamoylamino}benzenesulfon amide), SLC-0111/U-F (4-{[4-fluorophenyl)carbamoyl]amino}benzenesulfon amide), and U-NO2 (4-{[3-nitrophenyl) carbamoyl] amino}benzenesulfonamide). The synthesis and Ki values for recombinant CA proteins are described elsewhere (37). Ki values for inhibitors in intact breast cancer cells have also been previously reported (38). 100 mM stock concentrations of these inhibitors were prepared in DMSO and diluted to specific concentrations as specified in the Results section. The final DMSO concentration was ≤ 0.5%.
Lactate determination
MCF10A and T47D cells, along with CA IX KO (UFH-001) cells and CA XII KO (T47D) cells were plated at a density of 30,000 cells/35 mm plate, while UFH-001 cells were plated at 10,000 cells/plate. All cells were grown to 50-70% confluence. Cells were fed with appropriate medium and then exposed to 16 h of hypoxia at different pH values. Medium was collected from each plate at the end of the exposure time and immediately assayed for lactate. Alternatively, cells were handled similarly as for the glycolytic assay, i.e., fresh medium, adjusted to either pH 7.4 or 6.8, was provided followed by a 3 h incubation at 37°C in a CO2 incubator at which point medium samples were collected for lactate analysis (45). For those cells initially exposed to hypoxia, DFO was added as a chemical substitute. Lactate was determined using a coupled enzyme reaction Data are reported as nmol normalized to protein concentration.
Measurement of extracellular pH
MCF10A and T47D cells, along with CA IX KO (UFH-001) and CA XII KO (T47D) cells were plated at a density of 30,000 cells/35 mm plate, while UFH-001 cells were plated at 10,000 cells/plate. All cells were grown to 50-70% confluence. Cells were then fed with bicarbonate-free DMEM and exposed to normoxic or hypoxic conditions at specific pH values (pH 7.4 or 6.8). The pH of the medium was assessed at specified time points, indicated in the Legend, using a portable pH meter with a standard deviation of 0.1. Data are reported as pHe per plate.
Structural representation of the interaction between USB compounds and CAs
X-ray crystallography structures of USB compounds in complex with CA II and a CA IX mimic (analogous site generated mutagenesis of residues in the active site of CA II to resemble wildtype CA IX) were previously obtained, published elsewhere and data deposited in the protein data bank (33). In silico modelling experiments of the same USBs modeled into the active site of CA XII were also previously performed and published (38). These structures were used to illustrate USB binding in the active sites of CA II, IX and XII relative to His64 (CA II numbering). Figures were made using PyMol.
Statistics
RNA seq data for normoxic vs hypoxic cells, along with the CA activity assay, were analyzed using the Student’s t test. All p values were based on two-tailed analysis and p < 0.05 was considered statistically significant. Statistical analysis was performed using the Prism 7 software. Glucose transport activity, glycolytic activity (GlycoPER), extracellular lactate, and pHe data were analyzed with R (version 3.4.1) using RStudio (V.1.0.153). ANOVA models were generated with the lm function using type III Sum of Squares, and Tukey posthoc comparisons among groups were conducted with the LSD test function of Agricolae.
Funding
This research was financed by the National Institutes of Health, project CA165284 (SCF) and minority supplement CA165284-03S1 (MYM). Part of this work was performed with assistance of the University of Louisville Genomics Facility and Bioinformatics Core, which was supported by NIH/NIGMS Phase III COBRE P30 GM106396, NIH/NIGMS KY-INBRE P20GM103436, the James Graham Brown Foundation, and user fees. Funding for RNA sequencing was provided under the aegis of the NIH/NIGMS Phase III COBRE P30 GM106396 by the Kentucky Biomedical Research Infrastructure Network (KBRIN) Next Generation Sequencing (NGS) project KBRIN0093 (CJF).
Conflict of interest
The authors declare that they have no conflicts of interest with the contents of this article.
Author contributions
MYM, ZC, DK, AW, and LA performed experiments. CDH provided oversight for xenograft and PDX animal experiments. MB, FC, and CTS provided sulfonamide inhibitors. KB created the Crispr CA IX knockout cells. CJF performed the statistical analysis and analyzed the RNA seq data. MYM, RM, and SCF developed the research strategy. MYM wrote the first draft of the manuscript. CJF, RM, and SCF provided feedback on the manuscript. CJF and SCF gained financial support for the project. SCF provided oversight for the entire project.
Abbreviations
Acknowledgements
The authors would like to recognize the exceptional cell culture skills of Xiao Wei Gu.
References


