

Abstract
The gene encoding the Duffy blood group protein (Fy, CD234; additional designations Duffy Antigen Receptor of Chemokines [DARC] and Atypical Chemokine Receptor 1 [ACKR1]) is characterized by a SNP in a GATA-1 transcription factor binding site associated with the erythrocyte silent (ES) phenotype. FYES homozygous people are viewed to be highly resistant to blood stage infection with Plasmodium vivax. Increasingly, however, studies are reporting P. vivax infections in Fy-negative individuals across malarious African countries where FYES approaches genetic fixation. This suggests that P. vivax has evolved a Fy-independent RBC invasion pathway, or that the GATA-1 SNP does not abolish Fy expression. Here, we tested the second hypothesis through binding studies to erythroid lineage cells using recombinant P. vivax Duffy binding protein, the parasite’s invasion ligand and Fy6-specific antibodies. We first observed variable Fy expression on circulating RBCs, irrespective of FY genotype; FYES RBCs were periodically Fy-positive. Furthermore, during the in vitro erythroid differentiation of CD34+ cells and on ex vivo bone marrow samples, we observed Fy expression on erythroid precursor cells from FYES people. Finally, the Fy6-specific nanobody, CA111 was used to capture Fy from the surface of FYES RBCs. Our findings reveal that the GATA-1 SNP does not fully abolish Fy expression and provide insight on potential susceptibility of Fy-negative people to vivax malaria.
Significance Duffy blood group negativity results from a single nucleotide polymorphism (SNP) in the gene promoter, and reaches genetic fixation in many African ethnicities. Because the Duffy protein (Fy) is an important contact point during Plasmodium vivax human red blood cell invasion, Fy-negativity is considered to confer resistance to P. vivax malaria. With recent studies in African countries reporting P. vivax infection in Fy-negative people, we studied Fy expression across erythroid development. Here we report that the FY promoter SNP does not abolish Fy protein expression in erythroid progenitors developing in the bone marrow. These results further emphasizes the importance of reticulocytes as targets for P. vivax blood stage infection and propose a mechanism for P. vivax infections in Fy-negative people.
Introduction
Duffy gene (FY) polymorphism is prominent historically in many corners of biomedical investigation. In 1968, Donahue et al used Fya/ Fyb serological inheritance patterns and human chromosome 1 centromeric staining features to make FY the first gene mapped to a human autosome (1). Similarly, the Duffy blood group protein (Fy) (2) was the first identified member of the diverse seven transmembrane chemokine receptor family, albeit with a number of interesting structural and functional differences that make its biology unique (2). Fy expression on both erythroid and non-erythroid cells (2) modulates homeostatic levels and gradients of chemokines between blood circulation (3-7) and tissues (8-12) underlying immune responses and an emerging array of pathologies.
The decades-long observations that Africans and African-Americans, who are for the most part Fy-negative, were highly resistant to Plasmodium vivax blood stage infection (13-18) suggested that interaction with the Fy protein was required for parasite invasion of human red blood cells (RBCs) (19). With gene sequencing, a single nucleotide polymorphism (SNP) in the FY gene GATA-1 transcription factor binding site has been shown to block FY erythroid expression (20, 21) and homozygosity underlies the “Fy erythrocyte silent” (herein, Fy-negative) phenotype characterized by standard serological methods (20). In vitro studies using Fy-dependent, P. knowlesi (22, 23), have gone on to show that while the merozoite is able to orient apically to the RBC surface, the mechanism fails to establish parasite-Fy-negative RBC commitment. Therefore, onward formation of a tight mobile junction needed to infect the RBC was inhibited, and invasion was blocked (24). This background has inextricably linked Duffy blood group genetics and malaria.
Recent studies now report P. vivax infections in Fy-negative individuals from many malarious countries across Africa (25). These observations lead to at least two hypotheses. First, the parasite’s Duffy binding protein (PvDBP) may not interact with Fy, exclusively. Second, constitutive low level or periodic Fy expression may occur in Fy-negative people and facilitate blood stage infection.
Previous studies have demonstrated a gene dosage effect of the FY GATA-1 SNP that reduces erythrocyte surface expression of Fya and Fyb by 50% in heterozygous individuals (21, 26), and others have identified additional coding region SNPs associated with reduced expression of both Fya (Fya-weak) (27) and Fyb (Fyb-weak) (28-30); very rare nonsense SNPs and deletions in the FY gene coding region have also been reported (see text with Supplemental Information (SI) Table S1) (31, 32). Further, Fy is more highly expressed on reticulocytes vs. older RBC (26). With the range of Fy expression phenotypes, here we tested the hypothesis that Fy protein expression may not be fully blocked by the GATA-1 SNP (FYES mutation) as demonstrated through previous study designs (33, 34).
Results
Binding specificity of CA111
To assess the presence of Fy on RBCs, the camelid single-domain antibody CA111 was used. This VHH or nanobody is specific for the 5-amino acid sequence 22FEDVW26 within the Fy amino terminal domain, overlapping the linear epitope recognized by the anti-Fy6, 2C3 mouse MoAb (Supplemental Methods; Text S1) (35). This is the same region of Fy to which chemokines and PvDBP bind and acts as the receptor for P. vivax RBC invasion (35). In specificity assessments, we demonstrate that the anti-Fy6 antibodies CA111 and 2C3, reciprocally inhibit their binding to Fy-positive pbRBCs in competitive binding studies (Figure S1A). Additional comparisons among CA111, 2C3, anti-Fya and anti-Fyb show that CA111 demonstrates the strongest relative sensitivity for Fy binding among these antibody reagents (Figure S1B). Finally, while in silico analysis (BLASTp) showed the Fy 22FEDVW26 and CXCR2 11FEDFW15 sequence motifs vary at only one position, we demonstrated that CA111 was not able to bind or to pull down CXCR2 (Figure S2).
We then tested whether CA111 recognized Fy on FY*A/*A, FY*B/*B and FY*BES/*BES RBC. Working on freshly collected, peripheral blood red blood cells (pbRBC), we observed expected binding to pbRBC of FY*A/*A, FY*B/*B donors, but also observed unexpected CA111 binding to FY*BES/*BES pbRBC (Figure 1). Over three different time points of our initial experiments, the CA111 binding varied from 74.0% to 89.4% in FY*B/*B pbRBC, from 77.2% to 90.8% in FY*A/*A pbRBC and from 11.5% to 47.6% in FY*BES/*BES. This latter result, observed several times and tested in triplicate, was markedly higher than previously observed on FY*BES/*BES donors(35), and suggested that the Fy protein may be expressed periodically on the RBC surface of FY*BES/*BES (Donor #1).

Direct binding of CA111 (30ug/mL) to pbRBC from FY*B/*B, FY*A/*A and FY*BES/*BES (#1) donors. Our preliminary experiments were performed at 3 different time points and in triplicate (histograms in red, orange and blue in overlay). Individual donor samples at each time point served as negative controls represented in each histogram by the dark dashed line. The percentage of cells with CA111 binding (PE: phycoerythrin) above the background established by comparison to negative controls (minus CA111; plus anti-HA mouse antibody; plus anti-mouse-phycoerythrin conjugateted goat antibody) is indicated above the gate determined for positive rPvDBPII binding.
rPvDBPII binding on FY*BES/*BES peripheral blood RBC
We next tested if rPvDBPII would interact with FY*BES/*BES (Donor #1) pbRBCs. rPvDBPII bound to both FY*A/*B and to a lesser extent FY*BES/*BES (Donor #1) pbRBC. As a control, unfolded rPvDBPII failed to bind pbRBC from the same donors (Figure 2). rPvDBPII, as well as chemokine binding to Fy have been shown to be sensitive to chymotrypsin treatment of pbRBC(22, 36). Consistent with expectations from these previous studies, we observed that chymotrypsin treatment eliminated rPvDBPII binding to pbRBC from both FY*A/*B and FY*BES/*BES donors.
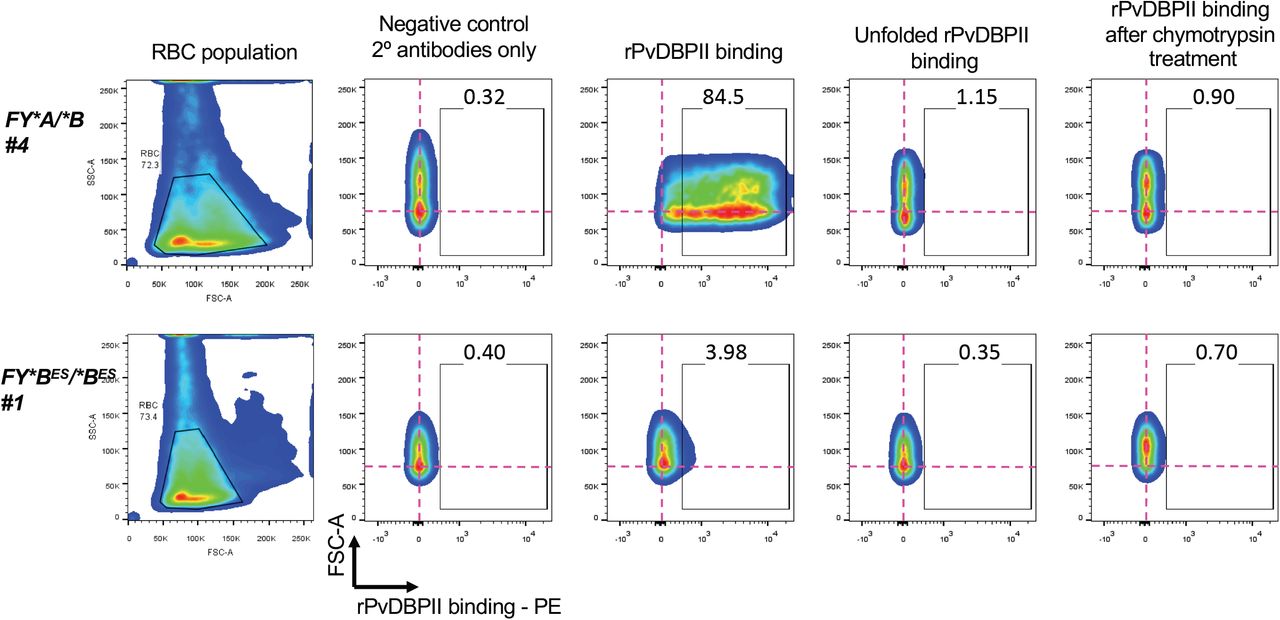
The pbRBC population is selected in the forward (FSC-A) and size (SSC-A) scatter plots (left-most panel). The doublets were removed from the analysis (data not shown). The binding of recombinant Plasmodium vivax Duffy binding protein, region II (rPvDBPII) on pbRBC is represented by the gated region designated by the open box in each plot. The percentage of pbRBC showing binding to rPvDBPII is indicated above the gate in each experiment. The pink crosshairs show the center of the pbRBC population from the negative control condition (minus rPvDBPII; plus secondary anti-rPvDBPII, rabbit polyclonal antibody; plus anti-rabbit-phycoerythrin-conjugateted, goat antibody) to onward experimental conditions (plus rPvDBPII; plus secondary antibodies). The fixed position of the crosshairs facilitate comparisons between pbRBC population shifts across negative controls and test conditions.
Specificity of rPvDBPII binding on FY*BES/*BES pbRBC
Given the unexpected interaction of both CA111 and rPvDBPII with FY*BES/*BES pbRBC, we pursued additional experiments to further evaluate the specificity of rPvDBPII binding. We first evaluated the specificity of this interaction by testing rPvDBPII binding to Fy-positive and Fy-negative pbRBC by Western blot analysis (Figure 3A).

Panel A – pbRBC were exposed to rPvDBPII (20 μg/mL) to allow protein interaction and binding with RBC cell-surface proteins (2 hr. at room temperature). Polyclonal anti-PvDBP was used to probe a Western blot of solubilized proteins to determine if the Fy protein was responsible for the rPvDBPII-specific signals observed in flow cytometry experiments and designated by the black arrow. Individual donors for this study included the FY genotypes FY*BES/*BES and FY*A/*B. The western blot was probed with polyclonal anti-PvDBP and anti-rabbit HRP. For both FY*BES/*BES and FY*A/*B genotypes, rPvDBPII bound to a single protein band, with a MW comparable to the Fy protein (35 kD).
Panel B - Increasing molar concentrations of NaCl were used to determine if it was possible to dissociate the binding of rPvDBPII from pbRBC. Individual donors for this study included the FY genotypes FY*B/*B, FY*A/*B and FY*BES/*BES. Non-specific binding should be dissociated with a large relative volume (750 μL) of PBS (0.15M of NaCl). No significant reduction in rPvDBPII binding was observed across increasing NaCl concentrations from 0.15M to 1.0M. Only upon addition of 1.5M NaCl was there any significant reduction in rPvDBPII binding. (Pearson Chi2 test for median, p=0.014: Pearson Chi2=6.0). Each curve represents a different donor: FY*B/*B #3 in black circle, FY*A/*B #4 in open square, FY*BES/*BES #1 in black triangle.
We exposed both Fy-positive and Fy-negative pbRBC to rPvDBPII, eluted pbRBC bound proteins and then probed a Western blot of these proteins with a polyclonal antibody to PvDBP. Western blot results revealed a single protein band from both FY*A/*B and FY*BES/*BES pbRBC (Figure 3A); specific detection by the polyclonal anti-PvDBP and the apparent molecular weight of approximately 35kDa were both consistent with detection of the rPvDBPII protein.
To evaluate the relative affinity of rPvDBPII interaction to Fy-positive and Fy-negative pbRBC, we next tested the dissociation of PvDBPII from pbRBC with increasing NaCl concentrations (Figure 3B). While we observed that the relative binding of rPvDBPII to FY*BES/*BES pbRBC was markedly lower than that observed for FY*B/*B and FY*A/*B, dissociation of rPvDBPII from FY*B/*B and FY*A/*B versus FY*BES/*BES pbRBC was similar across decreasing NaCl concentrations (0.15M, 0.3M, 0.6M and 1M NaCl). At 1.5M NaCl the pbRBC for all FY genotypes were lysing and therefore rPvDBPII signal decreased across all samples.
Given consistent demonstration of the chymotrypsin-sensitive nature of the Fy protein(22, 33, 36-38) and the molecular interactions tethered to RBC Fy, we tested the reproducibility of rPvDBPII binding to FY*BES/*BES pbRBC after chymotrypsin treatment. Here, we examined the chymotrypsin sensitivity of rPvDBPII binding for one FY*A/*B and FY*BES/*BES (Donor #1) at multiple independent times and results (Figure 4) consistently showed that the binding of rPvDBPII to both FY*A/*B and FY*BES/*BES pbRBC were significantly higher before than after a chymotrypsin treatment; consistent with results in Figure 1, we observed that rPvDBPII binding to Fy varied for the individual donors between different time points.

This experiment assessed the reproducibility of chymotrypsin-sensitive rPvDBPII binding to pbRBC. Individual donors for this study included the FY genotypes FY*A/*B and FY*BES/*BES using pbRBC without chymotrypsin treatment (light gray boxes) or with chymotrypsin treatment (dark gray boxes); specific individual data points appear as fill black circles. rPvDBPII binding was performed after 5 washes to remove any residual chymotrypsin. Consistent with earlier experiments, individual donor samples served as negative controls (minus rPvDBPII; plus secondary anti-rPvDBPII, rabbit polyclonal antibody; plus anti-rabbit-phycoerythrin conjugateted goat antibody). The measurements for the individual donors were performed at different times. For FY*A/*B: without chymotrypsin n=12; with chymotrypsin n=5; for FY*BES/*BES: without chymotrypsin n=9; with chymotrypsin n=5. A non-parametric paired Wilcoxon rank-sum test was used to assess the differences between chymotrypsin treatments. FY*A/*B z=3,162 (P-value = 0.0016); FY*BES/*BES z=2,067 (P-value = 0.038).
rPvDBPII binding on RBC over time
Because we observed variation in CA111 and PvDBPII binding to pbRBC at different time points for both Fy-positive and Fy-negative donors, we examined this variability in greater detail using comparable staining and flow cytometric procedures (Figure 5A). Among the FY*BES/*BES pbRBC sampling time points (8 samples for both FY*BES/*BES #1 and FY*BES/*BES #2), five samples showed rPvDBPII binding at least 2-fold above the negative control; both FY*BES/*BES donors showed evidence of rPvDBPII 5-fold above the negative control. Interestingly, rPvDBPII binding was also variable for Fy-positive individuals, irrespective of their genotype. Overall, the rPvDBPII binding (fold-increase over negative control) was 32.4 for FY*B/*B (11.8; 110.9); 17.2 for FY*A/*A (4.9; 47.7); 1.9 for FY*BES/*BES #1 (0.7; 5.9); 2.4 for FY*BES/*BES #2 (0.5; 6.7). Of additional interest, across this series of samples from the four pbRBC donors featured, the higher levels of Fy expression on FY*BES/*BES pbRBC were comparable to the lower level of rPvDBPII binding for the FY*A/*A pbRBC (Figure 5A; see *).

Part A. rPvDBPII binding on Fy-positive and Fy-negative pbRBC over time. Each line corresponds to the binding of rPvDBPII on the pbRBC from one donor. Four donors were followed for up to 10 months: one FY*B/*B, one FY*A/*A, two FY*BES/*BES (donors #1 and #2). At each time point, the binding was tested in triplicate and binding is represented as the x-fold increase over negative control. Each donor had its own negative control for each time point. The upper, lower and the mean values are indicated for each time point. Over time, an extensive variability of the binding has been observed for both Fy-positive and Fy-negative donors. All the experiments have been conducted using the same antibodies (same reference) and the flow cytometer (Attune NxT, Thermo Fisher).
Part B. Blocking of the rPvDBPII binding to Fy-positive and Fy-negative pbRBC. Studies evaluating rPvDBPII binding to donor pbRBC were analyzed following the same protocols described for erythrocyte binding assays. The experiments performed here evaluate inhibition of rPvDBPII binding to donor pbRBC by CA111 and nDARCIg. Left Panel – Results demonstrate the inhibition of rPvDBPII binding with the addition of the Fy-specific VHH, CA111 (30ug/mL). Right Panel – Results demonstrate the inhibition of rPvDBPII binding with the addition of the Fy-IgG protein, nDARCIg (60ug/mL). Statistical analysis of this composite experiment included multiple time points for each individual sample donor: n=9 for FY*B/*B, n=7 for FY*A/*A, n=7 for FY*BES/*BES #1, n=7 for FY*BES/*BES #2. A paired, non-parametric Wilcoxon Signed-Ranks Test was performed to assess the differences of rPvDBPII binding without (data points on the left of each graph) or with (data points on the right of each graph) blocking (FY*B/*B – CA111: Z = 2.803, nDARCIg: Z = 2.521; FY*A/*A – CA111: Z = 2.803, nDARCIg: Z = 2.521; FY*BES/*BES #1 – CA111: Z = 2.666, nDARCIg: Z = 2.197; FY*BES/*BES #2 – CA111: Z = 2.380, nDARCIg: Z = 2.366). The dashed line represents the level of binding for the negative controls. Individual samples for each time point had their own negative control.
Part C. Specific capture and detection of the Fy protein from the surface of pbRBC. This figure presents direct evidence of the specific capture, immunoprecipitation and detection of the Fy protein from the surface of the pbRBC of FY*B/*B and FY*BES/*BES donors. In the left panel, nDARC is the recombinant Duffy protein. In this lane, the protein and its dimer were distinguishable. In the center panel we demonstrate CA111-based capture of the Fy protein from pbRBC of both FY*B/*B and FY*BES/*BES (Donor #1; March 1, 2017 collection). In the right panel we demonstrate CA111-based capture of the Fy protein from pbRBC of FY*BES/*BES (Donor #2; May 17, 2017 collection). The dates referred to dates for which flow cytometry results are provided Figure 4 and Figure 5. Fy protein was immunoprecipitated from pbRBC protein extract obtained (12.5×10⁹ pbRBC from both Fy-positive and Fy-negative; 2.5 mL of leukocyte depleted whole blood); leukocyte depletion confirmed by light microscopy. Detection of the CA111-captured Fy protein on these Western blots was performed using a polyclonal anti-ACKR1.
To confirm the specificity of rPvDBPII binding to pbRBC, we used CA111 to bind available Fy protein on the pbRBC and thereby block rPvDBPII access to the RBC. In a second set of experiments we used the Fy recombinant protein fused to the Fc region of IgG1, nDARCIg(39), to block rPvDBPII binding on the pbRBC surface (Figure 5B). For these experiments, we tested one FY*B/*B, one FY*A/*A and two FY*BES/*BES donors (#1 and #2) at multiple time points. For the Fy-positive donors, the Fy-specific CA111 nanobody (Figure 5B left panel) decreased rPvDBPII binding from 25.2-fold (5.8; 110.9) over negative controls to 2.1-fold (0.2; 12.1) (P-value =0.001 for FY*B/*B; P-value =0.001 for FY*A/*A). Under these same conditions, rPvDBPII binding decreased for the FY*BES/*BES pbRBC from 2.0-fold (0.5;6.4) over negative controls to 0.8-fold (0.2;1.9) (P-value =0.002 for FY*BES/*BES #1; P-value =0.003 for FY*BES/*BES #2).
In partner experiments to assess the specificity of rPvDBPII binding to pbRBC (Figure 5B right panel), nDARCIg was observed to decrease rPvDBPII binding from 25.2-fold (5.8; 110.9) over negative controls to 2.81-fold (0.5;7.7) (P-value=0.004 for FY*B/*B; P-value=0.004 for FY*A/*A). For the FY*BES/*BES pbRBC, nDARC decreased rPvDBPII binding to pbRBC from 2.0-fold (0.5;6.4) over negative controls to 1.0-fold (0.3;2.8). Thus, both CA111 and nDARCIg blocked binding of PvDBPII to FY*BES/*BES pbRBCs, providing evidence of Fy-specific binding of PvDBPII to FY*BES/*BES pbRBC.
As further evidence of Fy protein expression on the FY*BES/*BES pbRBC surface, we solubilized pbRBC membranes and immunoprecipitated the Fy protein using CA111. Results show that following CA111-capture, we successfully detected the Fy protein on Western blots probed with a second Fy-specific antibody (polyclonal anti-ACKR1) from one FY*B/*B and both FY*BES/*BES donors (Figure 5C).
Interrogating Fy protein expression on erythroid progenitor cells in vitro
Given a wide range of results pointing to P. vivax preference for infection of reticulocytes (40-48) and the apparent low, variable expression Fy protein on Fy*BES/*BES pbRBC, we postulated that this expression pattern may reflect the lower and declining stages of Fy expression on aging pbRBC. Further recent evidence from murine studies showing that the Fy protein is expressed at higher levels on pro-erythroblasts and normoblasts, compared to mature RBC (49), suggesting that we should investigated Fy expression in erythroid precursors. We initiated these in vitro studies by expanding CD34pos (expressed on megakaryocyte/erythrocyte progenitors (MEP (50-54))) from the peripheral blood of one previous FY*B/*B donor and FY*BES/*BES Donors #1 and #2. At Days 11, 15 and 18, cells were collected to monitor erythroid lineage maturation using the surface markers CD36, CD71, Glycophorin A and Band 3 and query Fy protein expression (Figure 6A and Figure S3A). As expected, during the differentiation process, CD36 and CD71 were decreasing, whereas Glycophorin A and Band 3 increased among the most mature RBCs. No difference in the maturation stages from the different donors was observed over time (Figure S3B). Expression of the Fy protein during these differentiation time points was monitored by either flow cytometry (CA111 binding) and/or Western blot (CA111 immunoprecipitation; anti-ACKR1 detection). For the FY*B/*B donor, at Day11, half of the cell population expressed the Fy protein at the cell surface whereas after Day15 the whole population expressed the Fy protein. From the two different FY*BES/*BES donors, the expression of the Fy protein was observed in vitro as early as Day11 of maturation. Consistent with our previous results on pbRBC, the Fy protein expression was lower on FY*BES/*BES cells (11 and 35%) than on FY*B/*B cells (49%) (Figure 6A). However, we observed that significantly higher proportions of the erythroid precursor cells from FY*BES/*BES donors tested positive for the Fy protein (Day18 proportion of Fy-positive cells; 49.7% for FY*BES/*BES #1 and 83.8% for FY*BES/*BES #2) than was observed previously for pbRBC (highest proportion of Fy-positive pbRBC from Figure 5A - 6% for FY*BES/*BES #1 and 7% for FY*BES/*BES #2). Expression of the Fy protein on erythroid precursors differentiated in vitro at Day18 was further confirmed by immunoprecipitation and Western blot (Figure 6B and 6C).

Part A. CD34 positive cells were isolated from peripheral blood of one FY*B/*B and 2 FY*BES/*BES donors (#1 and #2). CD34 positive cells isolated by immune-magnetic bead capture, were cultured and expanded for over 21 days. Cells were harvested on days 11, 15 and 18 to measure the CA111 binding during in vitro differentiation. For each time point and each donor, the percentage of positive cells for the binding of CA111 is expressed (population in red within the CA111-PE positive gate) in comparison to its negative control (population in black, e.g. secondary antibody only).
Parts B and C. Expression of Fy protein in FY*BES/*BES erythroid precursors during differentiation in vitro detected by Western Blot. Erythroid differentiation was initiated from CD34 positive cells isolated from peripheral blood (B) or bone marrow (C). Cells were harvested on Day18 and Fy protein was immunoprecipitated (2.0×10⁵ erythroid progenitors from both Fy-positive and Fy-negative); leukocyte depletion was not necessary as protocols for expansion of CD34 cells deplete peripheral blood leukocytes. The proteins captured by CA111 were revealed with a polyclonal anti-ACKR1 antibody (arrows). All the antibodies used to reveal the Fy protein signal were different between flow cytometry and Western blot.
These studies confirm the ability of individuals with FY*BES/*BES genotype to clearly express the Fy protein in erythroid progenitor cells cultured in vitro; these results required confirmation of Fy expression in erythroid progenitor cells ex vivo.
Ex vivo Fy protein expression on bone marrow erythroid precursors
The erythroid developmental stages observed during in vitro CD34 cell expansion studies are most commonly found in the bone marrow in vivo. Therefore, to evaluate Fy expression in human bone marrow, we monitored expression ex vivo of the following cell surface markers as accepted indicators erythroid precursors: CD34 (marker of MEP cells (50-54)), CD45 (marker to differentiate erythroid from lymphoid development (50)), CD105 (marker human erythrocyte progenitor (hEP) (54-56)), and CD71 (marker of reticulocytes (57)) cell surface markers (Figures S4 and S5A and S5B). To confirm observations regarding Fy expression across the developing erythroid lineage expanded from CD34 cells, we measured Fy protein expression on 10 ex vivo bone marrow samples (six Fy-positive and four Fy-negative). We distinguished the composition of cell lineages in each bone marrow sample, focusing on erythroid precursors and simultaneously measured the binding of CA111 by flow cytometry (Figure 7A). We observed CA111 recognition of the Fy protein in bone marrow erythroid precursors from both Fy-positive and Fy-negative individuals. The highest levels of CA111 binding was observed within the CD34neg/CD45neg/CD105pos/CD71pos/Band3pos subpopulation (skewed toward reticulocytes; CD105 declining) for both Fy-positive and Fy-negative donors. Detailed comparative analyses of bone marrow samples from individuals representing specific FY genotypes are provided in Figures S5A and S5B. Results with CA111 have been replicated using the murine monoclonal antibody, 2C3 (Figure 7B). The anti-Fya and anti-Fyb antibodies used in clinical laboratories have shown limited antigen-specific binding to bone marrow. Finally, we confirmed expression of Fy protein by CA111-capture and anti-ACKR1-detection from both Fy-negative and Fy-positive donors in the erythroid precursor bone marrow population (Figure 7C).

Panel A. Four Fy-negative (in red) and six Fy-positive (in blue) bone marrows. In the bone marrow, all stages of erythroid precursors are present except mature erythrocytes (that are circulating in the peripheral blood). To determine whether a particular erythroid developmental stage expressed the Fy protein (and monitor relative expression levels), we added a panel of 5 extra-cellular markers known to distinguish bone marrow lineages. The x-axis represents the signal of those markers defining the erythroid population. The Fy protein was detected by CA111 binding. For each point, the fold-increase over negative control of the geometric mean fluorescence intensity is represented with its standard deviation.
Panel B. Two Fy-negative (in red [BM766 and BM864]) and two Fy-positive (in blue [BM565 and BM735]) bone marrows. Similar to Panel A, we added a panel of 5 extra-cellular markers known to distinguish bone marrow lineages. The x-axis represents the signal of those markers defining the erythroid population. The Fy protein was detected by 2C3 binding. For each point, the fold-increase over negative control of the geometric mean fluorescence intensity is shown. Note that BM735 is a heterozygous carrier of the Fy-negative allele (FY*A/*BES); BM565 is heterozygous for both Fy-positive alleles (FY*A/*B).
Panel C. Expression of Fy protein in Fy*BES/*BES CD45 negative erythroid precursors from ex vivo bone marrow. CD45 negative cells (erythroid precursors in bone marrow) of three bone marrow samples were sorted by flow cytometry. The membrane proteins of the sorted cells were then immunoprecipitated with the CA111 and revealed by Western Blot with a polyclonal anti-ACKR1 antibody (arrow). Both Fy-positive and Fy-negative show a signal for the Fy protein in erythroid precursors. Fy protein was immunoprecipitated from bone marrow shown to be CD45neg (2.0×10⁵ erythroid progenitors from both Fy-positive and Fy-negative); leukocyte depletion was not. On the same samples, the immunoprecipitated proteins were probed with an anti-CXCR2 (see Supplemental Figure 2B) and did not show any signal, meaning that CXCR2 is not expressed on CD45 negative erythroid precursors from bone marrow.
Discussion
Given our findings on P. vivax infection of Fy-negative people from Madagascar (58) and other malarious sites across Africa (25), we wanted to investigate how parasite and host invasion proteins interacted with Fy-negative RBCs. To initiate these studies, it was necessary to change how we have performed erythrocyte binding assays (34). Given that Fy-negatives are infected with P. vivax, we cannot assume that Fy-specific antibodies or rPvDBPII do not bind to Fy-negative RBC (22, 33, 59, 60). Additionally, because we have observed examples of varying Fy expression (King and Zimmerman; unpublished data), it was necessary to conduct a time series study to document fluctuation of Fy expression on both Fy-positive and Fy-negative RBC. This approach revealed novel findings from the outset of our studies, that the Fy protein is expressed on genotypically Fy-negative erythroid cells.
Our initial studies focused on peripheral blood RBCs (pbRBC), showed that Fy expression on Fy-negative pbRBC was periodically positive and that these RBC could interact with rPvDBPII at levels similar to RBC from FY*A/*A people. Well aware that numerous studies point to P. vivax preference for infection of reticulocytes (40, 42-48), we were interested to study Fy expression across a broader time frame of erythroid development. Recent evidence from murine and human studies shows higher levels of Fy protein expression on pro-erythroblasts and normoblasts, compared to mature RBC (46, 49). Additionally, Malleret et al. have demonstrated that immature reticulocytes (CD71pos), most commonly found in the bone marrow are preferentially invaded by P. vivax compared to older reticulocytes and erythrocytes (CD71neg), in the peripheral blood (47). Obaldia et al. emphasize that the bone marrow is an important reservoir of P. vivax infection of Aotus and Saimiri monkeys (61).
Our first studies on earlier erythroid stages focused on enriching CD34pos MEPs that circulate in the peripheral blood, allowing them to mature in vitro under conditions favoring erythroid development(51). We purposefully included the same Fy-positive and Fy-negative people from our work demonstrating pbRBC CA111 and rPvDBPII binding to provide continuity across our study design. We felt it was particularly important to continue study of the same Fy-negative donors so that we could bridge observations from early erythroid development to mature erythrocytes. Interestingly, results showed that significantly higher proportions of the erythroid precursor cells from FY*BES/*BES donors were Fy protein-positive than their pbRBC.
With observation of Fy protein expression from the CD34 cell maturation experiments, the logical in vivo extension of this investigation was to repeat our studies on bone marrow samples as the site for natural erythroid cell development. After identification of a strategy to segregate the earliest multipotent stem cells (CD34pos) differentiating toward erythroid (CD105pos) and not lymphoid (CD105neg) development, we continued to monitor expression of CD71 and Band 3 as markers distinguishing reticulocyte maturation. Results from these bone marrow studies showed Fy protein expression on early stage cells committing to erythroid development in both Fy-positive and Fy-negative people. Our observations suggest that Fy expression initiates in an early erythroid subpopulation (CD34pos/CD45pos/CD105pos/CD71neg/Band3neg) in both Fy-positive and Fy-negative people. This may suggest that Fy expression is driven by GATA-2, prior to proerythroblast differentiation and transition to GATA-1 (55, 62). The observed decline of Fy signal in CD34neg/CD45neg/CD105neg/CD71pos/Band3pos cells, appears to be consistent with RBC extrusion of its nucleus, after which RBC precursors are no longer able to express their genes and the cell can only be equipped with the gene products expressed prior this important developmental event. With compromised FY gene expression associated with the GATA-1, FYES SNP, the amount of Fy protein begins to decay early and from a lower surface concentration from Fy-negative than Fy-positive erythroid cells. Our results suggest Fy6-specific CA111 is more sensitive than antibodies used in conventional serological typing.
Potential that bone marrow could be the source for reticulocytes for in vitro cell culture is becoming an increasingly important area of P. vivax research. Fernandez-Becerra et al. have expanded CD34pos hematopoietic stem cells to generate CD71pos reticulocytes for in vitro P. vivax culture (63). Others have concentrated their efforts on enriching reticulocytes from cord blood. Optimizing these in vitro culture systems will require additional trials as the importance of adult versus fetal hemoglobin, reticulocyte cell structure complexity and Duffy blood group polymorphism are addressed (64, 65).
Because our studies in Madagascar suggested that P. vivax had developed an Fy-independent RBC invasion mechanism (58), we were also interested to see that rPvDBPII binds to the surface of the different erythroid target cells used in our studies (pbRBC; expanded CD34 cell populations; bone marrow). We were further interested in the outcomes of our competitive inhibition studies. These experiments showed that addition of both CA111 and nDARCIg significantly reduced rPvDBPII binding to Fy-positive pbRBC and essentially blocked rPvDBPII binding to Fy-negative pbRBC. These latter results suggest that rPvDBPII binding may be limited to the Fy protein. If there were additional, equally attractive erythrocyte membrane proteins with which to interact, it is difficult to conclude how CA111 and nDARCIg inhibition of rPvDBPII binding could have been as complete.
Conclusion
Our findings present evidence that the FY GATA-1 promoter SNP does not fully abolish erythroid lineage Fy protein expression. With increasing evidence that Fy-negative people are not completely resistant to P. vivax blood stage malaria (25), new reservoirs of P. vivax within infected individuals must be considered (47, 61). Beyond gaining new insight on RBC invasion, it is important to understand the mechanisms of pathogenesis and clinical implications of P. vivax malaria in the bone marrow. With extensive involvement of the bone marrow, it becomes easier to understand how significant anemia can result from P. vivax malaria. At the very least, peripheral blood infection may significantly underestimate the total body parasitemia of a P. vivax infection (66). Finally, to gain a full appreciation of the global burden of vivax malaria (67, 68), further study is required to understand how the parasite uses the poorly understood reservoir of Fy-negative people to propagate and generate gametocytes that contribute to on-going transmission.
Methods
Study Participants and Sample collection
Study protocols were approved by the University Hospitals of Cleveland Institutional Review Board (#08-03-33 and #09-90-195). We included eleven Fy-positive (three females and eight males) and sixteen Fy-negative persons (nine females and seven males) (Table S1); all Fy-negative persons were homozygous for the negative GATA-1 mutation (rs2814778; FY*BES/*BES). All blood and bone marrow samples were processed within 2 hours of collection.
DNA Extraction and PCR-based Genotyping
All study participants were genotyped by previously described methods (58) (See Supplemental Methods; Text S2).
Protein expression
CA111 – Variable domain of a heavy chain of the heavy-chain only (VHH), nanobody of camelids. This nanobody was kindly provided by Olivier Bertrand (National Institute of Blood Transfusion (INTS), Paris, France) (35) (See SI Methods).
rPvDBPII recombinant protein (Sal I variant(69))
Region II of Salvador I strain PvDBP (rPvDBPII; 37.6 KDa) was expressed as inclusion bodies in Escherichia coli and then refolded and purified as previously described (70-72). The protein purified before refolding served as a negative control.
Duffy Antigen Receptor for Chemokine chimeric protein construct (nDARCIg Fyb)
Briefly, as previously described (39), HEK293H cells were co-transfected with pCDM8-DARC-Fc (first N-terminal 60 amino acids of Fy) and pRc/CMV-TPST (human sulfotransferase).
Erythrocyte binding assays
Erythrocyte binding assays were performed based on previously developed strategies and reagents (34, 60); details provided in Supplemental Methods. In our studies, we also compare CA111 results with the murine MoMab, NaM185-2C3 (also known as 2C3; anti-Fy6) (73, 74) anti-FyA (ref: 808 186 BioRad) and anti-FyB (ref: 808 191 BioRad) antibodies.
Multiple flow cytometry strategies were followed according to specific applications in this study. Experiments evaluated CA111 and rPvDBPII binding to pbRBC in a total of 100,000 cells (all samples analyzed in triplicate). Erythrocyte binding assays were optimized by adjusting the blocking concentrations for BSA (Figure S1A) and through the use of unfolded rPvDBPII as a negative control (Figure S1B). Additionally, our assay development also tested Fy protein expression on FY transfected/non-transfected K562 cells (75) (expressing/not expressing, respectively [Figure S1C]). Following experiments on the maturation of CD34+ hematopoietic stem cells, flow cytometry evaluated at least 50,000 cells (see Figure S3). In evaluation of bone marrow, at least 500,000 cells were evaluated to ensure sufficient data capture for erythroid precursor subpopulations of interest.
rPvDBPII Erythrocyte Capture Assay
This assay was previously described(76). Briefly, ∼106 cells were collected from packed RBC and 10 µg of recombinant PvDBPII was added. After 2 hours of incubation at room temperature, the preparation was layered on top of 500 µL of dibutylphtalate and centrifuged at 11,000 rpm for 30 sec. The pellet was collected and the proteins bound at the RBC surface were eluted adding 20 µL of 1.5 M NaCl drop wise and shaking. After incubation (5 min), this procedure was repeated with 1.0 M of NaCl and then 0.3 M of NaCl. The preparation was centrifuged at 14,000 rpm for 2 min. The supernatant was collected and the proteins were separated on a Tris-Glycine SDS 4-20% gel (Biorad) in reducing conditions and then transferred onto a PVDF membrane. The membrane was blocked for one hour with TBS 0.1% tween, 5% milk, incubated with rabbit anti-PvDBPII (1: 2,000), washed, then followed by the secondary antibody anti-rabbit HRP (Thermo Scientific). Chemiluminescent signal was detected using SuperSignal™ (Pierce) on X-ray film.
Erythroid differentiation of CD34 positive cells
Isolation of CD34 positive cells was performed from peripheral blood donors (FY*B/*B and FY*BES/*BES donors; #1 and #2) and from bone marrow samples. Mononuclear cells were isolated by Ficoll Plaque Plus (GE Healthcare) and frozen in 10%DMSO. The thawed cells were positively selected for CD34 by magnetic beads (human CD34 MicroBead Kit; Miltenyi Biotech). Between 10,000 and 100,000 cells were obtained after selection and differentiated in culture over 21 days. A detailed protocol is published by Jingping Hu et al (51). The in vitro differentiation was monitored by flow cytometry with 400,000 cells per day (Day 11, Day 15, Day 18) monitoring surface markers CD36 (BD Biosciences), CD71 (BD Biosciences), Band 3 (American Research Product) and Glycophorin A (Life Technology).
Bone marrow cell preparation and staining
Fresh bone marrow was collected in heparin. Erythroid precursors were isolated by Ficoll Paque Plus. A panel constituted by CD45 PerCP Cy5.5, CD71 APC Cy7, CD34 FITC, Band3 PE and CD105 APC markers were used to differentiate erythroid precursors in bone marrow.
Erythroid cell protein extraction and Western blot analysis
Extracting the Fy protein from the surface of erythroid cells was conducted to specifically capture evidence of FY gene expression. These experiments were performed on pbRBCs from Fy-positive and Fy-negative donors. Target cell populations included pbRBC, expanded CD34 cell populations and bone marrow. Details of protein extraction, immunoprecipitation and Western blot analyses are provided in Supplemental Methods.
Statistical Methods
Statistical analyses were performed using STATA version 13.0
Author contributions
CD, SD, BG, CLK and PAZ conceived the study; CD and SD wrote the first draft of the paper with PAZ. CD, SD, CLK, PAZ and JWJ developed the flow cytometry design for the bone marrow analysis. SB conducted all genotyping assays. SK and RF conducted erythrocyte binding assays and flow cytometry. LC conducted Western blot analyses. AG produced unfolded rPvDBPII. NHT, EC and NDS synthesized rPvDBPII. YC developed and provided 2C3 and CA111. SM, SD and BG conducted in vitro proliferation, expansion, and differentiation of CD34+ cells. CLK and PAZ oversaw all aspects of the study. CD, SD, BG, CLK and PAZ analyzed the results. All authors read and approved the final manuscript.
Acknowledgments
We are grateful to the study donors who patiently participated over the course of this investigation and to David N. Wald, Director of the Hematopoietic Biorepository & Cellular Therapy Core and Basabi Maitra for recruitment of bone marrow donors. Howard Meyerson, Keith E. Shults and the Comprehensive Cancer Center of Case Western Reserve University and University Hospitals of Cleveland generously contributed to the flow cytometry study design and provided technical support. We thank Chetan Chitnis for providing nDARCIg; Olivier S. Bertrand and Sylvie Cochet (INSERM/University Paris Diderot) for the gift of anti-Fy antibodies (2C3 and CA111) and objective criticisms integral to this study; Anne-Lyse Baudrier, Emmanuel Collec and the Centre National de Reference pour les Groupes Sanguins (CNRGS) for providing the anti-FyA and anti-FyB antibodies. We finally thank Allison M. Shackelford for graphic art assistance with the visual abstract overview of our manuscript.
This study was funded by grants from the Veterans Affairs Research Service (BX001350) and NIH Grant (R01 AI064687) to CLK and an NIH Grant (R01 AI097366) to PAZ.
The authors have declared that no conflict of interest exists.
REFERENCES


