

ABSTRACT
Neanderthal ancestry remains across modern Eurasian genomes, and introgressed sequences influence diverse phenotypes, including immune, skin, and neuropsychiatric diseases. Interpretation of introgressed sequences has focused on alleles derived in the Neanderthal lineage. Here, we demonstrate that Neanderthal introgression also reintroduced thousands of ancestral hominin alleles lost in the Eurasian out of Africa bottleneck. Combining evolutionary simulations, expression quantitative trait loci (eQTL), massively parallel reporter assay (MPRA) data, and in vitro validation, we show that reintroduced alleles (RAs) have different fitness effects than Neanderthal-derived alleles (NDAs) and that some RAs regulate gene expression independent of NDAs. Illustrating the broad potential influence of RAs, we find that over 70% of known phenotype associations with NDAs are equally associated with RAs. Finally, we discover enrichment for RA eQTL activity in several tissues, with strongest enrichment in the brain. In summary, our study reveals that Neanderthal introgression supplied Eurasians with many lost functional variants and demonstrates that RAs must be considered when evaluating the effects of introgression.
ONE SENTENCE SUMMARY Neanderthal interbreeding with modern humans restored to Eurasians, hundreds of thousands of ancient alleles that were lost in the out of Africa bottleneck.
MAIN TEXT
Modern Eurasian populations have significantly lower genetic diversity than modern African populations, despite having larger census population sizes (1, 2). This disparity reflects the severe genetic bottleneck experienced by the direct ancestors of Eurasian anatomically modern humans (AMH) as they moved out of Africa approximately 50,000 years ago (2, 3). The effective population size of this ancestral Eurasian population is estimated to have been less than 20% of the size of the contemporaneous African population (1, 4). As a result of this bottleneck, millions of ancient alleles were lost in the ancestors of Eurasians.
More than 500,000 years prior to the Eurasian out of Africa (OOA) bottleneck, members of other hominin groups in Africa, including the ancestors of Neanderthals and Denisovans, also moved into Eurasia (5). Neanderthals and other descendants of these groups inhabited large parts of Eurasia for hundreds of thousands of years prior to the Eurasian OOA migration. The sequencing of ancient DNA from Neanderthal and Denisovan individuals has enabled reconstruction of their genomes (5–7). Comparing Neanderthal genomes to genomes of modern humans from around the world revealed that Eurasian AMHs interbred with Neanderthals approximately 50,000 years ago (5, 8). The legacy of this archaic introgression is reflected in the genomes of modern Eurasians, where 1-3% of DNA sequence in individuals is of Neanderthal ancestry (9–12).
Neanderthal introgression introduced many new alleles into Eurasian populations that were derived on the Neanderthal lineage. It has been hypothesized that some of these alleles were adapted to non-African environments and thus were beneficial to Eurasian AMH (9, 10, 13–18). However, Neanderthal interbreeding also likely came with a genetic cost due to accumulation of weakly deleterious alleles in their lineage, because of their lower effective population size compared to AMHs (19, 20). Indeed, the distribution of archaic ancestry across modern Eurasian genomes is non-random, with significant deserts of Neanderthal ancestry as well as many genomic regions in which Neanderthal ancestry is common. This distribution is generally attributed to the long term effects of positive and negative selection acting on introgressed Neanderthal alleles (9, 10, 21), with negative selection acting most strongly immediately after admixture (22).
For those Neanderthal haplotypes that remain in modern Eurasian populations, introgressed alleles are associated with diverse traits, including risk for skin, immune, and neuropsychiatric diseases (13, 14, 23–26). Notably, an introgressed Neanderthal haplotype at the OAS1 locus influences innate immune response; however, this haplotype also contains an ancient hominin allele in high linkage disequilibrium (LD) with the Neanderthal alleles that could influence function (27). Thus, while most studies have focused on identifying and testing the effects of Neanderthal derived alleles in AMHs, archaic admixture may also have served as a route by which more ancient functional alleles reentered the genomes of Eurasians (27, 28).
Here, we explore the hypothesis that Neanderthal introgression reintroduced into Eurasians functional alleles lost in the Eurasian OOA bottleneck. To evaluate this hypothesis, we analyze archaic, modern, and simulated genomes to characterize the prevalence and functional influence of the reintroduction of alleles lost in the Eurasian OOA bottleneck. Our results conservatively identify more than 200,000 lost alleles that were reintroduced on introgressed Neanderthal haplotypes in modern Eurasian populations. We demonstrate functional effects for many reintroduced alleles using computational analyses, cross-population comparisons of eQTL, and MPRA data. We then experimentally validate the gene regulatory effects of a reintroduced allele independent of associated Neanderthal alleles in the context of both African and Eurasian haplotypes. Finally, we discover enrichment for reintroduced alleles among introgressed alleles with gene regulatory effects in several tissues, including the brain. Taken together, our results demonstrate that Neanderthal populations served as reservoirs of functional ancestral alleles that were lost to Eurasian ancestors in the OOA bottleneck, and that some of these alleles have functional effects in Eurasians after being reintroduced by Neanderthal admixture.
RESULTS
To illustrate the evolutionary scenarios we investigate here, consider the simple model of recent hominin demography presented in Figure 1A. Many alleles segregating in ancestral hominins were lost to Eurasians in the OOA bottleneck. However, some of these alleles were likely maintained in Neanderthal populations whose ancestors also split from this hominin lineage, nearly half a million years before the ancestors of Eurasians. These alleles thus had the potential to be reintroduced into Eurasian populations via archaic admixture. Within these populations, reintroduced alleles would initially only be present on introgressed Neanderthal haplotypes, and over time many would retain high LD with Neanderthal-derived alleles in modern Eurasians. In the following, we will refer to alleles that were present in the most recent common ancestor of AMHs and Neanderthals as “ancestral hominin alleles.” We will refer to introgressed alleles that were present in this ancestral population, but lost in Eurasians as reintroduced alleles (RAs). We will refer to introgressed alleles that first appeared on the Neanderthal lineage as Neanderthal-derived alleles (NDAs) (Figure 1B). In the following analyses, we evaluate the presence and function of RAs in modern Eurasians.
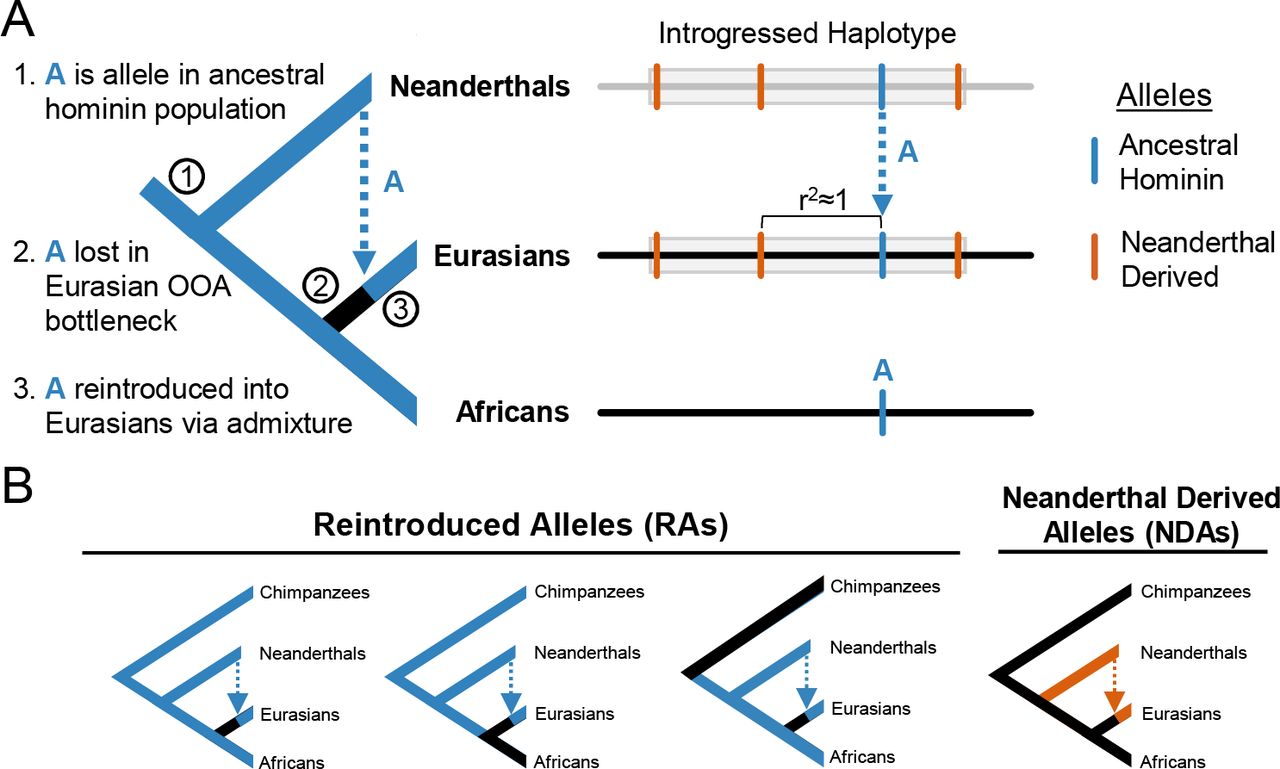
(A) Illustration of the evolutionary trajectory and resulting genomic signature of an allele A (blue) that was: (1) segregating in the ancestors of modern humans and Neanderthals, (2) lost to the ancestors of Eurasians in the human OOA bottleneck, and (3) reintroduced to Eurasians through Neanderthal admixture. Consequently, reintroduced alleles (RAs) are expected to be in high linkage disequilibrium with some Neanderthal-derived alleles (NDAs; orange) in introgressed haplotypes (gray) in modern Eurasians. (B) Schematics of the different evolutionary histories of interest in this paper. All alleles lost in the Eurasian OOA bottleneck and reintroduced by Neanderthal introgression are referred to as RAs. Alleles that appeared in the Neanderthal lineage, were not present in the ancestors of humans and Neanderthals, and only exist on introgressed haplotypes in modern humans are referred to as Neanderthal-derived alleles (NDAs).
Neanderthal introgression likely reintroduced alleles lost in the Eurasian OOA bottleneck
To explore the likelihood of the reintroduction of alleles lost in the OOA bottleneck via archaic introgression, we performed forward-time evolutionary simulations. Our demographic model follows the trajectories of variants from an ancestral hominin population through the splitting off of ancestral Neanderthals, the Eurasian human OOA bottleneck, Neanderthal introgression into the early Eurasian population, and finally the exponential growth of the modern Eurasian population (Figure S1). Our model uses linkage architectures, mutation rates, and demographic characteristics described previously (20).
These simulations consistently showed that under two archaic admixture fractions (f= 0.02 and 0.04), between one and two percent of ancestral hominin alleles segregating in modern Eurasians were present exclusively through reintroduction by Neanderthal introgression (Table S1). We estimated the frequency of false signatures of reintroduction due to confounding mutations within the Neanderthal lineage that match an allele lost in the Eurasian OOA; such convergent mutations are extremely rare (<0.0006% of RAs; Figure S2, Methods). Furthermore, the recombination of Eurasian alleles onto introgressed haplotypes followed by their loss on other backgrounds is also extremely rare (<1% for all scenarios, Table S2).
RAs occurred at approximately one-half the frequency of NDAs in simulated modern Eurasians, and the RA:NDA ratio was robust to changes in the admixture fraction used in the model (Figure 2A). Thus, extrapolating from the hundreds of thousands of NDAs that persist in modern Eurasian genomes, our simulations predict that Neanderthal introgression of alleles that were lost in the Eurasian OOA bottleneck was common.
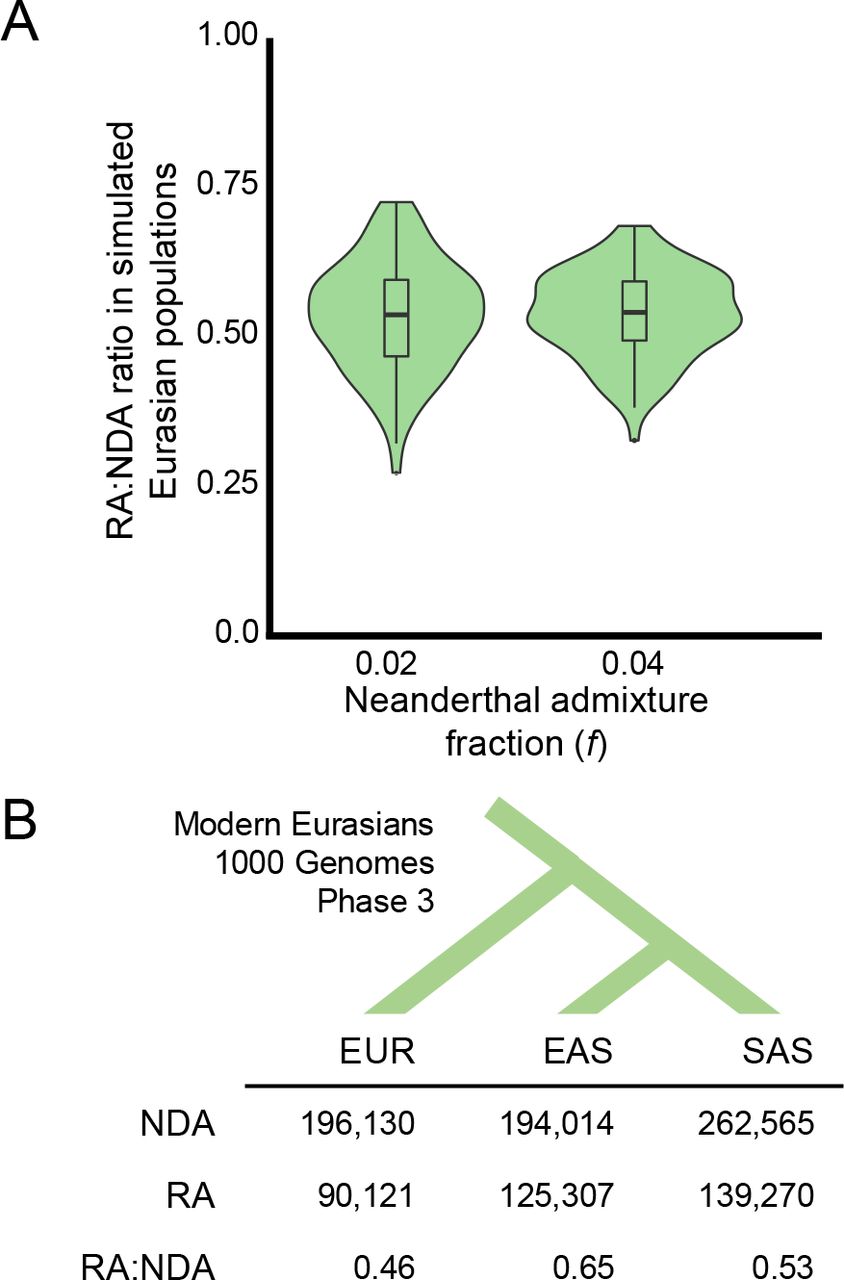
(A) The ratios of RAs to NDAs over 100 simulated Eurasian populations. The simulations predict approximately one RA for every two NDAs, and these estimates are robust to changes in the simulated Neanderthal admixture fraction. Misclassification of non-RAs as RAs due to independent, convergent mutations is extremely rare (Figure S2) and the overall false discovery rate for LD-based RA identification is below ~1% (Table S2). (B) The number of RAs and NDAs in each Eurasian 1000 Genomes population (EAS = East Asian; EUR = European ancestry; SAS = South Asian) identified by our pipeline (Figure S3; Methods). Neanderthal admixture reintroduced over 200,000 alleles lost in the human OOA bottleneck into the ancestors of 1000 Genomes populations, and the observed RA-to-NDAs ratio is consistent with the simulations.
Hundreds of thousands of RAs exist in modern Eurasian populations
To conservatively identify candidate RAs in the genomes of modern Eurasians, we sought variants in 1000 Genomes Phase 3 Eurasian populations that are present only on introgressed haplotypes (Figure S3, Methods). We began with sets of tag SNPs on introgressed haplotypes previously identified by S* and comparison to Neanderthal genomes in European (EUR), East Asian (EAS), and South Asian (SAS) populations (12). For each population, we identified candidate RAs by collecting variants that are in perfect LD (r2=1) with a Neanderthal tag SNP, but that are not tag SNPs themselves. We then evaluated each of these candidate RAs with regard to its ancestral status and presence in modern sub-Saharan Africans. Candidate alleles that match the high-confidence ancestral allele call from 1000 Genomes or that are present at a frequency of >1% in sub-Saharan African populations without substantial Neanderthal ancestry were deemed RAs. We note that this approach is likely conservative, because many true RAs no longer retain perfect LD with any NDA.
Altogether, we identified 209,176 RAs (Figure 2B). The South Asian and East Asian populations each have more RAs (139,270 and 125,257 respectively) than the European populations (90,121). These numbers reflect the larger number of Neanderthal tag SNPs found in the Asian populations (Figure S3, Figure S4) and are consistent with the greater levels of Neanderthal ancestry previously observed in East Asians. However, current estimates suggest that it is only ~12-20% greater (29). The observed ratios of RAs to NDAs within each population (0.46-0.65) were qualitatively consistent with the ratios predicted from the simulations (Figure 2B).
A substantial fraction of RAs (EAS: 22%, EUR: 30%, and SAS: 28%) are present in human populations exclusively in genomic regions of Neanderthal ancestry; i.e. these alleles are not present in African populations. This suggests that the non-reintroduced allele became fixed at these positions in AMH populations before the reintroduction of the other ancestral allele via Neanderthal admixture.
Next, we examined the distribution of RAs across introgressed haplotypes: 84.4% (EAS), 81.8% (EUR), and 81.7% (SAS) of introgressed haplotypes contain RAs. The average number of RAs per introgressed haplotype is ~17. (Figure S5A). Of the haplotypes containing RAs, 21.3% (EAS), 11.8% (EUR), and 15.2% (SAS) contain more RAs than NDAs. RAs also have greater heterogeneity in their distributions across haplotypes, and appear more clustered than NDAs (Figure S5B,C). These results likely underestimate the true number and distribution of RAs; nonetheless, they demonstrate the existence of RAs and the potential for RAs to influence the function and evolution of most introgressed haplotypes.
RA-containing introgressed haplotypes are associated with anthropometric human traits and disease risk
To update knowledge of human phenotypes influenced by Neanderthal introgression, we intersected all RAs and NDAs from each of the three Eurasian populations with the variants reported in the GWAS Catalog as of July 23, 2018 (30). Overall, Eurasian RAs tagged 270 unique associations, 88 of which were genome-wide significant (P < 10−8). NDAs tagged 357 unique associations, 129 of which were genome-wide significant (File S2).
Patterns of LD prohibit the implication of the RAs, the associated NDAs, or other variants as causal. However, 68% of NDAs significantly associated with at least one phenotype are in perfect LD with at least one RA. The consequence of this is that over 70% of the phenotype associations with NDAs have an equally strong association with an RA. Thus, while previous studies have used GWAS to link variants on introgressed haplotypes with phenotypes (5, 6, 9), many associations could be mediated by RAs. By considering a larger set of variants in LD with Neanderthal tag SNPs, RAs, and updates to the GWAS catalog, we identify many additional associations between introgressed alleles and phenotypes in modern populations.
Many of the phenotypes directly tagged by RAs are morphometric (e.g., cranial base width, BMI, and height), and several others relate to more general aspects of outward appearance (e.g., chin dimples, male-pattern baldness, and skin pigmentation). Introgressed RAs are also associated with many pathologies, including cancers (breast, esophageal, lung, prostate), Alzheimer’s disease, and neurological conditions like neuroticism and bipolar disorder (File S2).
Several RAs that are no longer present within sub-Saharan African populations have associations with traits. These RAs are particularly interesting, because they represent loci at which derived alleles became fixed in modern human populations after the split from ancestors of Neanderthals. For example, an RA (rs11564258) near MUC19, a gel-forming mucin expressed in epithelial tissues with a potential role in interaction with microbial communities, is strongly associated with both Crohn’s disease and inflammatory bowel disease (31, 32). This locus has been identified in scans for potential adaptive introgression (18). We also find associations with facial morphology, body mass index, sleep phenotypes, and metabolite levels in smokers (33–37).
RAs and NDAs have different fitness effects
RAs and NDAs reflect different evolutionary histories. NDAs arose in Neanderthal populations with small effective population size and only came into the AMH genomic context via admixture ~50,000 years ago. As a result, there was likely a substantial genetic cost to the introgression of NDAs into Eurasian populations (19, 20). In contrast, RAs arose in relatively larger ancestral hominin populations and are more ancient than the NDAs. Thus, we hypothesized that RAs and NDAs would have different distributions of fitness consequences in modern human populations, with NDAs more likely to be deleterious than RAs.
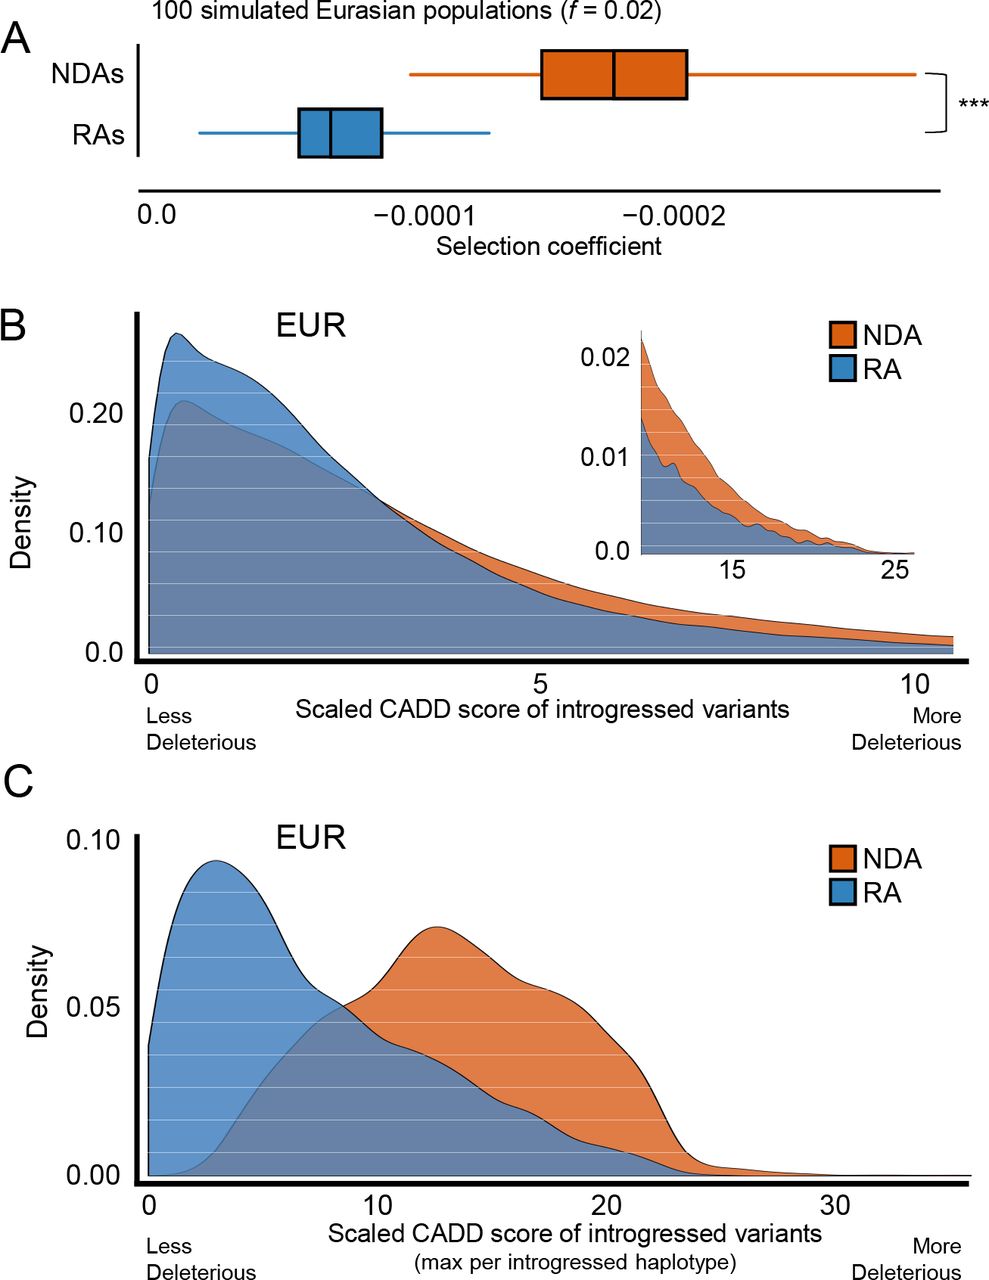
We first explored the support for this hypothesis with evolutionary simulations. In 100 simulated modern Eurasian populations, NDAs were the most deleterious class of alleles, and RAs had significantly less extreme effects (median selection coefficient RA=−7.7e-5; NDA=−1.9e-4; p ≈ 0, Wilcoxon Rank Sum test, Figure 3A). This result was not sensitive to admixture fraction (Figure S6). As expected, among all segregating alleles present in simulated Eurasian populations, African alleles that passed through the Eurasian OOA bottleneck had the least deleterious fitness effects. Thus, supporting previous studies, Neanderthal admixture likely introduced weakly deleterious NDAs into admixed populations (19, 20). However, this hybridization simultaneously reintroduced a host of more ancient RAs that Eurasian ancestors lost during their journey out of Africa and our simulations suggest these have fitness effects which are intermediate to those of AMH alleles maintained in Eurasians and NDAs.

(A) Simulations identify weak selection against both NDAs and RAs, but the RAs persisting in modern Eurasian populations were consistently less deleterious than NDAs over 200 simulations (median selection coefficient RA=7.7e-5; NDA=1.9e-4, P ≈ 0, Wilcoxon rank sum test). (B) In modern Eurasian populations, RAs are predicted to be significantly less deleterious than NDAs by CADD (median scaled CADD: NDA=2.7; RA=2.1; P ≈ 0). The upper tail of highly deleterious mutations is highlighted in the inset. Results are similar for unscaled scores. (C) At the haplotype level, the maximum RA CADD score per haplotype is significantly lower than for NDAs (median scaled max CADD: NDA=13.3; RA=5.8; P ≈ 0). This is in part due to the overall difference demonstrated in (B) and to the greater number of NDAs per haplotype. RAs are rarely the most deleterious variant per haplotype. Results shown are for Europeans (EUR); results in East and South Asian populations are similar (Figure S7, Figure S8).
We then tested these simulated predictions in real genomic data by comparing the predicted deleteriousness scores of RAs and NDAs. Combined Annotation-Dependent Depletion (CADD) is a variant annotation tool that integrates variant attributes and effect predictions from other tools, and then assigns a single score based on a statistical model trained on real and simulated variants (38). The scaled CADD scores for the RAs were significantly lower (less deleterious) than for NDAs in each population (median scaled score: NDA=2.67; RA=2.23; P ≈ 0, Wilcoxon Rank Sum test; Figure 3B, Figure S7). NDAs were nearly twice as prevalent among the most deleterious of all variants (CADD score > 10).
To evaluate the potential effects of RAs and NDAs at the introgressed haplotype level, we repeated these analyses considering the maximum CADD scores for RAs and NDAs within each haplotype. Overall, the most deleterious RA in a haplotype is significantly less deleterious than the most deleterious NDA (median scaled CADD score: NDA=13.34; RA=5.79; P ≈ 0; Figure 3C). This is the result of both the greater number of NDAs per haplotype and differences in the CADD score distributions between NDAs and RAs (Figure 3B). Given the strong LD between variants on each introgressed haplotype, it is informative to quantify these distributions at the haplotype level. Indeed, for over 60% of introgressed haplotypes, the maximum NDA score falls in the top 10% of the most deleterious variants genome-wide (scaled scores above 10); only 0.23% of introgressed haplotypes have maximum RA score in this range. Taken together, both simulation and analyses of observed variants argue that the NDAs are more likely to be deleterious than the more ancient RAs, especially when viewed within the context of introgressed haplotypes themselves. Therefore, as expected from their different evolutionary histories, the fitness effects of RAs are likely different from NDAs.
In spite of these differences in estimated fitness effects, RAs and NDAs were similarly likely to overlap functional gene regulatory elements according to RegulomeDB, a variant annotation tool that integrates known and predicted regulatory elements (39). In total, 19,882 RAs are predicted to influence gene regulatory elements; this fraction is nearly identical to the estimate for NDAs (Figure S9; 10.0% vs. 10.1%, P = 0.07). These results suggest that RAs and NDAs have similar relevance to gene regulation, and they are not confounded by LD.
Some RAs have conserved regulatory associations in European and African populations
Given the high LD between RAs and NDAs, it is challenging to determine from genetic association data alone whether a particular RA or NDA is functional. To search for RAs that are functional independent of associated NDAs, we considered cross-population eQTL data from lymphoblastoid cell lines (LCLs) from European (EUR) and sub-Saharan African Yoruba (YRI) individuals (40). We tested European RAs for shared eQTL activity in Europeans and Yoruba (Figure 4A). Because sub-Saharan African populations have little to no Neanderthal ancestry, no alleles in these populations are in LD with NDAs. Thus, if an allele that was reintroduced into Eurasians shows similar effects on gene expression in both populations, it strongly suggests that that the RA influences expression, and that introgression reintroduced ancestral regulatory function.

(A) Conceptual model of restored regulatory function resulting from Neanderthal admixture. Here, allele A is a cis-acting regulatory variant that is exclusively found on introgressed haplotypes (gray) in modern Europeans (EUR). Allele A is also present in sub-Saharan Yoruba individuals (YRI) lacking Neanderthal ancestry. It displays similar cis-regulatory activity in both populations. This pattern suggests that allele A is an RA in Eurasians and that it influences gene regulation independent of the associated NDAs. (B) Two examples of genes (SDSL and HDHD5) with consistent expression differences (measured in RPKM) associated with RA eQTLs in EUR and the corresponding allele in YRI LCLs. The RAs are present only on introgressed haplotypes in EUR, and the NDAs associated with the RAs are not present in YRI. This suggests that these RAs restore lost gene regulatory functions in Europeans. (C) Schematic of the HDHD5 locus highlighting the locations of one NDA (orange) and four RA eQTLs (blue) in the introgressed haplotype and the different combinations of these alleles present in EUR, YRI, and Neanderthals. (D) Luciferase activity driven by constructs carrying different combinations of alleles present in the HDHD5 locus. We assayed four constructs containing: 1) no introgressed alleles, 2) only the NDA, 3) only the RAs, and 4) all introgressed variants. Results are summarized over three replicates. As expected from the eQTL data, constructs lacking RAs drive significantly stronger expression (~2x baseline) than constructs containing RAs (~1x baseline; two-tailed t-test, P < 0.01 (**) and P < 0.001 (***)). The regulatory effect of the RAs is independent of the presence the NDA found in introgressed EUR haplotypes. (E) Regulatory activity in a massively parallel reporter assay (MPRA) for the four HDHD5 RA eQTLs reveals that rs71312076 has significant regulatory effects when placed in the non-introgressed European background sequence. The other three RAs did not drive significant regulatory activity.
In the LCL eQTL data derived from both EUR and YRI individuals, we identified 42 significant cross-population RA eQTLs. These RA eQTLs influence the expression of nine genes (Table S3). The expression differences observed for the RAs in EUR have the same direction of effect and similar magnitude as those observed for the corresponding allele in YRI. For example, two genes, SDSL and HDHD5, each have four cross-population RA eQTLs that have similar effects on gene expression in both EUR and YRI (Figure 4B). Given the low sample size, limited power, and limited cellular scope of the cross-population eQTL data, it is challenging to estimate the full extent to which RAs contribute regulatory function. Nonetheless, these results suggest that many RAs are functional in Eurasian individuals.
RAs can influence expression independent of NDAs
To evaluate if RAs directly influence expression in EUR individuals, we functionally dissected the regulatory activity of an introgressed haplotype containing cross-population RA eQTLs. HDHD5 (also known as CECR5) is a hydrolase domain containing protein that is expressed in diverse tissues. It is located in a region of chromosome 22 associated with Cat Eye Syndrome (CES), a rare disease associated with chromosomal abnormalities in 22q11 with highly variable clinical presentation that often includes multiple malformations affecting the eyes, ears, anus, heart, and kidneys (41). The HDHD5 locus contains an introgressed 2 kb region that carries an NDA that is in perfect LD with four RAs that are cross-population eQTLs for HDHD5 (Figure 4C).
We performed luciferase reporter assays in LCLs on four different versions of the region that contains the NDA and RA eQTLs (Figure 4D, Table S5). First, we evaluated the luciferase activity driven by a reporter construct with the European version of this sequence without introgression (EUR-EUR). This sequence drove significant expression above baseline (~2.0x vector with no insert, P < 0.01, t-test). We compared this activity to constructs synthesized to carry the RAs with the associated NDA (NDA-RA), the RAs without the NDA (EUR-RA), and the NDA without the RAs (NDA-EUR). Both RA-containing sequences drove significantly lower luciferase activity, and there was no significant difference in the activity of the NDA-RA and the EUR-RA sequences (Figure 4D). Thus, as predicted by the cross-population eQTL data, the RA locus influences expression independently of the associated NDA, and the RA-containing sequences have lower activity than sequences without the RAs.
To ascertain whether the conservation of activity patterns we demonstrated at the HDHD5 locus could be specifically attributed to one of the four RAs, we analyzed MPRA data from LCLs (42). The MPRA simultaneously evaluated the regulatory potential of candidate variants in LCL eQTL to identify causal variants. Only one of the four cross-population RA eQTL (rs71312076) showed significant regulatory effects (RA:EUR allelic skew=2.122, P=6.6e-3, FDR=0.034) compared to the non-reintroduced allele (Figure 4E). These effects were observed on the non-introgressed European reference background, further demonstrating the ability of this RA locus to influence regulation independent of NDAs.
Together, these results provide three orthogonal lines of evidence (cross-population eQTL, luciferase reporter, and MPRA) implicating RAs in the reintroduction of regulatory effects in the HDHD5 locus. Importantly, both our luciferase assays and the MPRA data show that the functional contribution of RAs within a European genomic context is not dependent on the introgressed haplotype in which it occurs. Therefore, these data, along with the eQTL status of this region in YRI, demonstrate that Neanderthal introgression restored an allele lost in the Eurasian OOA bottleneck that influences gene regulation.
RAs are enriched for gene regulatory effects in brain tissues
Introgressed haplotypes have been previously shown to modulate gene regulation, especially in the brain (24, 43). Given that we have now demonstrated that RAs can reintroduce lost gene regulatory functions and that RAs and NDAs likely have different distributions of fitness effects, we evaluated whether RAs were enriched among introgressed eQTL in any of the 48 tissues profiled in v7 of the Genotype-Tissue Expression (GTEx) project (44). Here we only analyzed European RAs and NDAs due to the strong European ancestry bias in GTEx.
Introgressed eQTL are found in all GTEx tissues, and 18% (16,318) of EUR RAs are eQTLs in at least one tissue. However, by definition each RA is associated with at least one NDA, and 16% (31,822) of NDAs are eQTLs in at least one tissue. Therefore, to identify tissues in which RAs are disproportionately associated with observed regulatory effects, we tested for RA enrichment among all introgressed eQTLs in each tissue. Accordingly, we calculated an odds ratio (OR) for each GTEx tissue based on the status of introgressed variants as RAs vs. NDAs and as eQTLs in that tissue (Methods).
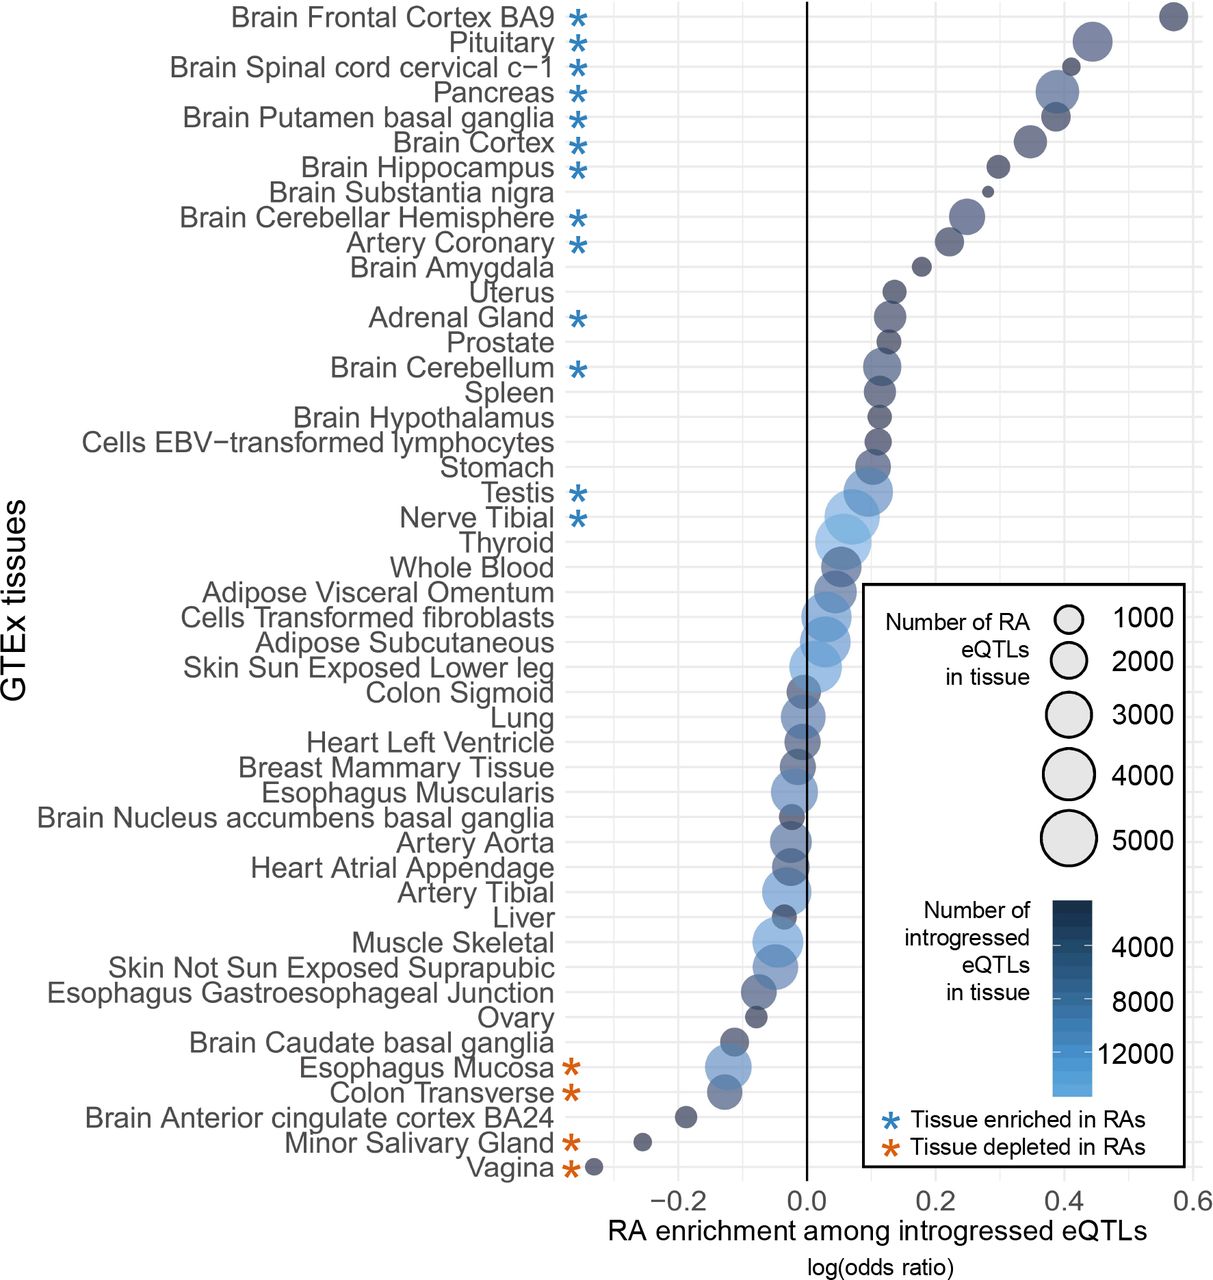
Thirteen of the 48 tissues are significantly enriched for RAs among all introgressed eQTLs (P < 0.01, hypergeometric test after Bonferroni correction), and four tissues are significantly depleted of RA eQTL (Figure 5). Brain tissues appear enriched among the RA eQTL enriched tissues (7 of 13, P = 0.0144, hypergeometric test), though there is likely shared regulatory architecture among brain regions. In brain, the strongest enrichment of RA eQTLs is in the frontal cortex, while the greatest overall number occurs in the cerebellar hemisphere. RA eQTLs are also significantly enriched in the pituitary gland, pancreas, adrenal gland, testes, and tibial nerve. RAs are significantly depleted in esophagus, colon, salivary gland, and vagina. These enrichments and depletions reflect the interplay between eQTL status and LD among the introgressed alleles. Given that all RAs are in perfect LD with at least one NDA, this suggests that the presence of RAs on an introgressed haplotype influences the likelihood of regulatory activity in some tissues, and that there are different pressures on RA-containing introgressed haplotypes in different tissues.
Bubble plot quantifying the enrichment for eQTL activity among EUR RAs compared to all introgressed eQTL in each GTEx v7 tissue. Enrichment was quantified with an odds ratio for each tissue based on the status of introgressed variants as RAs vs. NDAs and as eQTLs. The bubbles are scaled by the number of RA eQTLs in each tissue and colored by the overall number of introgressed eQTLs. Of the 48 tissues considered, RAs were significantly enriched compared to NDA eQTLs in 13 tissues, and significantly depleted in four (P < 0.01, hypergeometric test after Bonferroni correction). The strongest enrichment for RA eQTLs was in the frontal cortex. Brain regions were enriched among the 13 tissues with RA eQTL enrichment (7 of 13, P = 0.0144, hypergeometric test), though we note that some brain regions likely have shared regulatory architecture.
DISCUSSION
Here we demonstrate that thousands of alleles lost in the Eurasian OOA bottleneck had been retained within Neanderthals, and that the presence of these ancient alleles in modern Eurasians is exclusively attributable to archaic admixture between Neanderthals and AMHs (Figure 1A). We further show that RAs and NDAs have different fitness effects, and that some RAs have gene regulatory functions that are not dependent upon associated NDAs. Nevertheless, in spite of the high prevalence of RAs and their potential to independently influence function, interpretation of the phenotypic effects of Neanderthal introgression has generally focused on NDAs. Our results argue that RAs must also be considered in any analyses of archaic admixture.
Our approach identifies more than 200,000 RAs, yet more work is needed to comprehensively identify all RAs in Eurasians. For example, our conservative approach misses true RAs that no longer have perfect LD with the original Neanderthal tag SNPs. Furthermore, thousands of candidate RAs were not classifiable because they lacked a high-confidence ancestral assignment or were not observed in modern Africans. Some of these unclassified variants are undoubtedly ancient, but thus far defy confident characterization due to their complex histories. We expect that more sophisticated simulations and probabilistic modeling could allow for the identification of additional RAs. For example, modeling full chromosomes with detailed recombination maps could be used to assign confidence scores to candidate RAs that are no longer in perfect LD with NDAs. Furthermore, simulations considering additional fitness parameters, mutation rates, and migration patterns could more accurately inform our expectations for the number of RAs in introgressed populations and to evaluate the extent to which RAs could counterbalance the effects of NDAs (45–47). Nonetheless, our simulations and analyses of real genomes agree that RAs are common.
Previous work has implicated the small effective population size of Neanderthal populations as a key factor in their transmission of weakly deleterious NDAs into AMHs via introgression (19, 20, 48). Our observations demonstrate that Neanderthal populations additionally preserved and reintroduced many less deleterious, and perhaps beneficial, ancient alleles (Figure 3, Figure S8, Figure S9). While NDAs and RAs were both carried by Neanderthal populations with low effective population size, the lower probability of deleteriousness among RAs is consistent with many aspects of their evolutionary histories. First, RAs are more ancient than NDAs, and thus selection has had greater opportunity to act on them. Second, the RAs likely arose in a population with relatively larger effective population size (1, 4). Finally, the RAs arose in a genomic background ancestral to and likely more similar to AMHs.
Comprehensive estimation of the total number of functional RAs is challenging due to LD with NDAs and the lack of comparative functional data from diverse cellular contexts and populations. Nonetheless, analysis of known regulatory elements suggests that ~10% (19,882) of RAs are likely to influence transcription factor binding or gene expression (Figure S9). As MPRAs, eQTL analyses, and GWAS are performed in more diverse populations and tissues it will be possible to identify functional RAs on a much broader scale.
Given our demonstration that some RAs restore functions lost in Eurasian populations, the enrichment for RAs relative to NDAs among GTEx eQTLs in many tissues—the brain in particular—is provocative (Figure 5). Brain tissues have enrichment for Neanderthal eQTL (24), and there is significant allele-specific down regulation of haplotypes carrying Neanderthal alleles in the brain and testes (43). Furthermore, these observations are consistent with previous results about the gene regulatory effects of introgressed alleles, and several evolutionary scenarios may be involved. First, the depletion of NDAs relative to RAs on some introgressed haplotypes with gene regulatory functions could be a result of previously demonstrated selection against NDAs in some tissues (43). This selection would deplete tissue specific regulatory regions of NDA-rich introgressed haplotypes; indeed, the two tissues with known allele-specific down regulation of Neanderthal alleles, brain and testes, are enriched for RAs compared to NDAs. Second, the patterns we see could result from positive or balancing selection acting to retain beneficial RAs. Under this scenario, archaic admixture restored alleles with beneficial regulatory functions that were lost during the Eurasian OOA bottleneck, and these RAs contributed to the maintenance of some introgressed haplotypes. The third possibility is that both RAs and NDAs on introgressed haplotypes are functional and influence selective pressures on the haplotypes. In this case, the presence of RAs could counterbalance mildly deleterious effects of associated NDAs, and thus buffer some introgressed haplotypes from purifying selection. Importantly, these explanations are not mutually exclusive, and the reality is likely some combination of all of them.
Overall, we anticipate that the regulatory effects of RAs and NDAs differ between tissues based on the genetic diversity of and strength of constraint on their regulatory landscapes. Interestingly, nervous system tissues (including the brain) and the testes have extreme levels of selection on gene expression (high and low, respectively) (49). Given the range of RA eQTL enrichments across GTEx tissues, including tissues without evidence of selection against Neanderthal alleles, we propose that the presence of RAs and NDAs is the result of a mixture of selective pressures acting within the regulatory constraints of each tissue.
Therefore, whether contributing beneficial effects on their own or serving to mitigate the deleterious effects of NDAs, RAs likely play a functional role across diverse tissues and thus contribute to the persistence of introgressed haplotypes. Disentangling the effects of introgressed eQTLs in high LD will require further experimental evidence along the lines of those we performed at the HDHD5 locus (Figure 4D). In addition, it would be informative to compare the functional effects of RAs with other alleles restored to Eurasian populations by recent direct migration from Africa (22, 50), as well as effects within African populations.
Analysis of RAs is also relevant to studies of the genetics of ancient hominin populations. For example, tens of thousands of RAs that are present in Eurasians have since been lost in African populations. These ancient variants could both inform ongoing debates over differences in efficiency of natural selection between Africa and Eurasia (51–54), as well as provide a window into ancient genetic variation that was present in Africa over a half million years ago.
CONCLUSIONS
Here we show that Neanderthal introgression reintroduced functional alleles lost in the Eurasian out of Africa bottleneck. This illustrates the importance of accounting for shared ancestral variation among hominin populations and shows that hybridization events between populations have the potential to modulate the effects bottlenecks have on allelic diversity. Our findings open several avenues for future work on quantifying the evolutionary and functional dynamics of archaic introgression. Previous analyses of introgression have focused on alleles derived within the Neanderthal lineage. Reintroduced alleles must also be considered in analyses of Neanderthal introgression, at both the haplotype and genome scale. Future studies should account for the potentially beneficial fitness effects of these alleles and their influence on the maintenance of Neanderthal ancestry.
AUTHOR CONTRIBUTIONS
DCR, CNS, EM and JAC conceived and conducted the computational analyses. DS and EH performed the luciferase assays. DCR and JAC wrote the manuscript with input from all authors.
DECLARATION OF INTERESTS
The authors declare no competing interests.
METHODS
Sequence data
Genomic variants were taken from 1000 Genomes Phase 3v5a data (1). Introgressed Neanderthal tag SNPs were downloaded from: http://akeylab.princeton.edu/downloads.html (12). All analyses were conducted using GRCh37/hg19 genomic coordinates.
Evolutionary simulation design
SLiM (v2.6) was used for all evolutionary simulations (55). We used a genomic model taken from previous simulation studies of Neanderthal introgression and mutation load (20). In brief, the human genome is represented by a syntenic, locus-based model constructed considering all exons within the hg19 reference genome. Nucleotide positions of exons are modeled individually while intergenic regions and chromosomal boundaries are modeled as single sites. Recombination is modeled as a probability of 1.0 × 10⁻⁸ crossovers per site per generation, with probabilities in intergenic regions scaled by their respective sizes; chromosome boundaries are modeled as having a recombination rate of 0.5. Mutations are modeled based upon a non-synonymous substitution rate of 7.0 × 10⁻⁹ mutations per site per generation. Fitness effects (FE) were assigned to mutations based either upon a presumption of neutrality (FE=0) or purifying selection (FE drawn from gamma distribution with shape parameter 0.23 and mean selection coefficient −0.043) (56).
The general demographic model through which these genomes were then allowed to evolve is illustrated in Figure S1. Here, genetic diversity within the ancient human population (10,000 diploid individuals) was first established by allowing mutations to arise and equilibrate during a “burn in” period of 44,000 generations in the ancestral hominin population prior to subsequent migrations. To track allelic loss and reintroduction, we focused on segregating sites that were present in this simulated ancestral population immediately before the split between the human and Neanderthal lineages; we tracked all of these ancestral hominin alleles over the 18,000 subsequent generations that encompassed both the Neanderthal and Eurasian OOA bottlenecks.
Then the ancestral Neanderthal population was subsampled to 1,000 individuals and both human (African) and Neanderthal populations were allowed to evolve separately for 16,000 generations (400,000-464,000 years assuming a generation time of 25–29 years). The Eurasian OOA migration and Neanderthal admixture were then modeled as a simultaneous, discreet event that resulted in an admixed Eurasian population size of 1861 individuals (20, 57). The admixed Eurasian population was then allowed to evolve for 2000 generations before it underwent an exponential growth phase leading to modern Eurasians. This final Eurasian population is used to evaluate the presence and properties of RAs.
These simulations were run in parallel. One hundred replicates under both neutral or purifying selection were conducted to establish an estimate of confounding mutations (Figure S2). Eurasian-Neanderthal admixture fractions of both 0.02 and 0.04 were run under the purifying model, with 100 modern Eurasian populations of 20,310 individuals each generated for each admixture fraction.
Quantitating false positives within simulation data
SLiM profiles for all populations were collected at relevant timepoints: t1) Neanderthal OOA, t2) immediately prior to the Eurasian migration, t3) immediately following admixture, and t4) modern human populations. Mutation origin was used to establish when and where (in the genome) a variant arose, and successive timepoints were used to query these mutation IDs for presence/absence.
First, we estimated the rate at which variants could be mis-assigned RA status as the result of independent, convergent origins in African and Neanderthal populations. To infer the frequency of such confounding variants, all variants in simulated human and Neanderthal populations were compared immediately prior to admixture (t2) in each of the 100 replicates for each model. Confounding variants were identified based upon a shared genomic location between existing variants in Africans and variants that arose within the Neanderthal lineage. These counts were then contrasted with the number of non-Neanderthal derived mutations and found to be very rare (Figure S2). Moreover, because SLiM does not consider nucleotide state and allows for “stacked” mutations (i.e., mutations at the same locus), our estimates of false assignment of RA status in this model are conservative because we also considered nucleotide state in the real data.
Second, we evaluated the reliability of requiring perfect LD between RAs and NDAs in modern Eurasian populations in the inference of RA status. It is possible that non-Neanderthal alleles could have recombined on to introgressed haplotypes and subsequently been lost outside of the introgressed context. We reasoned that this scenario would be very unlikely, but to test this we examined each of the simulated Eurasians (t4) and extracted all variants in perfect LD with an NDA in modern Eurasians. We then queried the simulation data from t2 to count how many of these candidate RA variants were not present on a Neanderthal haplotype. These variants in perfect LD with an NDA in modern Eurasians that were not present in Neanderthals (and that had not independently evolved within Eurasians) would be incorrectly inferred to be RAs by our approach. Fortunately, these events were very rare (1% of RAs or fewer) for each admixture fraction (Table S2). Furthermore, these false discovery rates are likely overestimates since in the real data, RAs most frequently appear within introgressed haplotypes, with linked NDAs present on both sides. This would require confounding recombination events to occur twice, with all the confounding alleles then being subsequently lost on all, non-introgressed haplotypes to maintain perfect LD. In the future, we anticipate that these simulations can be refined to confidently identify more RAs that have less than perfect LD with NDAs.
Estimating RA presence and selection coefficients in modern Eurasians from simulation data
To quantify the frequency of RAs in modern Eurasian populations we first defined “ancestral hominin variants” as those alleles segregating in the simulated population immediately prior to the Neanderthal split ~500,000 years ago (t2). In the SLiM simulations, we tracked these segregating ancestral variants through the Neanderthal lineage and into the modern Eurasian population. We used SLiM’s mutation identifiers to track these ancestral variants through Neanderthals and into modern Eurasians over the course of 100 replicates for each of two admixture fractions (0.02 and 0.04). From these 200 introgressed Eurasian populations data we were able to identify all the ancestral variants that passed into AMHs exclusively through 1) the Eurasian OOA migration or 2) archaic admixture with Neanderthals. Only variants in the second category were considered to be RAs within the context of the simulation. We extracted allele counts and selection coefficients (admixture models were run only under purifying selection) for these RA variants from the SLiM output. We then did the same for the simulated NDAs, the only other class of variants that entered the modern Eurasian populations exclusively through Neanderthal introgression. These data are summarized and contrasted in Figure 2A and Figure 3A.
RA candidate identification and classification from 1000 Genomes data
To generate a set of candidate RAs, we gathered Neanderthal “tag SNPs” identified in each of the three, 1000 Genomes Eurasian super-populations (EUR, EAS, SAS; http://akeylab.princeton.edu/downloads.html). We then calculated LD using vcftools (58) for all variants in +/−500 kb windows around each variant across individuals from these super-populations in Phase 3 of the 1000 Genomes project. We extracted all variants that were in perfect LD (r2=1) with any Neanderthal tag SNP in any of EUR, EAS, or SAS.
For each candidate RA (i.e., variant in perfect LD with a Neanderthal tag SNP), we: 1) extracted the ancestral allele call from 1000 Genomes, 2) ascertained whether the designated REF or the ALT allele was the introgressed variant (i.e., in LD with the Neanderthal tag SNP), 3) calculated the introgressed allele frequency, 4) calculated the allele frequency for the introgressed allele in sub-Saharan African 1000 Genomes populations (ESN, GWD, LWK, MSL, YRI), and 5) extracted the Altai Neanderthal genotype. We then called RA status based on this information (Figure S3). For each RA candidate, if the introgressed variant matches the high-confidence, ancestral state, it is classified as an RA, more specifically a reintroduced ancestral allele (RAA). Candidate RAs that do not match or have a high confidence ancestral allele call are evaluated for presence in both the Altai Neanderthal and in sub-Saharan Africans (allele frequency > 1%). If the variant is only present in the Altai Neanderthal, it is classified as an NDA. If the candidate variant is only present in sub-Saharan African at a frequency > 1%, it is classified as an RA and assigned to the sub-class of reintroduced hominin alleles (RHA), given that its origin likely predates the Neanderthal split but its state in the human-chimp ancestor is not known. If the candidate RA is present in both the Altai Neanderthal and sub-Saharan Africans, it is classified as an RA (also of the sub-class RHA). For nearly all analyses, RHAs and RAAs are treated as a single RA class. The results of this classification are summarized in Figure 2B and supplied in full in File S1. The pipeline and filtering steps are summarized in Figure S5.
We did not constrain our search for RAs to the bounds of previously identified introgressed haplotypes. While approximately 90% of RAs are within the boundaries of previously characterized introgressed haplotypes, over half of the haplotypes in each population have at least one associated RA beyond their previous bounds. In total, extending all introgressed haplotypes to accommodate all associated RAs increases introgression estimates by 40.0, 42.6, and 51.9 megabases (Mb) in the EUR, EAS, and SAS populations, respectively. This represents an increase of ~1.5% in the amount of introgressed sequence present in each Eurasian population.
Spatial characterization of RAs and NDAs along introgressed haplotypes
The locations and distributions of RAs within introgressed haplotypes appeared more independent of haplotype length and more clustered than the distribution of NDAs. The number of NDAs per haplotype is strongly positively correlated with the length of the haplotype (r2 = 0.85; Figure S5), but the RA content of a haplotype is more variable (r2 = 0.56). Therefore, while the overall RA:NDA ratio is ~1:2 over all haplotypes (Figure 2), the RA content of any specific introgressed haplotype cannot be reliably inferred from the number of NDAs present.
To evaluate whether RAs are more clustered on introgressed haplotypes than NDAs, we summarized the distribution of both NDAs and RAs across all RA-containing haplotypes. We first divided each RA-containing haplotype into 100 equal-size bins and counted the number of RAs in each bin. For each haplotype, the bins were then ranked from high to low in terms of RA count, and the RA contents of each corresponding percentile bin were summed over all the haplotypes. This percentile sum was then divided by the total number of all RAs present over all the haplotypes to obtain per-bin densities. By calculating per-bin densities only at the end, we mitigate the potentially confounding effect of some haplotypes containing fewer variants than others. The result is a summary of the total fraction of RAs found within increasing density percentiles across all haplotypes. We then did the same for NDAs (Figure S5) Overall, a larger fraction of RAs is found in the densest bins compared to NDAs. For example, in EUR, 55% of RAs are in the four densest bins, while only 26% of NDAs are in the four densest bins. These results held across each population and were maintained when down sampling to a set of haplotypes with matched NDA and RA counts. Thus, when RAs are present, they often occur in more discrete clusters along introgressed haplotypes than do NDAs. However, we note that the incomplete ascertainment of RAs and the LD thresholds used to link NDAs may contribute to these patterns.
Computational variant effect estimation
To assess the potential functional impact of RAs, we retrieved precomputed Combined Annotation-Dependent Depletion (CADD) v1.3 scores (https://cadd.gs.washington.edu/download) for all RA and NDA variants. CADD scores are available in two forms: raw and scaled. Raw CADD scores are the output of the model for each variant, whereas scaled scores are PHRED-scaled to the range of values observed over all genomic variants (38). Therefore, the scaled scores communicate how deleterious the effect of a given variant is with respect to the effects seen in all other variants (e.g., a scaled CADD of 20 means that that a variant is within the top 1% of variants as ranked by their predicted deleteriousness). Thus, we focused on the PHRED-scaled scores. We highlight in Figure 2B scaled CADD scores at the upper range (e.g., above 10 or 15) that are likely suggestive of acute pathogenicity. We also compared functional annotation classes downloaded for RAs and NDAs from RegulomeDB v1.1 (http://www.regulomedb.org/).
Functional annotation of RAs
Protein coding
To assess potential functional consequences of RAs in Eurasians, we first explored effects of RAs on protein coding regions. We intersected all NDAs and RAs from each Eurasian population with all coding variants annotated in dbSNP (v150). We then filtered for frameshift, missense, and nonsense variants and constructed a set of non-synonymous, introgressed variants. Overall, less than 1% of all introgressed variants lie in protein coding regions, with 1973, 1682 and 2353 introgressed coding variants in EAS, EUR, and SAS respectively. Within each population, approximately 30% of coding variants were non-synonymous, with very similar proportions of synonymous and non-synonymous variants across each population. Consequently, neither introgressed class was enriched (hypergeometric test) for non-synonymous variants in any of the three populations.
Genome-wide association study hits
We intersected all RAs and NDAs from each of the three Eurasian populations with the variants reported in the GWAS Catalog (as of July 23, 2018). Full results are provided in File S2.
GTEx eQTL enrichment analysis
Expression quantitative trait loci (eQTL) data from GTEx v7 were downloaded from the GTEX portal (https://www.gtexportal.org/home/datasets) and all significant gene-eQTL pairs were extracted for each tissue. We then identified all RAs and NDAs with eQTL status. To test whether
RAs are enriched among the introgressed eQTL for a tissue, we calculated an odds ratio (OR) over all introgressed variants based on RA status and tissue eQTL status:
 where R is the # of RAs that are tissue eQTL; R’ is the # of RA that are not tissue eQTL; N is the # of NDA that are tissue eQTL; and N’ is the # of NDA that are not tissue eQTL. Sets of both R’ and N’ were composed of only those introgressed variants that were present in GTEx output. We tested for enrichment (or depletion) of RAs among introgressed eQTL in each tissue with the hypergeometric test and used the Bonferroni correction to account for the testing of 47 tissues analyzed here (0.01/47=0.0002).
Shared RA eQTLs between Europeans and Africans
To identify RAs with similar regulatory associations between populations with and without Neanderthal ancestry, we analyzed data from a previous study that identified eQTL across LCLs derived from 495 individuals (40). The LCLs were of either European (EUR; 373 lines) or African (YRI; 89 lines) ancestry; given the smaller YRI sample size, there was much lower power to detect eQTL in the African samples. We downloaded all significant exon-level expression eQTLs from the study (https://www.ebi.ac.uk/arrayexpress/files/E-GEUV-1/analysis_results/). They found 704,157 unique eQTL in EUR and 75,742 in YRI, and of these, 52,869 are shared. Of the shared loci, 42 are RAs, and these RAs associate with expression levels for nine genes (Table S3).
MPRA analysis of RAs
A recent MPRA study evaluated the regulatory impact of 32,373 variants in 3,642 known eQTL and regions identified via GWAS (42). For each variant, the MPRA quantified the expression of a reporter driven by both the reference and alternate alleles (plus 150 bp of reference genomic context) in LCLs. Expression modulating variants were identified by quantifying the “allelic skew” between the expression driven by the reference and alternate allele. This enabled the identification of hundreds of variants likely to cause observed associations between these loci and expression levels/phenotypes. To evaluate whether the MPRA data could help evaluate whether RAs have functional effects, we intersected European NDAs and RAs in introgressed haplotypes with the variants with significant combined skew (FDR < 0.1). In total, 11 introgressed variants were tested (6 NDAs and 5 RAs; Table S4). This included all cross-population RA eQTLs in the introgressed haplotype that is associated with HDHD5 expression. Thus, we focused our experimental validation on this locus.
Experimental validation of RA regulatory function via luciferase assays
To further demonstrate that the cross-population RA eQTLs associated with HDHD5 expression function independently of the NDA in perfect LD, we evaluated the effects of four different sequences on luciferase expression in LCLs (Figure 4D).
Modified pGL4 luciferase constructs were generated via Gibson cloning (New England Biolabs) to contain an 1826 bp oligo corresponding to region of interest in CECR5/HDHD5 with variants corresponding to a European reference (EUR-EUR), the introgressed NDA sequence (NDA-EUR), the RA sequences (EUR-RA), or both sets of introgressed variants (NDA-RA) (Table S5). Inserts were cloned into pGL4.27 reporter vector (Promega) as two separate blocks, as b1-EUR or b1-NDA (first 576 bp at the 3’ end of blocks containing either NDA or EUR specific sequence) and b2-EUR or b2-RA (1273 bp at 5’ end of blocks containing either RA or EUR specific sequence) (Table S5). b1-EUR, b1-NDA, and b2-RA sequences were generated by oligonucleotide synthesis (IDT). b2-EUR variants were generated via site-directed mutagenesis using primers with EUR specific alleles (Table S6) and amplified directly from b2-RA oligo as five separate sub-regions. B2-EUR sub-regions were assembled into the pGL4.27 vector and sub-cloned into EUR-EUR and NDA-EUR pGL4 constructs. Inserts were amplified to include NheI and XhoI overhangs to allow for cloning into the pGL4 reporter plasmid. The sequences of full-length inserts were confirmed by Sanger sequencing (Genewiz).
GM11831 B-cells were cultured in RPMI with penicillin/streptomycin and 15% fetal bovine serum. 1×10⁶ GM11831 cells were transfected with 5 ug HDHD5-EUR-EUR-pGL4.27, HDHD5-NDA-EUR-pGL4.27, HDHD5-EUR-RA-pGL4.27, or HDHD-NDA-RA-pGL4.27 along with 500 ng pRL-CMV (Renilla reporter plasmid) via electroporation (Neon Transfection System, Invitrogen). Firefly and Renilla luciferase activity was analyzed using the Dual-Glo Luciferase Assay System (Promega) and Synergy HTX MicroPlate Reader (BioTek) 19 hours post electroporation. Firefly reporter expression was normalized to Renilla luciferase activity. Statistical significance was determined through a two tailed t-test comparing fold change of the normalized luciferase activity over an unmodified (no insert) pGL4.27 reporter control.
Data analysis and visualization
Evolutionary simulations and primary data analysis were conducted on Vanderbilt’s computing cluster (ACCRE). Results were parsed and analyzed with custom python and bash scripts. Statistical tests were performed with R. Plots were generated in R, with most generated using ggplot2.
ACKNOWLEDGMENTS
We thank Ben Haller, Phillip Messer, and Kelley Harris for advice on evolutionary simulations. We thank Ryan Tewhey for discussions of MPRA results. This work was supported by the National Institutes of Health: T32EY021453 to CNS; T32GM080178 to DS; K22CA184308 to EH; and R01GM115836 and R35GM127087 to JAC. This work was conducted in part using the resources of the Advanced Computing Center for Research and Education at Vanderbilt University, Nashville, TN.
REFERENCES


