

ABSTRACT
Mutations in KCNQ2, which encodes a pore-forming K+ channel subunit responsible for neuronal M-current, cause neonatal epileptic encephalopathy, a complex disorder presenting with severe early-onset seizures and impaired neurodevelopment. The condition is exceptionally difficult to treat, partially because the effects of KCNQ2 mutations on the development and function of human neurons are unknown. Here, we used induced pluripotent stem cells and gene editing to establish a disease model, and measured the functional properties of patient-derived neurons using electrophysiological and optical approaches. We find that while patient-derived excitatory neurons exhibit reduced M-current early, they develop intrinsic and network hyperexcitability progressively. This hyperexcitability is associated with faster action potential repolarization, larger afterhyperpolarization, and a functional enhancement of large conductance Ca2+-activated K+ (BK) channels. These properties facilitate a burst-suppression firing pattern that is reminiscent of the interictal electroencephalography pattern in patients. Importantly, we were able to phenocopy these excitability features in control neurons only by chronic but not acute pharmacological inhibition of M-current. Our findings suggest that dyshomeostatic mechanisms compound KCNQ2 loss-of-function and lead to alterations in the neurodevelopmental trajectory of patient-derived neurons. Our work has therapeutic implications in explaining why KCNQ2 agonists are not beneficial unless started at an early disease stage.
INTRODUCTION
The KCNQ2 gene encodes KV7.2 (referred to here as KCNQ2), a voltage-dependent potassium (K+) channel widely distributed in central and peripheral neurons. In most mature neurons, KCNQ2 and the paralogous KCNQ3 protein form heterotetramers (KCNQ2/3) (1). Together these channels mediate the M-current, a slowly activating and non-inactivating voltage-dependent K+ conductance suppressed by Gq protein-coupled muscarinic acetylcholine receptor activation (2). The M-current activates as neurons approach action potential (AP) threshold and acts to dampen neuronal excitability (2,3). Therefore, KCNQ2/3 channels help set the AP threshold, and also contribute to the post-burst afterhyperpolarization (AHP), which limits repetitive firing following bursts of action potentials (4,5). These channels are enriched at the axon initial segment (AIS) and nodes of Ranvier of central and peripheral neurons (6-9), and are also expressed at lower densities at the soma, dendrites and synaptic terminals (8,10,11).
The importance of KCNQ2 in normal brain development and function is underscored by genetic epilepsies associated with this channel. Disorders caused by KCNQ2 mutation include benign familial neonatal seizures (BFNS) characterized by seizures that spontaneously remit within the first year of life (12,13), and the more severe neonatal epileptic encephalopathy (NEE), which may present as Ohtahara syndrome or infantile spasms (14-17). A ClinVar search for KCNQ2 variants with pathogenic, likely pathogenic, conflicting interpretations and uncertain significance results in 552 different variants some of which are recurrent in multiple patients, accounting for approximately 5% of all mutations identified in genetic epilepsy (18,19) and 10% of those associated with early-onset forms of NEE (20). The main features of NEE are developmental and cognitive disabilities, and early onset of severe seizures, occurring within a few days after birth, that are refractory to antiepileptic drugs (21).
The earliest hypothesis to explain epilepsy associated with KCNQ2 mutations posited that loss of KCNQ2 channel function allows for sustained membrane depolarization after a single action potential leading to increased repetitive firing within bursts in excitatory neurons (22). However, some variants associated with severe clinical phenotypes produce gain-of-function effects (23,24). Enhanced K+ conductance, specifically in the AIS, could hyperpolarize the AIS membrane, decreasing steady state inactivation for sodium channels. This would increase the rate of action potential activation and action potential repolarization (25).
The mechanisms by which developmental expression of KCNQ2 channels impact neuronal excitability are not clear. What remains elusive is how the defects in M-current affect the electrophysiological properties of human neurons leading to impaired neurodevelopment. The use of patient-specific induced pluripotent stem cell (iPSC) technology has enabled a new approach for elucidating pathogenic mechanisms of genetic disorders such as the epileptic channelopathies as it allows for the generation of otherwise inaccessible human neurons (26-28). Here, we use KCNQ2-NEE patient-specific and isogenic control iPSC-derived excitatory neurons to elucidate the dynamic functional effects of a prototypical KCNQ2 mutation during differentiation and maturation in culture.
RESULTS
Establishing a Human Neuron Model of KCNQ2 Epileptic Encephalopathy
To investigate the effects of a KCNQ2 genetic variant in human neurons, we generated iPSC lines from a 7-year old male clinically diagnosed with KCNQ2 NEE. The subject exhibited seizures on the first day of his life (29), and had treatment-resistant epileptic spasms, myoclonic-tonic seizures and severe developmental delay. Genetic testing identified a de novo KCNQ2 variant (c.821C>T) resulting in a threonine to methionine missense mutation at position 274 (p.Thr274Met; T274M). The threonine residue is highly conserved and located in the pore domain of the protein (Figure 1A). This prototypical mutation has been identified in at least 5 individuals diagnosed with NEE (ClinVar).

(A) Proposed structure of KCNQ2 channel subunit containing the patient mutation T274M (yellow star) near the ion selectivity filter within the pore-loop domain. (B) DNA sequence electropherograms of KCNQ2 in control and patient iPSCs before and after gene editing, demonstrate the correction of the heterozygous (T274M; c.821C>T) mutation. A silent mutation (T276T; ACC>ACT) was concurrently introduced in the PAM site (See Supplementary Figure 1 and Supplementary Tables 1-2). (C) Quantification of GFP fluorescence coincident with MAP2 immunopositive staining in two unrelated healthy controls and patient and isogenic control iPSC-derived neurons (See Supplementary Figure 2). Scale bar: 20µm. (D) Western blot analysis of KCNQ2 protein in patient-derived neurons relative to isogenic controls (t-test: *p=0.02; N=2 independent differentiations). TUJ1 quantification indicates that cell lysates contained similar levels of mature neurons. GAPDH was used as a loading control. (E) Left: Representative image of GFP-fluorescing neuron during patch-clamp recording. Right: Experimental protocol. Total steady-state current density and M-current density were measured in voltage-clamp mode after establishing whole-cell configuration. (F) Representative traces recorded from control and patient-derived neurons before XE991 application (top; total current) and after subtraction of XE991-insensitive currents (bottom; XE991 sensitive/M-current). (G) Total and XE991-sensitive current density plotted against test potential. Top, repeated measures ANOVA for total current density during week 4 by cell line: F(2,468)=8.93, ***p=0.0005; cell line/voltage step interaction: F(18,468)=11.11, ###p<0.0001; Fisher’s PLSD posthoc comparing healthy controls (black) to isogenic control (blue) neurons (p=0.7282) and Q2-01T274M/+ (red) to either isogenic control (p=0.0071) or healthy control neurons (p=0.0002). Bottom, M-current density repeated measures ANOVA: F(2,468)=29.83, ***p<0.0001; cell line/voltage step interaction: F(18,468)=33.36, ###p<0.0001; Fisher’s PLSD posthoc test comparing healthy controls to isogenic controls (p=0.9446) and Q2-01T274M/+ neurons to either isogenic controls or healthy controls (p<0.0001; N=21 healthy controls combined). Bottom right: plot of M-current densities from all neurons recorded during 10, 20 and 30mV steps. Number of neurons analyzed is displayed within the figure. Values displayed as mean±SEM.
We generated iPSCs from peripheral blood mononuclear cells (PBMCs) using integration-free, Sendai virus-mediated reprogramming. The resulting iPSCs exhibited a normal male karyotype, typical stem cell morphology, and expressed pluripotency markers, including nuclear NANOG and the cell surface antigen SSEA4 (Supplementary Figure 1, A and B). We validated the presence of the heterozygous mutation in the patient iPSCs by targeted PCR and Sanger sequencing (Q2-01T274M/+; Figure 1B). To create a model that would allow us to attribute any phenotypic differences to the disease-associated genetic variant, we generated an isogenic control iPSC line from the patient-derived line. We specifically corrected the mutant allele using CRISPR/Cas9 genome editing and simultaneously introduced a silent mutation in the PAM site to prevent re-cleavage (Supplementary Figure 1C). We identified a corrected isogenic clonal cell line (Q2-01+/+) that exhibited a normal karyotype (Figure 1B and Supplementary Figure 1B), and found no evidence for off-target edits in any of the top 8 genomic regions with homology to the targeted KCNQ2 exon (Supplementary Figure 1D-E and Supplementary Table 1).
Given the clinical presentation of KCNQ2-associated NEE and the focal source of seizures that reside in the cortex (30,31), we chose to study cortical excitatory neurons, differentiated through a modified Nng2 overexpression protocol (Supplementary Figure 2A) (32,33). We simultaneously differentiated the Q2-01T274M/+ patient line, the engineered isogenic control line, and two iPSC lines generated from unrelated, healthy, sex-matched controls (Supplementary Figure 2B) (34). Co-expression of GFP marked lentiviral-transduced cells, which were co-cultured with primary mouse glia to facilitate in vitro neuronal maturation. To determine the efficiency of differentiation, we used immunocytochemistry (ICC) to quantify the percentage of MAP2 and GFP positive cells (Figure 1C). Over 85% of GFP-positive cells were also MAP2-positive neurons for all iPSC lines (Figure 1C and Supplementary Figure 2C). As previously described (32) we found that these cultures expressed high levels of vGLUT2, FOXG1 and BRN2, that are characteristic of excitatory layer 2/3 cortical neurons (Supplementary Figure 2D and Supplementary Table 2).
Using isoform-specific primers, we detected several KCNQ2 splice variants in the differentiated neuronal cultures by RT-qPCR (Supplementary Figure 2E). To confirm the presence of KCNQ2 protein, we performed Western blot analysis on proteins isolated from neurons cultured for 4 weeks in vitro. We validated that we could detect both the wild type and the T274M mutant KCNQ2 proteins expressed in transfected CHO cells (Supplementary Figure 2F). Unexpectedly, we found that Q2-01T274M/+ patient neurons exhibited significantly higher KCNQ2 protein levels relative to their isogenic controls, suggesting a potential compensatory mechanism (Figure 1D).
KCNQ2-NEE Patient Neurons Exhibit Lower M-Current
Experimental evidence from Xenopus laevis oocytes indicated that pore mutations such as T274M can produce a dominant negative loss of channel function (35). To determine the effect of the T274M KCNQ2 mutation in the context of human neurons, we measured the M-current in week 4 excitatory patient-derived neurons. We recorded the total steady state current in whole-cell voltage-clamp mode, and then blocked M-current by applying the selective KCNQ2/3 blocker XE991. The remaining current was then subtracted from the baseline total current to determine M-current density during the last 100 ms of 1 second voltage steps from −60 to +30 mV from a holding potential of −70 mV (Figure 1E). KCNQ2-NEE patient-derived neurons exhibited a 32% reduction in total current density (p = 0.0005) and a 58% reduction in M-current density (p < 0.0001), as compared to neurons derived from two healthy control iPSC lines (Figure 1F-G). The difference in total current density between controls and patient-derived neurons was equal to the difference in M-current density, indicating the absence of compensatory outward conductances that would be active at the end of the 1-second voltage steps. Importantly, correcting the T274M variant resulted in complete restoration of both total current density (p = 0.7282), as well as M-current density (p = 0.9446) to levels that were not significantly different from healthy control neurons (Figure 1F-G).
KCNQ2-NEE Neurons Exhibit Enhanced Spontaneous Neuronal Network Activity
The KCNQ2 iPSC-based platform we developed presents an opportunity to dissect the functional consequences of chronic M-current impairment during neuronal development in culture. To assess spontaneous neuronal network activity, we used a multi-electrode array (MEA) platform and performed continuous recordings over a 3-week period (days 16-31, N = 4 independent differentiations, N = 40 well wide averages from 64 electrodes per well, per genotype). We plated an equal number of Q2-01T274M/+ and isogenic control neurons and carefully monitored neuronal attachment throughout the time course of experiments (Figure 2A and Supplementary Figure 3A). Neuronal cultures acquired significant spontaneous activity (>10% of the electrodes active) on or after day 19.

(A) Representative images of GFP-fluorescing patient-derived (Right) and isogenic control neurons (Left) plated on MEA wells at 31 days in culture. Scale bar: 200µm (B) Representative raster plots from a single MEA well of patient-derived and isogenic control neurons on day 31. Each row represents the signal detected by a single electrode, black ticks indicate single spikes and blue ticks spikes that occur within bursts. (C) Longitudinal analysis of the mean firing frequency (repeated measures ANOVA for genotype: F(1,546) = 5.63, *p = 0.02; genotype/day interaction: F(7,546) = 3.17, ##p = 0.0027); number of active electrodes (repeated measures ANOVA for genotype: p = 0.198; genotype/day interaction: F(7,546) = 2.49, #p = 0.0159). (D) Number of bursts detected (repeated measures ANOVA for genotype: F(1,546) = 18.82, ***p < 0.001; genotype/day interaction: F(7,546) = 6.71, ###p < 0.0001); number of spikes within bursts (repeated measures ANOVA for genotype: F(1,546) = 4.17, *p = 0.0445); and percentage of spikes which were found to occur within bursts (repeated measures ANOVA for genotype: F(1,546) = 31.62, ***p < 0.0001; See Supplementary Figure 3). (E) Illustration of firing pattern showing increased phasic firing in bursts of patient neurons (red) as compared to isogenic controls (blue). Number of wells analyzed per cell line is displayed within the figure from 4 independent differentiations. Values displayed are mean ± SEM.
As illustrated by representative spike raster plots, patient-derived neurons exhibited an enhanced spontaneous firing frequency relative to isogenic controls over time in culture (Figure 2B-C). As neurons matured, the spontaneous firing frequency increased in both cell lines, but the rate of increase was more rapid in Q2-01T274M/+ neurons (Figure 2C). Q2-01T274M/+ neuronal cultures also had a significantly higher number of bursts, higher burst frequency, and greater number of bursting electrodes (Supplementary Figures 2D and 3B). Furthermore, their spikes were more restricted to bursts, as demonstrated by significantly higher number of spikes per burst, percentage of all spikes occurring within bursts, and interspike interval covariance as compared to isogenic controls (Figures 2C-D and Supplementary Figure 3B). There was no difference in number of active electrodes over time, although the rate at which more electrodes became active over days in culture was higher in patient-derived neurons (Figure 2C). These results indicate that Q2-01T274M/+ patient-derived neurons developed greater levels of spontaneous activity and were more prone to fire in phasic bursts rather than single irregular tonic spikes compared to isogenic control neurons (Figure 2E).
KCNQ2-NEE Neurons Exhibit Progressive Enhanced Intrinsic Excitability
To determine if differences in firing behaviors exhibited by populations of Q2-01T274M/+ neurons were driven by altered intrinsic excitability, we examined the firing frequency of large numbers of neurons using the Optopatch, a recently developed system for high-throughput, all-optical electrophysiology with single cell resolution (36-38). The combined expression of CheRiff, a blue light-activated channelrhodopsin, and QuasAr, a fluorescent voltage indicator allows for the simultaneous stimulation and recording from multiple neurons within an elaborate network (Figure 3A). Using Synapsin 1 (SYN1)-driven expression constructs for CheRiff and QuasAr3 (Figure 3A), we imaged and analyzed the firing frequency of ∼3000 neurons per genotype under a blue-light illumination protocol (Figure 3B-D and Supplementary Figure 4). Day 35 neuronal cultures were monitored for 2 sec without stimulation followed by five 500 ms pulses of blue light of increasing intensity similar to a current injection step-protocol (Figure 3B). As shown in the raster plot of spike timing for each neuron (Figure 3C, top), and the average firing rate of all neurons (Figure 3C, bottom), KCNQ2-NEE patient-derived neurons exhibited a significantly higher firing frequency relative to their isogenic controls across the stimulation protocol (p < 0.01; Figure 3D). Within these populations of spiking neurons a significantly lower proportion of KCNQ2-NEE neurons responded to stimulations with a single spike (phasic spiking: p < 0.01; Figure 3E).

(A) Experimental outline: neurons were co-cultured with primary glial cells and on day 21 were infected with lentiviruses encoding the Optopatch constructs. CheRiff was coupled to a BFP fluorescence reporter and QuasAr3 to Citrine. Optopatch imaging was performed on day 35. (B) Illumination protocol: following 2 sec of spontaneous activity recording, neurons were subjected to five, 500 ms stimulation pulses of increasing blue light intensity (1: 2.45, 2: 5.5, 3: 14.67, 4: 33, and 5: 88 mW/cm2) at 1Hz, to activate CheRiff at 470 nm. Changes in membrane potential were monitored through changes in QuasAr3 fluorescence excited by red light at 635 nm. (C) Top: raster plot showing spike timing for individual neurons across the stimulation protocol. Each row represents an individual neuron and each point an AP. Bottom: average firing frequency of mutant and control neurons across the stimulation protocol. (D-E) Average firing frequency and percentage of cells that exhibit phasic spiking for each stimulus intensity step. Number of neurons analyzed is displayed within the figure. Values displayed are mean ± SEM. Statistical significance determined by using the Kolmogorov-Smirnov statistic, **p<0.01 and ***p<0.005, NS: not significant.
We next validated the intrinsic hyperexcitability phenotype in KCNQ2-NEE neurons by performing whole-cell current-clamp measurements. We systematically recorded from single Q2-01T274M/+ patient-derived and isogenic control GFP-positive cortical neurons at three time points in culture defined as week 3 (days 14-16), week 4 (days 22-26), and week 5 (days 32-35; Figure 4A-B). As neurons matured over time in culture, the neuronal resting membrane potentials (RMP) became similarly more hyperpolarized for both genotypes, but input resistance was significantly higher (p = 0.0054) in Q2-01T274M/+ neurons only during week 3 (Supplementary Figure 5A and Table 1). The increasing action potential amplitudes for both genotypes over time indicated neuronal maturation (Supplementary Figure 5B and Table 1).

(A) Experimental time line. (B) Representative images of GFP-fluorescing isogenic control neurons during week 3, 4 and 5. Scale bare: 500µm. (C) Current-clamp protocol. Intrinsic excitability was measured in current-clamp mode using 1 sec somatic current injection steps (10-80pA) from a holding potential of −65mV. (D) Representative traces of patient-derived (red) and isogenic control (blue) neurons firing APs during an 80 pA current stimulus. (E) Numbers of APs that patient-derived and isogenic control neurons fired during week 3 (repeated measures ANOVA for genotype: p = 0.21; genotype/current injection amplitude interaction for week 3: p = 0.38), week 4 (repeated measures ANOVA for genotype: F(1,1673) = 5.14, *p = 0.015; genotype/current injection amplitude interaction: F(7,1673) = 4.79, ###p < 0.0001) and week 5 (repeated measures ANOVA for genotype: F(1,931) = 5.68, *p = 0.018; genotype/current injection amplitude interaction: F(7,931) = 5.27, ###p < 0.0001). NS: not significant. Number of neurons analyzed is displayed within the figure and in Table 1 (See Supplementary Figure 5). Values displayed are mean ± SEM.
To assess neuronal membrane excitability, we measured the frequency of action potentials (APs) evoked by ascending somatic current injection steps (1 sec, 10 - 80pA) from a holding potential of −65mV (Figure 4C). More than 80% of both Q2-01T274M/+ and isogenic control neurons produced at least one AP using this protocol, and >50% exhibited repetitive trains of APs by week 3 (Supplementary Figure 5C). Analysis of the number of APs evoked from iPSC-derived neurons during weeks 3, 4 and 5 revealed significant differences between genotypes during week 4 (p < 0.0001) and week 5 (p = 0.02; Figure 4D-E). Although Q2-01T274M/+ neurons were able to fire significantly more APs than isogenic controls during week 4 and 5, there were no differences between the genotypes during week 3 (p = 0.46; Figure 4E). Collectively these results suggest that Q2-01T274M/+ patient-derived excitatory neurons develop robust intrinsic hyperexcitability progressively as they mature in culture.
Lower M-current is Not Sufficient to Induce Hyperexcitability
The lack of intrinsic hyperexcitability of Q2-01T274M/+ neurons during week 3 prompted us to investigate whether M-current was abnormal at this early time point in culture. We hypothesized that KCNQ2 may not be expressed at this early time point, or that neurons were able to compensate for lower KCNQ2 channel function with other KCNQ channels (i.e. KCNQ3 or KCNQ5) earlier on. To test this, we recorded total and M-current density in Q2-01T274M/+ and isogenic control neurons during week 3. Similar to what we observed during week 4, both total current and M-current density in Q2-01T274M/+ neurons were significantly lower (31%, p = 0.009; and 57%, p < 0.001, respectively) than isogenic neurons during week 3 (Supplementary Figure 5D). This suggests that lower M-current amplitude is not sufficient for hyperexcitability at this early time point. Interestingly, we also found that the total current and M-current density in both Q2-01T274M/+ and isogenic control neurons were significantly higher during week 3 than week 4 (p = 0.007, p = 0.02; Supplementary Figure 5E).
KCNQ2-NEE Neurons Exhibit a Distal Shift of the AIS
Recent studies have shown that pharmacological inhibition of M-current induces remarkable structural plasticity affecting neurite outgrowth and the dynamics of the axon initial segment (AIS) (39-41). To determine whether such changes occur in the context of Q2-01T274M/+ patient-derived neurons, we assessed morphology in week 4 GFP+ cortical neurons (Figure 5A). As KCNQ2 channels are known to be localized in the AIS, we also characterized the AIS structure and position by immunolabelling neuronal cultures with Ankyrin G (ANK3), a marker of the AIS, together with the dendritic marker MAP2 (Figure 5A-B). To obtain a single measure for AIS location, we determined the AIS distance as the linear path length from the base of the soma to the start of the dense expression of ANK3 and lack of MAP2 signal. While there was no differences in the soma size, number of primary branches or the total length of the AIS, we found that patient-derived neurons exhibited a distal shift of the AIS as compared to isogenic controls (p = 0.0242; N = 41, 30 for control and patient neurons respectively; Figure 5B).
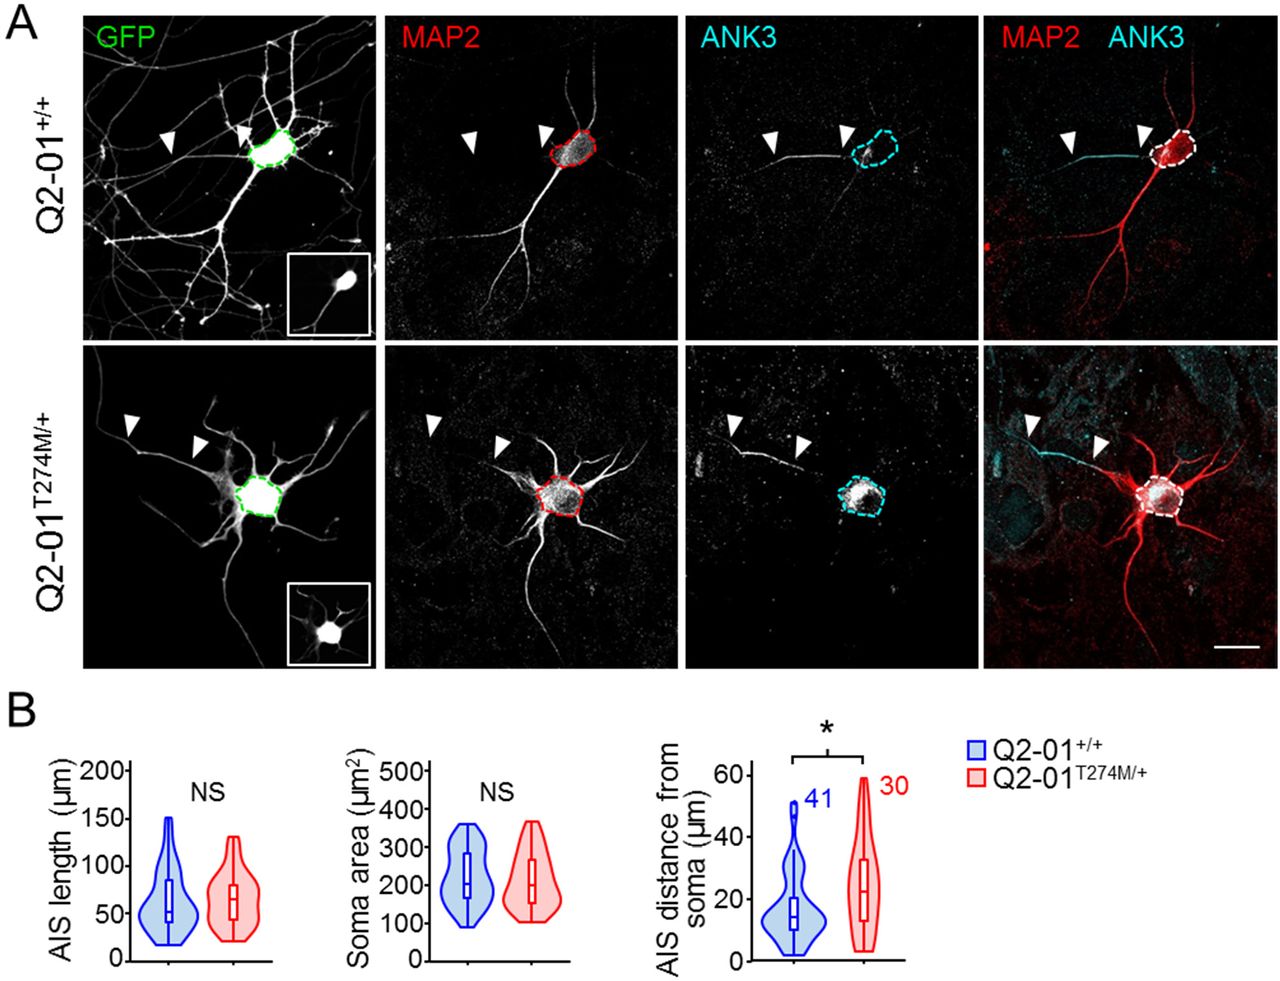
(A) Representative confocal images of 4-week old patient-derived and isogenic control neurons immunostained with GFP, MAP2 and ANK3. Dotted lines outline the soma. Insert at the bottom of GFP panel shows the specific image used to select the soma. White triangles indicate beginning and end of the axon initial segment (AIS). The end of the MAP2 signal that coincided with the beginning of the ANK3 signal was used at the start of the AIS. Scale bar: 20µm. (B) Morphometric analysis of patient-derived and isogenic control neurons. AIS longest path length, AIS total length and soma area were not significantly different. Patient-derived neurons exhibited a greater distance between the soma and the start of the AIS (24.9±2.7 µm) as compared to isogenic controls (17.5±1.7 µm; t-test: *p = 0.0188). Number of neurons analyzed is displayed within the figure. NS: not significant. Values displayed are mean ± SEM.
KCNQ2-NEE Neurons Exhibit Enhanced AP Repolarization and Post-Burst AHP
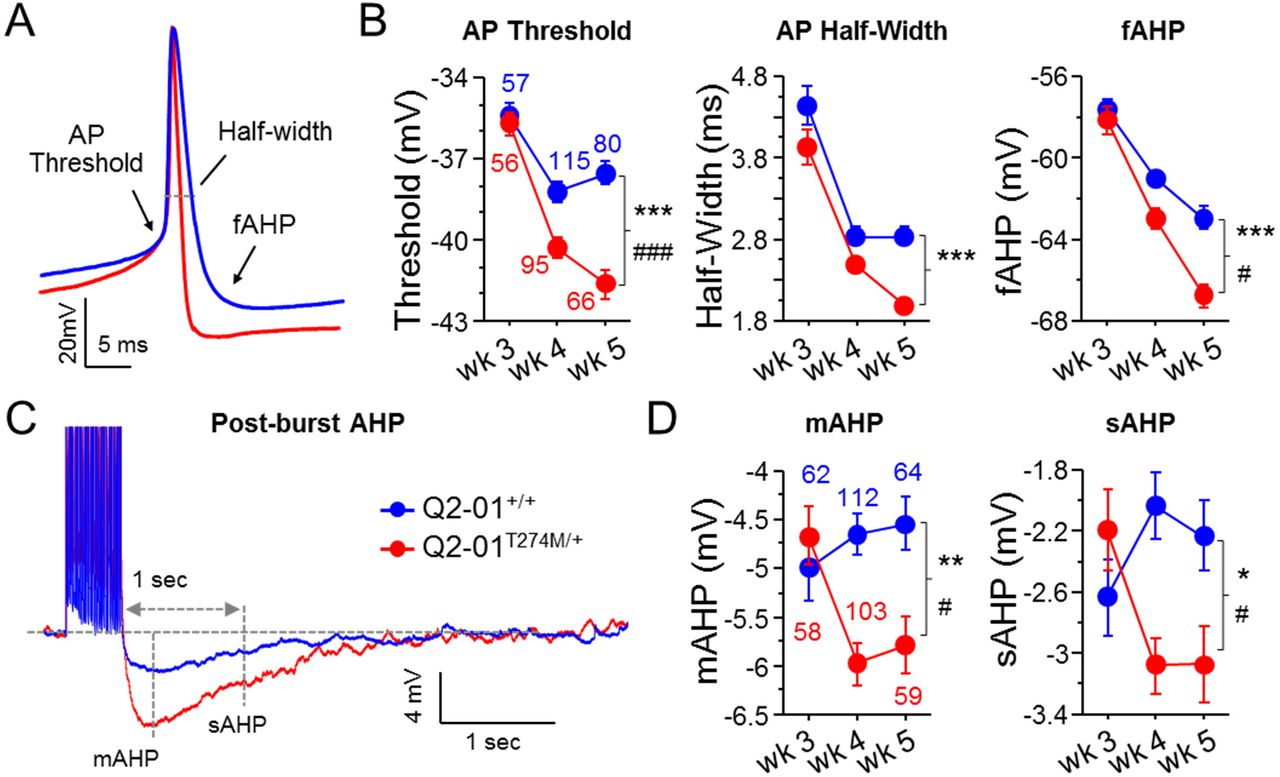
The lower M-current in Q2-01T274M/+ neurons during weeks 3 and 4 (Figure 1 and Supplementary Figure 5D) does not correlate with enhanced excitability, which occurs only during and after week 4 (Figures 2 and 4). Furthermore, altered dendritic arborization and distally shifted AIS suggests the activation of homeostatic plasticity mechanisms utilized by patient-derived neurons (Figure 5). Together these results suggest that an alternative intrinsic neuronal mechanism may be responsible for patient-derived neuron hyperexcitability. To determine the source of the progressive increase in excitability in Q2-01T274M/+ neurons, we examined the AP properties and post-burst AHPs at 3, 4 and 5 weeks of differentiation. We observed that Q2-01T274M/+ neurons had significantly lower AP thresholds (p = 0.0001) and faster AP repolarization with shorter AP half-widths (p < 0.0001), and larger fAHPs (p < 0.0001) (Supplementary Figure 6A-B; Table 1). Consistent with the excitability measurements (Figure 4), the significant differences in AP thresholds and repolarization were limited to weeks 4 and 5 with no difference during week 3. Lower AP thresholds and faster repolarization would allow neurons to fire more APs with less synaptic input, which may explain the enhanced excitability in Q2-01T274M/+ neurons. These differences in AP properties may also explain the higher tendency of patient-derived neurons to fire within bursts (Figure 2).
The ability of neurons to fire in bursts is limited by several conductances that turn on following a burst of APs acting to hyperpolarize the membrane potential and prevent neurons from firing more bursts. Previous studies have shown the involvement of KCNQ2 channels in the medium afterhyperpolarization (mAHP) in cortical neurons (7,42). We examined the post-burst AHP using a 50 Hz train of 25 APs evoked by 2 ms/1.4 nA current pulses. We found that Q2-01T274M/+ neurons exhibited a significantly enhanced mAHP (peak of AHP) and slow post-burst AHP (sAHP; 1 second after last stimulus; p = 0.003 and p = 0.01, respectively; Figure 6C-D; Table 1). These differences were only significant during weeks 4-5 but not earlier (Figure 6C-D; Table 1). Although an enhanced AHP increases the refractory latency of neurons to repolarize and be able to fire again after a burst of APs, lower AP thresholds and faster AP repolarization in Q2-01T274M/+ neurons may overcome this hurdle. These findings support our MEA data showing enhanced burst firing in patient-derived neurons because the changes in AP properties would account for more APs within bursts while enhanced post-burst AHPs would dampen spontaneous firing between bursts (Figure 2).

(A) Representative traces showing AP amplitude, threshold, half-width and fAHP. (B) Analysis of AP properties measured during week 3, 4 and 5. Patient-derived (red) neurons had significantly more hyperpolarized AP threshold (two-way ANOVA for genotype: F(1,463) = 42.17; ***p < 0.0001; genotype/weeks interaction: F(2, 463) = 9.16; ###p = 0.0001) and enhanced repolarization with shorter AP half-widths (two-way ANOVA for genotype: F(1,463) = 27.88; ***p < 0.0001) and larger fAHPs (two-way ANOVA for genotype: F(1,463) = 27.18; ***p < 0.0001; genotype/weeks interaction: F(2, 463) = 4.17; #p = 0.02). Post hoc analysis using t-tests to compare patient-derived and isogenic control neurons at each time point revealed differences in these properties only on week 4 and 5, with no significant differences on week 3. (C) Representative whole-cell current-clamp traces showing post-burst AHPs after 50 Hz train of 25 APs evoked by 2 ms/1.2 nA suprathreshold current stimuli. (D) Patient-derived neurons had enhanced mAHP (two-way ANOVA for genotype: F(1,452) = 9.83; **p = 0.0018; genotype/weeks interaction: F(2, 452) = 4.93; #p = 0.0076) and sAHP (two-way ANOVA for genotype: F(1,452) = 4.86; *p = 0.0281; genotype/weeks interaction: F(2, 452) = 5.14; #p = 0.0062). Post hoc analysis using t-tests to compare patient and isogenic control neurons at each time point revealed differences in mAHP and sAHP only on week 4 and 5, with no significant differences on week 3. Number of neurons analyzed is displayed within the figure and in Table 1 (Also see Supplementary Figure 5). Values displayed are mean ± SEM.
Acute Inhibition of M-current Reduces AP Repolarization and Post-Burst AHP
Previous studies have shown that blocking M-current in rodent cortical excitatory neurons acutely with XE991 enhances neuronal excitability by lowering AP threshold, impairing AP repolarization and attenuating the post-burst AHP (39,43). However, our analysis of Q2-01T274M/+ neurons showed that while they have lower M-current, they develop hyperexcitability through progressive enhancement of repolarization with reduced AP half-width and enhanced fAHP and post-burst AHP (Figures 1-4 and 6). We propose two potential explanations for these divergent mechanisms for hyperexcitability: either M-current inhibition in human cortical glutamatergic neurons has different effects than what was previously reported, or chronic M-current suppression leads to hyperexcitability and altered AP properties by indirect mechanisms that are different from those related to acute inhibition.
To test the first possibility, we interrogated the intrinsic membrane properties of week 4 control excitatory neurons before and after acute treatment with 20 µM XE991. Consistent with previous reports (39,43), XE991 significantly reduced AP threshold and AP repolarization (Supplementary Figure 6A-B and F). Furthermore, XE991 application blunted the mAHP and sAHP amplitudes in these neurons (Supplementary Figure 6C-D and F).
To determine the effect of acute M-current inhibition on neuronal excitability, we quantified the number of evoked APs before and after XE991 application. Acute block of M-current enhanced the ability of isogenic control neurons to fire APs only during 20, 30 and 40 pA current steps (p-value = 0.003, 0.048, 0.021 respectively; N = 25 cells; Supplementary Figure 6E). This did not resemble the behavior of Q2-01T274M/+ neurons, suggesting that loss of M-current alone is not sufficient for hyperexcitability. Collectively, these experiments suggest that KCNQ2-NEE patient neurons likely develop hyperexcitability progressively as a result of chronic M-current reduction and dyshomeostatic adaptation of AP properties.
Chronic Inhibition of M-current in Control Neurons Phenocopies KCNQ2-NEE Neurons
While changes in the AP properties of Q2-01T274M/+ patient-derived neurons may explain why they are hyperexcitable during weeks 4 and 5, hyperexcitability does not correlate with loss of M-current during week 3. Furthermore, the intrinsic AP properties of Q2-01T274M/+ neurons are not consistent with a pure loss of M-current but rather with a gain of another fast or Ca2+-dependent voltage-gated K+ conductance that increases over time in culture. Therefore, we hypothesized that early and chronic suppression of M-current leads to adaptive enhancement of repolarization and post-burst AHP. To test this, we chronically treated isogenic control neurons with XE991 (starting on day 12 in culture; Figure 7A) and measured excitability during week 4.

(A) Experimental time line. (B) AP threshold, half-width and fAHP of isogenic control neurons chronically treated with 1 µM XE991 (Q2-01+/+chronic XE991) were significantly different from untreated isogenic control neurons (ANOVA, Fisher’s PLSD posthoc test for AP threshold: **p=0.003; AP half-width: ***p=0.0002; fAHP: *p=0.0107), but were not significantly different from patient-derived neurons (ANOVA, Fisher’s PLSD posthoc test for AP threshold: p=0.137; AP half-width: p=0.421; fAHP: p=0.112). (C) Representative AP traces from Q2-01T274M/+, Q2-01+/+ and Q2-01+/+chronic XE991 neurons. (D) The post-burst AHP is enhanced after chronic XE991 treatment in isogenic control neurons (One-way ANOVA and Fisher’s PLSD posthoc test for mAHP: ***p < 0.0001; sAHP: **p=0.0008), to levels similar to patient-derived neurons (mAHP: p=0.0532; sAHP: p=0.69). (E) Representative traces showing post-burst AHPs of Q2-01T274M/+, Q2-01+/+ and Q2-01+/+chronic XE991 neurons. (F) Q2-01+/+chronic XE991 were able to fire significantly more APs per current stimulus than untreated control neurons (repeated measures ANOVA: F(2,2310)=3.88, *p=0.0216; interaction: F(14,2310)=3.97, ###p<0.0001), and were not significantly different from patient-derived neurons (repeated measures ANOVA: p=0.9822). Number of neurons analyzed is displayed within the figure and in Table 1 and 2 (also see Supplementary Figure 6). (G) MEA recordings from day 16 to 31 in culture recorded from Q2-01T274M/+, Q2-01+/+ and Q2-01+/+chronic XE991 neurons. There was no difference in the number of active electrodes between the three groups of neurons (repeated measures ANOVA: p=0.5603). Within the detected bursts Q2-01+/+chronic XE991 neurons exhibited a significantly greater number of spikes as compared to both Q2-01T274M/+ and Q2-01+/+ neurons (repeated measures ANOVA: F(2,315)=27.63, ***p<0.0001). The percentage of spikes that occurred within bursts was significantly greater in Q2-01+/+chronic XE991 neurons as compared to both Q2-01T274M/+ and Q2-01+/+ neurons (repeated measures ANOVA: F(2,315)=28.02, ***p<0.0001). 16 wells were analyzed per group from 2 independent differentiations (See Supplementary Figure 7). NS: not significant. Values displayed are mean ± SEM.
Chronically XE991-treated control neurons exhibited lower AP threshold (p = 0.003), enhanced repolarization (HW: p = 0.0002; fAHP: p = 0.01) and larger post-burst AHPs (mAHP: p = 0.0001; sAHP: p = 0.0008) relative to untreated controls (Figure 7B-E, Supplementary Figure 7A-D and Table 2). The treatment also resulted in a significant increase in the number of APs evoked by current injection steps as compared to untreated isogenic control neurons (p < 0.0001; Figure 7F). Importantly, these effects were identical to the properties of Q2-01T274M/+ neurons.
We next monitored spontaneous neuronal network activity using MEAs and found that chronic M-current inhibition was associated with enhanced burst firing parameters such as burst duration, number of spikes/burst and percentage of all spikes fired that occurred within bursts (p < 0.0001; Figure 7G and Supplementary Figure 7E-F). This experimental paradigm effectively phenocopied the electrophysiological behavior of Q2-01T274M/+ neurons in control cells and suggests that the AP repolarization and post-burst AHP alterations that we identified in patient-derived neurons occur as a result of long term reduction of M-current.
KCNQ2-NEE Neurons Exhibit a Dyshomeostatic Increase in BK Channel Function
The development of a shorter AP half-width and larger fAHP, mAHP and sAHP by patient neurons on and after week 4, suggest an adaptive upregulation of K+ conductance. While a number of different channels could be contributing to this dyshomeostatic mechanism, large conductance, Ca2+- and voltage-gated, fast-activating BK channels can participate in both the fast AP repolarization and slow Ca2+-dependent post-burst AHP (44). We therefore investigated the contribution of BK channels to the AP properties and post-burst AHP in mature patient and isogenic control iPSC-derived neurons. Addition of paxilline (20 μm), a BK channel antagonist, increased the AP threshold (Figure 8A) and reduced the fAHP after a single AP (Figure 8B) in patient neurons but not in controls. The magnitude of change of the AP threshold (ΔThreshold: p = 0.0049) and fAHP (ΔfAHP: p < 0.0001) was significantly larger for patient neurons compared with controls. Furthermore, paxilline treatment reduced the mAHP and sAHP of patient neurons to the level of controls with no effect in control neurons, making the magnitude of change larger for patient neurons (ΔmAHP: p = 0.0017; ΔsAHP: p = 0.002; Figure 8C). These data suggest that functional enhancement of BK channels in KCNQ2-NEE patient neurons contributes to the increase in fast-repolarizing currents and slowly-deactivating Ca2+-dependent currents.

(A) Right: Experimental protocol. Baseline measures were made after establishing the whole-cell configuration in current-clamp mode. After exactly 10 min of continuous perfusion of 20 µM paxilline in aCSF, the AP properties and post-burst AHP were remeasured. Left: Representative trace of action potential before and after application of 20 µM paxilline. (B) Acute application of paxilline significantly decreased AP threshold in patient neurons (*p = 0.0193) but not in controls (p = 0.111). Paxilline reduced AP repolarization by increasing AP half-width equally for patient and control neurons (ΔAP half-width: p = 0.589) but fAHP was only reduced in patient neurons (***p < 0.0001) and not affected in controls (p = 0.1882). (C) Top: Representative traces of post-burst AHPs. Acute application of paxilline significantly reduced mAHP (**p < 0.0001) and sAHP (**p = 0.0002) in patient neurons but not in controls (mAHP: p = 0.393; sAHP p = 0.556). Repeated measures ANOVA was used to compare paxilline effects. Number of neurons analyzed is displayed within the bar graphs, values displayed are mean ± SEM.
DISCUSSION
We developed and validated a patient-derived iPSC-based model of KCNQ2-associated epileptic encephalopathy that provides novel insight into the mechanisms by which the dysfunction of this channel leads to progressive neuronal abnormalities. Consistent with previous reports using heterologous expression systems (35), we found that the KCNQ2-encoded M-current density was significantly lower in patient-derived cortical excitatory neurons. This early defect led to the progressive development of intrinsic and network hyperexcitability, as neurons matured over time in culture. Unexpectedly, this hyperexcitability was associated with faster AP repolarization and enhanced AHP, properties not previously associated with loss of M-current. Our findings suggest that KCNQ2 dysfunction induces dyshomeostatic plasticity and alters the neurodevelopmental trajectory of patient neurons.
Neurons dynamically adjust the expression and functionality of ion channels as well as the structure of their processes to regulate their intrinsic excitability in response to cell autonomous defects or their external environment. For example, exposed to chronic hyperexcitability, neurons homeostatically downscale their intrinsic excitability and alter the size and location of the AIS (45-47). However, homeostatic plasticity can become maladaptive and even pathogenic in epilepsy when these processes become dysfunctional (46-52). The “acquired channelopathy” hypothesis suggests that proepileptic channel characteristics develop during or after the onset of epilepsy or excitotoxicity (53,54). However, these ideas are not mutually exclusive and likely chronic hyperexcitability or epileptic activity leads to protective homeostasis as well as epileptogenic dyshomeostatic neuronal adaptation.
We identified adaptive features of Q2-01T274M/+ excitatory neurons that may be protective such as: a) increased KCNQ2 protein expression to potentially compensate for loss of KCNQ2 channel function, b) an enhanced post-burst AHP associated with longer inter-burst latency (55) and c) a shift in the AIS away from the soma. A distal shift in the AIS has been suggested to lead to an increase in the current thresholds for AP firing (45). At the same time we identified progressively acquired intrinsic AP properties that lead to a hyperexcitable phenotype in Q2-01T274M/+ patient neurons despite the protective homeostatic changes. These dyshomeostatic changes include a reduction in AP threshold and faster AP repolarization. The combination of the hyperexcitable AP properties and the protectively increased post-burst AHP in single neurons result in a neuronal network burst firing pattern that has been suggested to contribute to abnormal interictal and ictal phenotypes on patient EEGs (29,56,57).
While it is not clear how reduced M-current in Q2-01T274M/+ patient-derived neurons leads to the adaptive changes described here, we were able to recapitulate these defects by chronically blocking the M-channel in control neurons. Indeed, while acute suppression of M-current evokes hyperexcitability by slowing AP repolarization and reducing the post-burst AHP, KCNQ2-NEE patient neurons and chronically treated control neurons exhibit hyperexcitability that is associated with faster repolarization and enhanced AHPs. These findings support a model where early KCNQ2 channel dysfunction drives dyshomeostatic neuronal adaptation and hyperexcitability through enhanced speed of AP repolarization and size of post-burst AHP.
AP repolarization and post-burst AHP are modulated by various K+ channel types, and it is therefore likely that multiple conductances compound these alterations in KCNQ2-NEE patient neurons. Fast-activating and fast-inactivating K+ conductances are implicated in AP repolarization while more slowly activating, slow-deactivating Ca2+-dependent K+ conductances are responsible for the medium and slow AHP (58). Our voltage-clamp recordings measuring M-currents, revealed that the difference in total current density between control and patient-derived neurons was equal to the difference in M-current density. This indicated the absence of compensation for the loss of M-current by several slowly inactivating K+ conductances, allowing us to eliminate these from the large list of potential culprits in the dyshomeostatically altered intrinsic properties.
The kinetics of fast activating BK (KCa1.1; KCNMA1) channels are modulated by several β subunits enabling them to be quickly inactivated if associated with β2 (KCNMB2) or slowly deactivated if associated with β4 (KCNMB4) subunits (44,59-61). This property allows BK channels to participate in both the fast AP repolarization and slow Ca2+-dependent post-burst AHP. Our experiments with paxilline suggest that BK channels (KCa1.1; KCNMA1) contribute to the increased K+ conductance that enhances AP repolarization and AHPs, and leads to hyperexcitability in KCNQ2-NEE patient-derived neurons. It is also possible that other K+ channels implicated in AP repolarization and post-burst AHPs, such as A-type (Kv4.x/1.4; KCND/KCNA4) and IK/SK (KCa3.1/2.x; KCNN) channels, respectively, contribute to the changes in intrinsic excitability of KCNQ2-NEE patient-derived neurons. Interestingly, several gain-of-function mutations in K+ channels have been reported in other genetic epilepsy disorders such as Kv7.5 (KCNQ5), BK (KCNMA1), Kv4.2 (KCND2), Kv2.1 (KCNB1), Kv1.2 (KCNA2) and KCa4.1 (KCNT1) channels (62).
Analysis of firing patterns from populations of cells using MEAs indicated that mutant KCNQ2 patient-derived neurons developed greater levels of spontaneous activity and are more prone to fire in phasic bursts rather than single tonic spikes compared to controls. This is supported by the combination of the hyperexcitable AP properties and the protectively increased post-burst AHP in single neurons, which result in increased number of spikes per burst intermixed with longer refractory periods. This burst-suppression firing pattern is reminiscent of the interictal EEG pattern on KCNQ2-NEE patients (16,29,56,57). Repeated firing of discrete groups of neurons or bursts of high-frequency action potentials is typically observed in chronic epileptic conditions (63-66). Importantly, this type of activity does not necessarily reflect more neuronal APs, but rather an alteration in the neuronal discharge pattern (i.e. bursts rather than irregular single spikes). This can lead to hypersynchronous activity during seizure episodes and a burst-suppression pattern that is characteristic on KCNQ2-NEE patient EEGs during persisting periods without seizures (16,29,56,57).
Treatment with an M-current activator such as retigabine (ezogabine) has been shown to be most effective when given to patients early in development (29). Our findings support this clinical observation as early intervention may interrupt the dyshomeostatic adaptation observed in patient-derived neurons. Unfortunately, because KCNQ2-NEE presents in the first days of life, targeting the underlying cause (i.e. KCNQ2 loss-of-function) might not be effective if started late in the disease course. Perhaps, targeting these dyshomeostatically altered functional features might offer an alternative therapeutic strategy for this vulnerable patient population. The iPSC-based platform that we developed here may be used to identify effective therapeutics and address further questions regarding the spatiotemporal mechanisms of NEE due to KCNQ2 mutations.
METHODS
Cell Lines
Control 1 hiPSC line (11a; RRID:CVCL_8987) was derived previously (34). Control 2 hiPSC line (NCRM-5; NHCDR Cat# ND50031, RRID:CVCL_1E75) was obtained from the NIH Center for Regenerative Medicine (NIH CRM). KCNQ2-NEE patient and isogenic control iPSC lines were derived as described below. Further information on all iPSC lines can be found in Supplementary Figure 2B.
Cell Culture
All iPSCs were grown on Matrigel (BD Biosciences) with mTeSR1 media (Stem Cell Technologies) and passaged weekly using 1mM EDTA or Accutase (Sigma). All cell cultures were maintained at 37°C and 5% CO2. All lines were determined to be mycoplasma-free.
Primary glial cell cultures were derived from brain cortex of postnatal day 0-2, CD-1 mice (Charles River). Briefly, brain cortices were dissected free of meninges in dissection buffer HBSS (Thermo Fisher), then digested with trypsin (Thermo Fisher) and DNAse I (Worthington) for 10 min at 37°C. The tissue was dissociated in glia medium: MEM (Life Technologies) supplemented with Glutamax (0.6%), D-glucose, 10% normal horse serum (Life Technologies), and penicillin-streptomycin (Thermo Fisher). After centrifugation and resuspension, cells were filtered through a 0.45 micron cell strainer and plated on poly-D-lysine coated plates with glia media at 37°C, 5% CO2 for 2 weeks. Afterwards, glial cultures were tested for mycoplasma, dissociated for expansion, and frozen in 10% DMSO/horse serum. All animal experiments were approved and conducted in accordance with the policies and guidelines set forth by the Northwestern University Institutional Animal Care and Use Committee (IACUC).
Generation of iPSCs
Peripheral blood mononuclear cells (PBMCs) were isolated from a whole cell blood draw following informed consent under protocols approved both by Ann & Robert H. Lurie Children’s Hospital of Chicago and Northwestern University. Reprogramming of PBMCs into iPSCs was performed at the Northwestern Stem Cell Core Facility using Invitrogen’s CytoTune®-iPS 2.0 Sendai Reprogramming system (A16517, Thermofisher), following the manufacturer’s instructions. This reprogramming system uses four transcription factors (Oct4, Sox2, Klf4, c-Myc). Briefly, PBMCs (5 × 10⁵) were seeded into one well of a 24-well plate and cultured for four days in StemSpan™ SFEM II PBMC complete medium (STEMCELL Technology, 09655) supplemented with 100 ng/ml SCF (PeproTech, 300–07), 100 ng/ml FLT3 (PeproTech, 300–19), 20 ng/ml IL-3 (PeproTech, 200–03) and 20 ng/ml IL-6 (PeproTech, 200–06). Immediately after plating, the cells were infected with Sendai virus for 48 h at 37 °C. The infected cells were transferred onto MEF feeders and cultured in StemSpan™ SFEM II. Following 21–28 days of culture, individual iPS colonies were picked and transferred to matrigel coated 6 well plate for expansion and were maintained in mTeSR1.
CRISPR/Cas9 Gene-Editing
Isogenic control iPSCs were generated using CRISPR/Cas9 from the Q2-01T274M/+ patient-derived iPSC line in collaboration with Applied StemCell (Milpitas, CA). Briefly, iPSCs were co-transfected with a plasmid encoding Cas9 nuclease along with the single guide RNA (sgRNA) KCNQ2.g2 (Supplementary Table 1), a puromycin-resistance plasmid, and a donor single stranded repair oligonucleotide (Supplementary Table 1). Cells were grown in the presence of puromycin for two days then colonies were isolated and expanded two weeks later. Clones with the desired genetic modification were identified by PCR genotyping and confirmed by DNA sequencing (Supplementary Figure 1C). All primer sequences can be found in Supplementary Table 1.
Analysis of Off-Target Cas9 Sites
Potential off-target sites were identified with the online tool: http://crispr.mit.edu. We selected the top 8 genomic regions of homology and thus most likely off-target sites, and amplified each one by targeted PCR of genomic DNA from the corrected iPSC clone, for further analysis either by Sanger Sequencing or by a T7 Endonuclease assay (Supplementary Figure 1D-E; Supplementary Table 1). The same PCR conditions were used to amplify the positive control DNA template and primer mix, included in the Genecopoeia TM T7 Endonuclease I Assay Kit. The amplified DNA from each potential off-target site was purified using the Wizard ® SV Gel and PCR Clean-Up System (Promega). The concentration of the purified DNA from the potential off-target sites and the template DNA from the positive control was assessed by using a Nanodrop 2000 Spectrophotometer (Thermo-Fisher). 500 ng of DNA product from each potential off-target region of the isogenic and parental cell lines and 500 ng of the positive control DNA template were heated to 95°C for five minutes and subsequently allowed to cool to room temperature to denature and re-anneal the PCR products. 2U of T7 Endonuclease I (Genecopoeia) was added to the re-annealed PCR products and incubated at 37°C for 60 minutes. The PCR products from the potential off-target sites and the positive control template were then run on a gel with 6x loading buffer, alongside a 2-log DNA ladder (New England BioLabs Inc.). All primers sequence can be in Supplementary Table 1.
Cortical Excitatory Neuron Differentiation
iPSCs were differentiated into glutamatergic neurons using a modified version of a protocol based on Ngn2 overexpression (32). Stem cells were dissociated as single cells using Accutase (Sigma), re-suspended in mTeSR1 with 10µM ROCK inhibitor (Y-27632, DNSK International), then incubated with lentiviruses (pLV-hPGK-M2rtTA, TetO-Ngn2-Puro, TetO-FUW-EGFP) in suspension for 5-10 min before plating (95,000 cells/cm2; Supplementary Figure 2A). After 24h (day 1), lentivirus was removed and replaced with knockout serum replacement medium (KOSR) consisting of KnockOut DMEM supplemented with Knockout replacement serum KSR, nonessential amino acids (NEAA), Glutamax (Life Technologies), 55µM β-mercaptoethanol (Gibco, Cat# 21985023), 10µM SB431542 (DNSK International), 100nM LDN-193189 (DNSK International), 2µM XAV939 (DNSK International) and 2 µg/ml of doxycycline (Sigma). On the following day (Day 2), media was replaced with a 1:1 ratio of KOSR to neural induction media (NIM) composed of DMEM:F12 supplemented with NEAA, Glutamax, N2 (Gibco, Life Technologies), 0.16% D-glucose (Sigma) and 2µg/ml heparin sulfate (Sigma). Doxycycline (2µg/ml) and puromycin (2µg/ml; Sigma) were added to this NIM media. On Day 3, the media was replaced with NIM containing doxycycline (2µg/ml) and puromycin (2µg/ml). All neurons were frozen in 10% DMSO/FBS on Day 4 (Supplementary Figure 2). For all experimental analysis, iPSC-derived neurons were plated on primary CD1 mouse cortical glia, derived as previously described (67). Glial cells were first plated on PDL/laminin-coated plates or coverslips in glia media composed of MEM (Life Technologies) supplemented with Glutamax (0.6%), D-glucose, and 10% Horse serum (Life Technologies). After 5-7 days, neurons were thawed (Day 5 post-induction) and plated, at a density of 20,000/cm2, directly onto the monolayer of mouse glia in Neurobasal medium (NBM), supplemented with NEAA, Glutamax, N2 and B27 (Life Technologies) containing BDNF (10ng/mL, R&D systems), 2% FBS (VWR), doxycycline and ROCK inhibitor. Half of the media was replaced every other day.
Preparation of Plasmids and Lentivirus
Overexpression of KCNQ2 in CHO cells for Western blotting was achieved using a plasmid containing wild type KCNQ2-IRES2-EGFP that was a gift from David McKinnon (68). Two base pairs were modified through mutagenesis, in this plasmid (c.2002G>A, p.K668E; c.2467T>C, p.R823C), to match NM_172108.4 sequence. Mutagenesis was performed to insert the T274M patient mutation into the wildtype construct.
TetO-Ngn2-puro (Addgene plasmid #52047) and TetO-FUW-EGFP (Addgene plasmid #30130) plasmids were gifts from Marius Wernig (32,69). FUW-M2rtTA was a gift from Rudolf Jaenisch (Addgene plasmid # 20342) (70). Lentiviruses were generated in HEK293T cells using the second generation packaging vectors, psPAX2 and pMD2.G, as described previously (71) by the Northwestern University DNA/RNA Delivery Core.
Immunocytochemistry
iPSCs and neurons were plated on Matrigel or PDL/laminin-coated glass coverslips, respectively. Cells were fixed with 4% formaldehyde (Sigma) in 4% sucrose/PBS for 15 min at room temperature. Cells were permeabilized and blocked simultaneously in PBS containing 0.1% Triton and 5% normal goat serum (Jackson Immunoresearch) for 2 hr at 4°C followed by incubation with primary antibodies overnight at 4°C. The following primary antibodies were used: GFP (Abcam ab13970, RRID: AB_300798, 1:10,000), ankyrin-G (Neuromab 75-146, AB_10673030, 1:200), synapsin (Cell signaling #5297, AB_2616578, 1:200), Map2 (Millipore MAB3418, AB_94856, 1:1000), and Map2 (AB15452, AB_11211337, 1:1000). Cells were washed three times in PBS and incubated with secondary antibodies at room temperature for 1 hour followed by another three washes in PBS. The following secondary antibodies were used: Alexa 488 goat anti-chicken, Alexa 568 goat anti-mouse, Alexa 568 goat anti-chicken, Alexa 647 goat anti-rabbit, and Alexa 647 goat anti-mouse (Thermo Fisher Scientific, 1:1000). Primary and secondary antibodies were diluted in PBS containing 5% normal goat serum. Coverslips with immunostained cells were washed briefly in distilled water and mounted onto microscope slides using Prolong anti-fade reagent (Life Technologies). Neurons from the same differentiation experiment were fixed and stained at the same time with identical antibody dilutions. Images were acquired at 10x for MAP2/GFP+ neuron counting using a Leica inverted Ti microscope.
Confocal Imaging and Analysis of Neuronal Morphology
For morphometric analysis images of immunostained neurons were acquired using a ×63 oil immersion objective lens on a Nikon C2+ confocal microscope with NIS-Elements software. Each channel was acquired sequentially to prevent fluorescence bleed-through with 2x line averaging for each channel. Neurons were imaged on multiple z-planes to capture full dendritic and axonal projections, and maximum intensity projections (max projections) of z-stacks created in Image J (Fiji) were used for downstream analyses. Images were acquired using identical settings for each experiment to allow comparison between experimental groups.
For analysis of the AIS and soma area, thirty to forty neurons were imaged for each isogenic line (10-15 neurons from each of three independent differentiations). Regions of interest (ROI) defining the outline soma were drawn in Image J from max projections of the GFP channel. Z-stacks were consulted for cells with ambiguous somas shapes, to avoid the inclusion of any protrusions. To identify the AIS, a set threshold (>1000 mean pixel intensity) was applied to confocal images containing Ankyrin G (ANK3) immunostaining. Any signal above this threshold and devoid of MAP2 immunostaining was defined as the AIS. The AIS was traced from start to finish using the freehand line tool in Image J to determine the total AIS length. If a neuron contained multiple regions of ANK3 staining (i.e. multiple axons) the length of all ANK3+ segments was summed for that cell. To determine the distance of the AIS from the soma, the shortest possible line was traced from the edge of the soma ROI to the start of the AIS, following neuronal processes. Morphometric measurements [soma area (μm2), AIS length (μm), the distance of the AIS to the soma (μm)] were all performed in Image J and recorded in Microsoft Excel. Statistical significance between two experimental groups was determined using a Student t-test (for parametric data) or Mann-Whitney (for non-parametric data). All graphs and statistics for morphometric analyses were performed in Statview.
RNA Isolation and qRT-PCR
Cells were harvested by scraping from 6-well plates at the indicated time points after induction of neuronal differentiation. Cells were resuspended in TRIzol Reagent (Life Technologies), and RNA was isolated following manufacturer’s protocol. RNA (0.5 to 1 µg) was treated with DNase I (Invitrogen) and subsequently used for the generation of cDNA using iSCRIPT Reverse Transcription Supermix (Bio-Rad) following manufacturer’s instructions. RT-PCR was performed using SYBR green on the CFX system (Bio-Rad). All assays were performed in triplicate. The averaged cycle of threshold (Ct) value of two housekeeping genes (GPI/GAPDH) was subtracted from the Ct value of the gene of interest to obtain the ΔCt. Relative gene expression was determined as 2-ΔCt (ΔΔCt) and expressed relative to the control sample or the highest expressed sample in the experiment. All primer sequences are listed in Supplementary Table 2.
Western Blot
Cells were harvested from 6-well plates at the relevant times of neuronal differentiation. Briefly, cells were twice washed with ice-cold PBS, and scraped from the wells in PBS with mini EDTA-free protease inhibitor cocktail table (Roche). Cell pellets were lysed in EBC Lysis Buffer (Boston Bio Products) with protease inhibitor cocktail on ice for one hour and spun at 14,000 RPM in an Eppendorf 5417R centrifuge at 4°C for 10 minutes. The supernatant was used to perform a BCA assay. Protein samples were electrophoresed on NovexTM 4-20% Tris-Glycine gels (Thermo-Fisher) and transferred onto nitrocellulose membrane using the CriterionTM Blotter transfer system (Bio-Rad). Membranes were blocked in 5% milk in .1% Tween/Tris-buffered saline (TBST) for 30 min and probed with primary antibodies in 5% BSA-TBST with .05% sodium azide against: KCNQ2 (1:1000; custom made), GAPDH (Millipore MAB374; 1:5000) and βTubulin-III (BioLegend #801201, previously Covance: #MRB-435P; 1:5000) overnight at 4°C, followed by Peroxidase-AffiniPure Goat Anti-Mouse or Anti-Rabbit IgG (H+L) secondary antibody (Jackson ImmunoResearch 115-035-003 or 111-035-144, respectively; 1:10000) in 5% milk-TBST for 1hr. To visualize protein, blots were incubated with secondary antibody in 5% milk-TBST in the dark for 1 hr. Finally, blots were visualized using SuperSignal West Pico PLUS chemiluminescence (ThermoScientific) on a Bio-Rad Chemidoc using ImageLab software.
Multi-Electrode Array Recordings
For multielectrode array (MEA) studies, 12 well MEA plates with 64 electrodes per well were coated with PDL and laminin according to Axion Biosystems protocols. Mouse glial cells were seeded at a density of 40,000 cells/well then 30,000 neurons/well were added one week later. Every other day, half of the media was removed from each well and replaced with fresh media. Spontaneous activity was recorded using Axion Biosystems Maestro 768 channel amplifier and Axion Integrated Studios (AxIS) v2.4 software. The amplifier recorded from all channels simultaneously using a gain of 1200× and a sampling rate of 12.5 kHz/channel. After passing the signal through a Butterworth band-pass filter (300–5000 Hz), on-line spike detection (threshold = 6× the root-mean-square of noise on each channel) was performed with the AxIS adaptive spike detector. All recordings were conducted at 37°C in 5% CO2 / 95% O2. Spontaneous network activity was recorded for 5 min each day starting on day 15 of differentiation. Active electrodes were defined as having ≥1 spikes/min. The mean firing rate (Hz), burst number, and number of spikes per burst were used as a measure of neuronal activity as this demonstrates maturity of neuronal functional properties. MEA recordings were done with 4 independent differentiations. All data reflects well-wide averages, with the number of wells per condition represented by N values.
Optopatch Measurements
Cryo-stocks of Ngn2 neurons (preserved on day 4) differentiated from KCNQ2-NEE patient and isogenic control iPSC lines were thawed and plated at a density of 100,000 cells/cm2 onto Poly-D-Lysine/Laminin pre-coated 96-well custom-made Ibidi® tissue culture dishes. Cells were co-plated with P1 primary C57BL/6 mouse cortical glial cells, at a density of 30,000 cells/cm2. Primary glial cells were prepared as previously described (67). These co-cultures were maintained in complete NBM (NBM medium supplemented with 1x Gibco® N2, 1x Gibco® B27, 10ng/mL BDNF (R&D), 2ug/mL Doxycycline (Sigma) and 2% Hyclone™ Fetal Bovine Serum). Cells were cultured for 30 days with complete medium exchanges every 3 days. Two weeks prior to all-optical (Optopatch) electrophysiology measurements (at Day 21), cells were transduced with lentiviral particles encoding Optopatch components CheRiff-BFP and QuasAr3-Citrine (36,72), driven by the human Synapsin I promoter for neuronal-specific expression. Lentiviral preparation and transduction were carried out as previously reported (38). Cells were recorded using Optopatch imaging (36-38) on day 35 (Figure 3A). Cells were imaged in Tyrodes Buffer (10mM HEPES, 125mM NaCl, 2mM KCl, 3mM CaCl2, 1mM MgSO4, 30mM Glucose, pH 7.40) in the presence of synaptic blockers (10μM NBQX (Sigma), 25μM D-AP5 (Tocris) and 20μM Gabazine (Sigma) to block AMPA, NMDA and GABA currents, respectively) to allow for measurements of intrinsic spontaneous and evoked neuronal activity. Optopatch imaging was performed on a custom built, ultra-wide field fluorescence microscope described previously (38,73). Briefly, samples were illuminated with ∼100 W/cm2 635 nm laser excitation to monitor changes in membrane potential through changes in QuasAr3 fluorescence. In order to evoke neuronal activity, a custom blue light (470nm LED) stimulus protocol was used to depolarize the cell membrane through excitation of CheRiff. The stimulus protocol consisted of 2 seconds of spontaneous activity (blue light off) followed by five 500 msec steps of increasing blue light intensity (2.45, 5.5, 14.67, 33, and 88 mW/cm2), with 500 msec of rest in between each stimulus step. Imaging data were recorded on a Hamamatsu ORCA-Flash 4.0 sCMOS camera across a 4 mm x 0.5 mm field of view at a 1 kHz frame rate. Data acquisition was performed using custom control software written in MATLAB. Analysis of Optopatch data, using a custom analytics pipeline written primarily in MATLAB, was carried out as previously described4. Statistical significance/p-values were determined using the Kolmogorov-Smirnov statistic with a custom MATLAB routine (** or *** indicates p<0.01 and p<0.005, respectively). All reported error bars are standard error of the mean.
Patch Clamp Electrophysiology
Whole-cell voltage and current clamp recordings were made from visually identified GFP-expressing neurons using an inverted Olympus IX51 microscope equipped with a 40X objective. Recording pipettes were made of glass capillaries using a horizontal Sutter P-1000 puller yielding a 3-5MΩ resistance pipette when filled with standard intracellular solution containing (in mM): 120 K-MeSO4, 10 KCl, 10 HEPES, 10 Na2-phosphocreatine, 4 Mg-ATP, 0.4 Na3-GTP, pH 7.3 adjusted with KOH; osmolality 285-290 mOsm/Kg. Neurons were continuously perfused with oxygenated aCSF bath solution (in mM): 125 NaCl, 26 NaHCO3, 2.5 KCl, 1.25 NaH2PO4, 1 MgSO4, 25 glucose, 2 CaCl2, pH 7.4 at 33-35°C. Whole-cell voltage clamp recordings were acquired using an Axopatch 200B amplifier (Molecular Devices, USA). An M-current blocker, XE991 (20µM, Abcam), was applied 2-3 minutes after establishing the whole cell configuration, and XE991-insensitive currents recorded 10 minutes after application were subtracted offline. M-currents were measured in the final 100ms of the voltage steps (Figure 1F-G).
Current-clamp recordings were acquired using a Multiclamp 700B amplifier (Molecular Devices, USA) and digitized at 10kHz (filtered at 3kHz) with the neurons held at −65mV (Vh). All reported potential values were corrected for the liquid junction potential, calculated to be −8.4 mV. Resting membrane potential was measured immediately after establishing the whole-cell patch clamp configuration. Input resistance (RN) was calculated as the slope of the voltage-current curve determined using 500 ms current steps from −50 pA to 30 pA in 10 pA steps. Medium (mAHP) and slow (sAHP) afterhyperpolarizations (AHPs) were measured as the difference between Vh and the negative going peak and 1 sec after the offset of the last current step, respectively, induced by a 50 Hz train of 25 APs evoked by 2 ms/1.2 nA current injection pulses. Single AP properties, including fast afterhyperpolarization (fAHP), were measured using direct somatic current injection ramps (10–80 pA, 500 ms). AP amplitude was calculated as the difference between Vh to the peak of the first AP of the ramp protocol. AP threshold was calculated where the first derivative of the up phase of the trace equaled 5mV/ms. Using a 1 ms sliding average, the fAHP measurement was taken when the mean first derivative of the trace reached 0.0 ± 0.5 after initial spike in each sweep. AP width measurements were taken at half the AP peak amplitude relative to Vh. Accommodation was measured during 1000 ms current steps from 10 to 80 pA; the total number of APs during the entire steps were counted. Neurons meeting the following criteria were used: series resistance (RS) < 30 MΩ, membrane resistance (RN) > 200 MΩ, resting potential (Vrest) < −45 mV, and AP amplitude > 80 mV from Vh. Data were analyzed using custom MATLAB protocols. Statistical analyses were conducted using Statview.
We also tested the action of chronic and acute application of 1 and 20 µM XE991 (expected to block 50% and 100% of M-current, respectively) (Wang et al., 1998). 1 µM XE991 was chronically applied to neuronal culture media starting day 12 in differentiation (right before beginning of week 3 time point) and AP properties were measured on week 4. Acute application of 20 µM XE991 or 20 µM paxilline (Tocris) was done during week 4 and AP properties were measured before and 10 min after continuous perfusion of aCSF with XE991 or paxilline.
Drugs
Drugs were prepared as a stock solutions using distilled water or DMSO, then diluted to the required concentration in aCSF or culture media immediately before use. Bath-applied drugs were perfused for at least 10 min to ensure complete equilibration within the recording chamber before recording.
Statistical Analysis
Differences were evaluated using t-test, one-way or two-way ANOVA, repeated-measures ANOVA, and Fisher’s protected least significant difference post hoc tests where appropriate. All data are reported as means ± SEM.
Study Approval
Written informed consent was received from participants prior to inclusion in the study under protocols approved both by Ann & Robert H. Lurie Children’s Hospital of Chicago and Northwestern University IRB (#2015-738).
AUTHOR CONTRIBUTIONS
D.S., A.L.G., and E.K. conceived the study. D.S. designed and performed experiments, analyzed and interpreted all the data presented, assembled figures and wrote the manuscript. B.N.P. and D.S. generated and maintained all iPSC and neuronal cultures. B.N.P. and G.L.R. performed quality control and qPCR experiments. T.J.S. and D.S. performed patch-clamp electrophysiological experiments. D.S. performed MEA experiments. M.F. and B.N.P. performed and analyzed immunocytochemistry and confocal imaging experiments under the supervision of P.P. M.S. performed Western blot experiments. J.J.M. and L.C.L. recruited patients for the study. L.A.W., V.J., H.Z., S.J.R., O.B.M. and G.T.D. performed and analyzed data from Optopatch experiments. A.L.G. and E.K. designed experiments, interpreted the data, provided guidance and supervision and wrote the manuscript. All authors helped to edit the manuscript.
SUPPLEMENTARY TABLES
ACKNOWLEDGMENTS
We would like to thank Shoai Hattori for providing and adjusting MATLAB protocols to analyze current-clamp data, Chris Thompson for help making violin plots and Jean-Marc Luc DeKeyser for help with molecular cloning. The Kiskinis lab is supported by grants from the Dravet Syndrome Foundation and the Northwestern University Clinical and Translational Institute. EK is a Les Turner ALS Center Investigator. This work was supported, in part, by the Stanley Manne Children’s Research Institute and Ann & Robert H. Lurie Children’s Hospital of Chicago under the Precision Medicine Strategic Research Initiative, and a gift from Davee Foundation.
Footnotes
Conflicts of interest: L.A.W., V.J., H.Z., S.J.R., O.B.M. and G.T.D. are employees and shareholders at Q-State Biosciences. E.K. owns stock and is a consultant for Q-State Biosciences.
REFERENCES


