

Abstract
Animal migration is highly sensitised to environmental and biological cues, yet plant dispersal is considered largely passive. The common dandelion, Taraxacum officinale, is a classic example of a wind-dispersed plant and has an intricate haired pappus facilitating flight. This pappus facilitates enables the formation of a separated vortex ring (SVR) during flight (1); however, the pappus structure is not static but reversibly changes shape by closing in response to moisture. Here we characterise the biomechanical function of the pappus morphing regarding SVR dynamics and flight capacity. When the pappus closes, the falling velocity is greatly increased and the velocity deficit within the vortex decreased. To understand the implications of this structural-functional change, we used historic meteorological data to simulate dispersal distance. Dispersal distances were reduced with the pappus closed, and so was detachment. We propose that moisture-dependent pappus-morphing serves to retain seeds in favourable moist niches, providing a form of informed dispersal (2) that has not been characterised in plants on such a short-term, responsive time scale (3).
Results and Discussion
A long-distance shift in habitat is one of the riskiest decisions a living organism can make. From ballooning spiders dispersing from salt marshes according to local wind velocity (4) to kittiwakes abandoning breeding sites based on reproductive success of their neighbours (5), migration of many animals can be described as ‘informed dispersal’, in which organisms chose when and to where they travel depending on environmental cues and stressors (2). In contrast, movement of plants, which is mostly mediated by seed or fruit dispersal, is understood as a mostly passive process. This contradicts the wide range of environmental sensing and responses observed in plant development and physiology. Is plant dispersal really passive?
The dandelion represents diverse plant species that generate plumed types of wind-dispersed diaspores, thought to fly over remarkable distances (e.g. up to 100 miles (6)). The diaspore consists of an achene (fruit) attached to a pappus comprising around 100 filaments (1), which is found closed in wetting conditions such as mist or rain (7, 8) (Fig 1a,b,c). In contrast, when dry, filaments are approximately horizontal at a 2 mm radius from the centre of the pappus, according to μCT scan analyses (Fig S1a).

a the angle of individual filaments of dandelion pappi. Angle is calculated relative to horizontal in which the dandelion seed beak (see Fig 1c) forms the vertical axis, n = 10 pappi, n = 932 filaments. Red dashed line indicates the median value. b high relative humidity partially closes the dandelion pappus. Change in pappus angle at stable relative humidity (after 10 hours in chamber with saturated salt solutions), n = 7 for 39.8% relative humidity and n = 6 for 71.8% and 87.0% treatments.

a image of a dry dandelion infructescence, b image of a wet dandelion infructescence, c schematic of a dandelion diaspore (seed) indicating features, d image of dry dandelion pappus, scale bar = 2 mm. e image of dandelion pappus after 1 hour in moisture chamber with a 20 min humidifier treatment, scale bar = 2 mm. f time course of change in pappus angle between outermost filaments with 10 or 20 min humidifier treatment, n = 10 and n = 12 samples for 10 and 20 min treatments respectively, error bars are s.e.m.
To capture pappus closure dynamics, we imaged dandelion seeds in an enclosed, water-tight chamber with moisture added via an ultrasonic humidifier for 10 or 20 minutes (Fig 1d,e,f). For both treatments, the pappus angle (the angle between outermost filaments, see Fig 1c) rapidly decreased (4.0 ± 1.4 ° min−1) during moisture treatments. This continued for 5-15 minutes after moisture addition ceased with a final change in angle of 60° to 90° (Fig 1f). To test the effect of relative humidity (RH) below 100%, samples were placed in a chamber with stable RH. At RH of 71.8% and 87.0%, modest angles changes of around 10° and 24° were observed, respectively (Fig S1b). Together, these results indicate that the dandelion pappus partially closes at high RH and rapidly closes when fully wet.
We predicted that pappus shape changes would modify seed flight and indeed found a strong effect on the falling velocity of the seed (Fig 2a). A decrease in pappus angle of around 100-150°, associated with wetting for one hour, resulted in double to triple the falling velocity (Fig 2a). This is consistent with a change in projected pappus area that occurs when the pappus closes (Fig S2a). Additionally, a small increase in mass due to the added water resulted in a 0.7 μN increase in drag for the wetted samples.

a falling velocity reduces as projected area reduces. Projected area calculated using measured pappus angles and assuming filament lengths of 7.41 mm and diameters of 16 μm according to ref (1), b flow velocity along the r axis of vortex images at calculated position of minimal uz flow. The r position is non-dimensionalised by dividing by the dry pappus diameter for each sample, with 0 indicating the centre of the pappus. Plot for a single sample at 3 different pappus angles, representative of n =10 samples. c vorticity along the r axis of vortex images at calculated position of minimal uz flow. The r position is non-dimensionalised by dividing by the dry pappus diameter for each sample, with 0 indicating the centre of the pappus. Plot for a single sample at 3 different pappus angles, representative of n = 10 samples. d the minimum uz flow velocity in the separated vortex ring at varying pappus angles. e the distance downstream of maximum reverse flow in the separated vortex ring at varying pappus angles. The z position is relative to the sample pappus diameter (i.e. the diameter of the sample at the given pappus angle, rather than in a dry state).
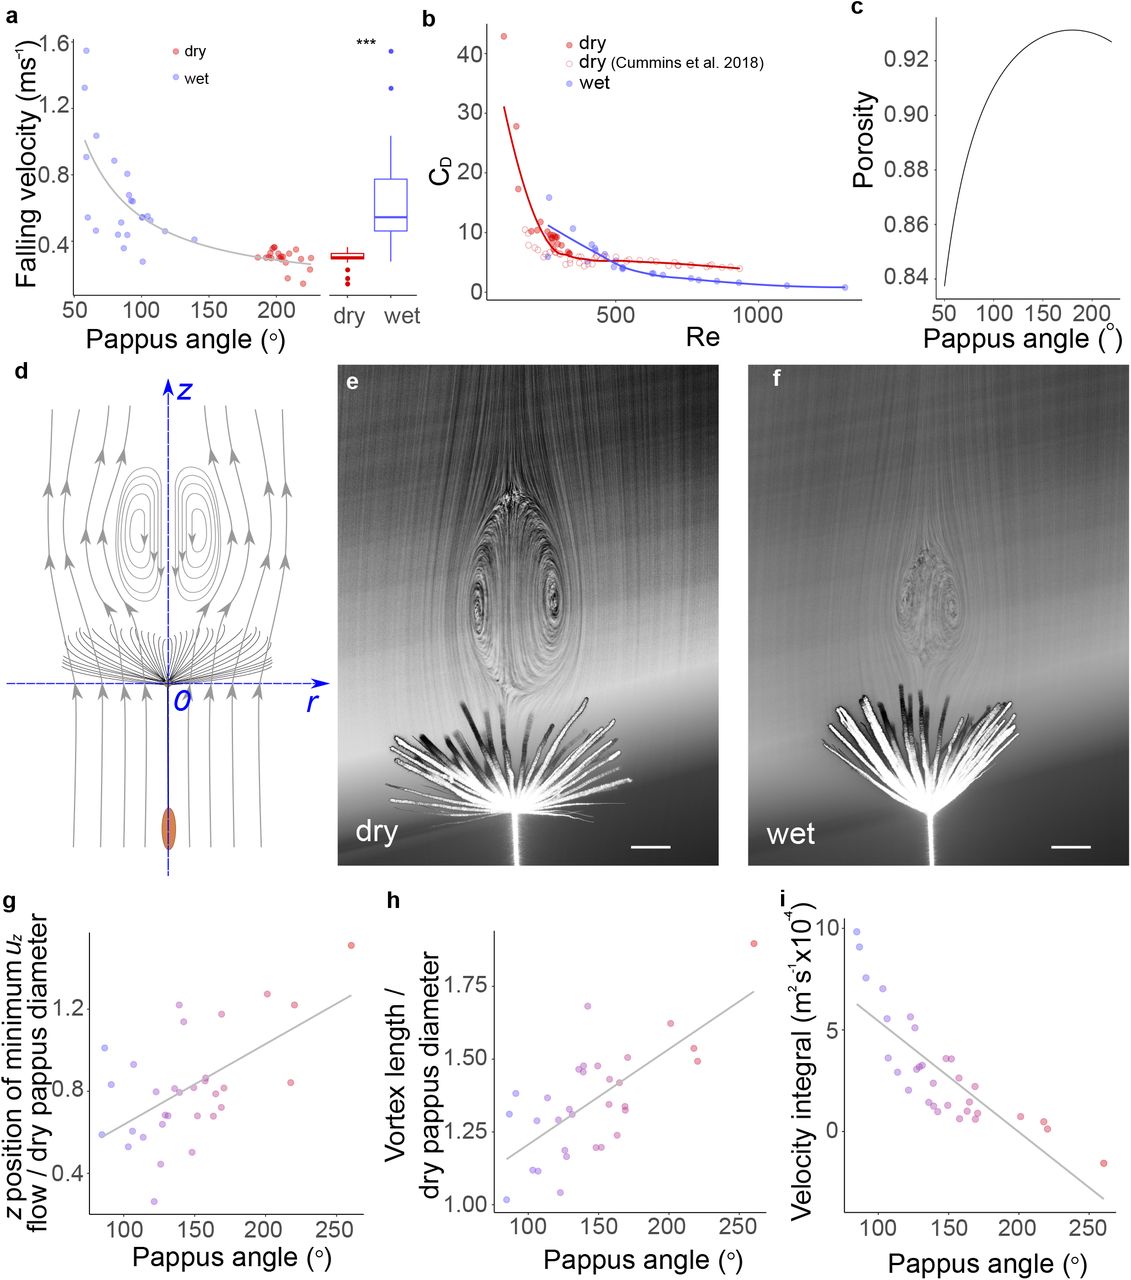
a falling speed at varying pappus angles, before and after wetting for 1 hour in moisture chamber, asterisks indicate statistically significant difference at p < 0.0001, n = 20, b relationship between Reynolds number (Re) and drag coefficient (CD) for dry and wet samples, open red circles indicate data from weighted/clipped dry seeds from ref (1), n = 10 seeds, filled circles are same data as a, n = 20 seeds, c estimated porosity at varying pappus angles, d schematic illustrating axes and direction of flow, e flow visualisation of dandelion fruit with open pappus, contrast adjusted to illustrate vortex more clearly, scale bar = 2 mm, f flow visualisation of dandelion fruit with a partially closed pappus, contrast adjusted to illustrate vortex more clearly, scale bar = 2 mm, g distance of the region of minimum uz from the pappus centre at varying pappus angle, position is nondimensionalised for each sample by the diameter of the pappus when dry, n = 12 seeds, h longitudinal length of the SVR nondimensionalised by the diameter of the pappus when dry, at varying pappus angles, n = 12 seeds, i integral of uz along a radial axis that intersects the z axis at the point of maximal reverse flow, n = 12 seeds.
To understand further how the pappus shape change affects the drag and falling velocity of the dandelion seed, we calculated the drag coefficient (CD) and Reynolds numbers (Re) from our drop test data. The coefficient CD is a nondimensionalised indication of the drag on an object for a given projected area, while Re is a nondimensionalised indication of the fluid regime, which depends only on fluid viscosity, speed and size of the object. For dry diaspores we examined CD and Re alongside data from weighted/clipped seeds from ref (1) (Fig 2b). For dry diaspores, higher Re is associated with rapidly decreasing CD before reaching a plateau. The wet diaspores with closed pappi, however, exhibit a different CD - Re relationship with substantially lower CD for a given Re compared to dry (weighted) seeds with open pappi (Fig 2b). Closing the pappus therefore has two simultaneous effects: Re is increased as falling velocity increases and the drag per unit of projected pappus area is decreased relative to a hypothetical open pappus of the same projected area. Therefore, pappus morphing is associated with shifting to a different region of the CD - Re parameter space.
A separated vortex ring (SVR) forms behind the pappus due to the high porosity of the pappus combined with precise spacing of the filaments, which limits air flow through the pappus and creates complex flow behaviour (1, 10). The nature of the SVR behind circular disks is strongly affected by the porosity of the disk and its projected area. Closing the pappus has several effects on the geometry: firstly, the projected area exposed to the flow reduces (Fig S2a); secondly, porosity of the pappus reduces as filaments move closer together (Fig 2c); and thirdly, the shape of the pappus becomes less disk-like and more cone-like. We have observed that the combination of these effects alters the fluid mechanics around the pappus by reducing vortex size, shifting the vortex away from the pappus, and increasing the velocity deficit in the wake (Fig 2g-i).
In order to understand how pappus morphing impacted on SVR formation, we examined dandelion pappi in dry and wet states fixed in a vertical wind tunnel (Fig 2d). Flow visualisation confirmed the presence of the SVR in both open and partially closed pappi (Fig 2e,f). We performed particle image velocimetry (PIV) (11) to spatially resolve the varying velocity of air in the region behind the pappus. Streamwise flow velocity was kept constant giving Re = 133-197 across different pappus angles. Our PIV analysis was able to detect the expected features of the SVR (Fig 2g, S2b,c) (1).
The velocity deficit behind porous disks is associated with negative pressure (12). A larger vortex with a greater velocity deficit may therefore increase the magnitude of the negative pressure, enhancing drag on the pappus. In the region of space directly behind the centre of the pappus, the magnitude of minimum streamwise flow velocity (minimum uz) showed no clear relationship with the pappus angle (Fig S2d). However, the location of minimum uz correlated with pappus angle (Fig 2g, S2e). At more open pappus angles, the position of minimum uz moved further downstream of the pappus (Fig 2g, p < 0.001, R2 =0.34).
We obtained uz velocity profiles in the r direction of the pappus at the location where uz was minimal (e.g. Fig S2b). The integral of a fixed central region of this velocity profile illustrates the magnitude of the velocity deficit in the wake of the pappus, with smaller values indicating a greater velocity deficit. This deficit is closely related to the drag force on the pappus. A significant negative relationship (p < 0.001, R2 = 0.65) was observed between pappus angle and the velocity integral (Fig 2i) indicating that a greater volume of air is moving more slowly behind the pappus when it is more open. Furthermore, the size of the vortex significantly changes with altered pappus angle. The nominal length (see Methods) of the vortex was markedly reduced at smaller pappus angles (Fig 2h, p < 0.001, R2 = 0.46).
As drag and falling velocity are strongly affected by moisture-dependent pappus morphing, we expected pappus closure would influence dispersal distances. We modelled the effects of varying falling velocity on dispersal distances in various weather conditions using hourly meteorological data for 30 years of the summer/autumn period (the period of dandelion reproduction) at 5 locations in the UK (Edinburgh, Manchester, Nottingham, Norwich, and Exeter). Wind speeds at the height of a dandelion infructescence were inferred as described by (13), assuming a release height of 35 cm from the ground (9). For Edinburgh, the hourly wind speeds varied around a mean of 4.0 m s−1 (Fig 3a) (measured 10 m above ground, equivalent to 0.7 m s−1 at dandelion height). We inputted the hourly wind speed data into the well-described analytical WALD model that predicts seed dispersal distances (14), with varying falling velocities according to weather conditions (Fig 3d-f, S3e-p). At high RH (RH = 90% used as dry/wet cut off), when dandelion pappi are more likely to be closed, wind speeds are relatively low, yet still variable (Fig 3a, S3a-e). Plants that disperse with a morphing pappus (open in dry conditions, closed when wet) show reduced median dispersal compared to those that are always open regardless of the weather (median = 0.60 vs 0.67 m). Long distance dispersal (defined here as the furthest 1% of dispersal distances) is also slightly reduced (Fig 3e) (median = 3.78 vs 3.90 m). These patterns were similar in all geographical locations examined (Fig 3d,e, S3e-h,m-p).

Same plots as Fig 3a-f corresponding to Manchester (a,e,i,m,q,u), Nottingham (b,f,j,n,r,v), Norwich (c,g,k,o,s,w) and Exeter(d,h,l,p,t,x).
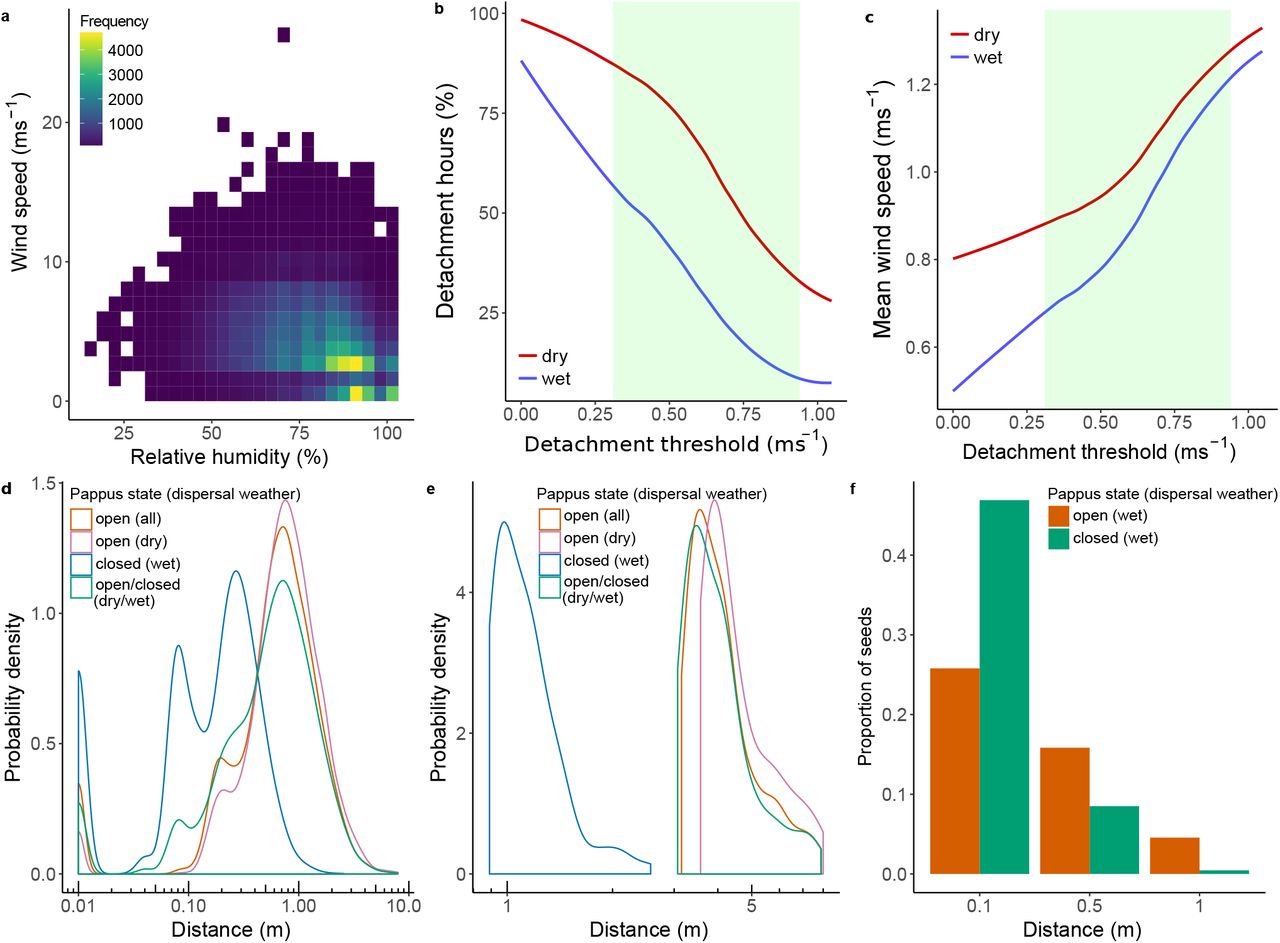
a relationship between relative humidity and wind speed in Edinburgh, UK, b fraction of time in which detachment could occur for dry conditions (red line, relative humidity less than 90%) or wet conditions (blue line, relative humidity greater than 90%) at varying detachment thresholds, green shaded area indicates the observed detachment range from ref (9) corrected to dandelion height, c mean wind speed at dandelion height above detachment threshold for dry conditions (red line) and wet conditions (blue line) at varying detachment threshold, d kernel density estimate of predicted dispersal distances for seeds with open or closed pappi and for different weather conditions, ‘dry’ indicates that only wind speeds observations for which humidity was less than 90% were used, ‘wet’ indicates the inverse, and ‘dry/wet’ corresponds to varying falling velocities depending on the humidity e kernel density estimate of predicted dispersal distances of furthest 1% of seeds in same conditions as d, f proportion of seeds travelling short distances in wet conditions with the pappus open or pappus closed.
From our earlier observations, we initially predicted that pappus closure would act to alter dispersal distances. However, our modelling showed only modest changes to both median dispersal distances and long distance dispersal (Fig 3d,e). Despite this, the suitability of locations for those seeds may not be equal. Considering only the dispersal of seeds in wet conditions, dispersal distances of seeds with a closed pappus are much more likely to remain close to the parent where it is wet, compared to those dispersing with an open pappus (Fig 3d-f).
Based on aerodynamic considerations, we also predicted pappus closure may affect detachment from the parent plant as the wind force required to detach seeds would increase. Correlations between detachment, higher wind speeds and low relative humidity have been observed for various wind-dispersed species during daily (15) and seasonal (16, 17) humidity cycles, indicating dry seed release may be generally beneficial. Field observations previously showed that dandelion seed detachment correlated with hourly wind speeds at 20 m height of 2-6 m s−1, which is equivalent to 0.31 - 0.94 m s−1 at dandelion height (9).
Using the meteorological data for all our tested locations, we analysed the fraction of time in which the wind speed is above the detachment threshold of 0.31 – 0.94 m s−1, and thus in which detachment could occur in either dry and or wet conditions. For dry conditions, a detachment threshold of 0.31 m s−1 at dandelion height results in 87% of dry hours in which hourly wind speeds are above threshold (Fig 3b), and a mean hourly wind speed for these hours of 0.9 m s−1 (Fig 3c). Assuming detachment occurs less easily in wet conditions, a threshold at the upper end of the observed range (0.94 m s−1), results in hourly wind speeds above threshold in just 9.7% of wet hours (Fig 3e) with a mean hourly wind speed of 1.2 m s−1 (Fig 3c). This indicates that reduced seed detachment when wet may generally prevent dispersal initiation during times with low wind speeds.
Force thresholds on detachment are an important mechanism by which plants can bias timing of dispersal in favour of increased wind speeds (9, 15, 18–22) and is thought to promote long distance dispersal (19, 21, 22). Since our meteorological analysis indicated that the likelihood of seed detachment may be affected by humidity, we tested detachment experimentally in a wind tunnel. We placed the infructescence in a wind tunnel (Fig S4a) and assessed the number of seeds detaching at varying wind speeds (Fig 4). Hydrating samples for one hour significantly (p < 0.001, χ2 = 341, df = 1) reduced detachment for the range of wind speeds tested (Fig 4c, Fig S4b). In flow with 9.1% turbulent intensity, 24% of dry diaspores remained attached at the maximum wind speed (9.8 m s−1), compared to 50% of wet diaspores (Fig 4c). Reducing the turbulent intensity of the flow also reduced seed detachment (Fig S4b,c). These data indicate that hydration and air flow impact on the initiation of dispersal, consistent with detachment data for thistles (20, 23, 24).

a schematic illustrating experimental setup for detachment assays, bsurvival plot of percentage of fruits attached to capitula at varying wind speeds for 1.7% turbulent intensity flow in dry and wet conditions, tested 3 days after opening of capitula, n = 21 capitula per treatment corresponding to 3736 and 3652 seeds for dry and wet conditions respectively, shading around lines indicates s.e.m. c survival plot of percentage of fruits attached to capitula at varying wind speeds for dry conditions with turbulent intensities of 1.7% and 9.1%, tested 3 days after opening of capitula, (data for 1.7% turbulent intensity are the same as for dry capitula in panel b), n = 20 capitula for the 9.1% turbulent intensity treatment corresponding to 2677 seeds, shading around lines indicates s.e.m.

a snapshots of detachment at 8 m s−1 wind speed for a dry capitulum, b snapshots of detachment at 8 m s−1 wind speed for a wet capitulum, c survival plot of percentage of fruits attached to capitula at varying wind speeds for 9.1% turbulent intensity flow in dry and wet conditions, tested 10-14 days after opening of capitula, n = 20 capitula per treatment corresponding to 3001 and 2654 seeds for dry and wet conditions respectively, shading around lines indicates s.e.m.
Dispersing far from a parent is often considered favourable as resource competition is reduced, but this is not the only factor affecting niche suitability. Soil moisture levels are temporally and spatially variable (25), more than characteristics such as light and temperature (26), meaning that optimal germination sites and times may vary considerably with changing weather and microenvironments. Adult dandelion plants occupy a quite variable hydrological niche, indicating that they tolerate an environment with appreciable frequencies of both flooding and drought (27). Seedlings are more sensitive to hydrological fluctuations but germinate well in high moisture conditions (28).
Moisture-induced pappus morphing may thus be a form of informed dispersal, in which dispersal is directed according to environmental cues signalling more favourable conditions (2). In contrast to the popular perception that plant migration is a passive response to wind and other carriers, our extensive literature review revealed otherwise (3). Plants are not able to make conscious decisions influencing their behaviour, but can form mechanical or chemical structures that respond differentially to the environment. There are two types of informed dispersal in plants: developmental adaptation of heteromorphic seeds to environmental stresses (29), which acts over a longer time-scale responding to stable environmental conditions, and a few examples that are highly temporal and local as observed here. Such short-term regulation may be particularly beneficial in responding to unpredictable or fast changing conditions.
We have characterised the moisture-induced changes to structural functions of dandelion diaspores, a phenomenon that occurs in many (possibly most) pappus-bearing diaspores (7, 8). We have tested the ecological implications of this biomechanical response to moisture concluding that pappus closure acts to tune dispersal, preventing long distance dispersal when local conditions are favourable. As many species modify their seed or fruit structure in response to water, this may be a general mechanism to ensure dispersal at appropriate times. Considering how prevalent environmentally induced plasticity is in plant structure and its development, understanding of structural functions within environmental contexts is critical to predict the ecological consequences of climate change (30). Insights into ecological and environmental drivers in turn enable us to comprehend selective pressure that has acted and will act to evolve plant forms and their functions.
COMPETING FINANCIAL INTERESTS
The authors declare no competing financial interests.
Methods
Plant growth and samples
Taraxacum officinale samples were collected and grown as described previously (1). All samples were the progeny of plants grown in the greenhouse for 2 generations originating from the same individual. As this subspecies reproduces apomictically, all seeds used were considered to be genetically identical. For detachment assays, dandelions were grown in the greenhouse and stems with capitula harvested once the inflorescence had closed but before the infructescence had opened. 15 ml tubes were filled with water and covered by a piece of parafilm with a small hole in and the stems of samples placed through the hole. These samples were then placed in a greenhouse (ambient conditions except for day length, which is artificially extended with electric lighting to ensure at least 16 hours of daylight) to allow the infructescence (capitulum) to open.
Pappus angle measurements
Source data and analysis of 3D micro-tomography CT scans were identical to ref (1). Angles of each filament from the horizontal axis was calculated at a 2 mm radius from the centre of the pappus, with the beak aligned to the vertical axis. For all other pappus angle measurements, the angle was measured from 2D microscope or camera images. The pappus was aligned perpendicular to the objective/lens and pappus angle measured as the angle between the outermost filaments.
Moisture chamber imaging
The moisture chamber consisted of a 70 L airtight plastic box (Solent Plastics, UK). A hole was made in the box to pass cables through and the space around sealed with silicone sealant. Two USB microscopes (Maozua, USB001) were positioned horizontally to image dandelion seed samples, which were fixed in place by embedding in plasticine or individual pieces of foil shaped around the achene. An ultrasonic humidifier (Bottle Caps) was filled with distilled water and placed next to the dandelion samples. The ultrasonic humidifier releases small droplets of liquid water into the chamber meaning that relative humidity (RH) reaches 100% within the first few minutes. Samples were imaged each minute for the duration of the experiment. For relative humidities below 100%, dishes of saturated salt solutions were placed into the chamber to maintain defined, stable humidity levels (2). Relative humidity was monitored with a datalogger (Lascar, Easylog EL-GFX-2). Samples were imaged at 0 hours and 10 hours, when RH had long reached equilibrium.
Falling velocity assays
Drop tests were carried out using a modified version to the protocol in ref (1). Samples were tested in two batches (n = 10 and n= 11). First, all seeds were weighed together to obtain the mean weight per sample. Each sample was dropped 3 times and video recorded with a DSLR camera (Canon). Samples were then imaged in the moisture chamber while still dry. The humidifier was switched on for 1 hour and samples re-imaged. Seeds were removed from the chamber one by one and dropped 3 times before placing back inside the humid chamber to prevent further drying. After all samples were dropped, all were weighed together again. The mean increase in weight after wetting was 70 μg, which corresponds to approximately 10% greater weight when wet compared to dry. Falling velocity was determined from the video frames using a particle detection script (1).
Calculated variables
The projected area was calculated according to the pappus angle, assuming 100 straight, nonoverlapping filaments of length 7.41 mm and diameter 16 μm. Porosity was calculated as the ratio of empty space between filaments (i.e. 1 – projected area) to the total area of the circle that would enclose the projected area.
The Reynolds number is defined as  , where u is the flow velocity (the falling velocity, i.e. the undisturbed velocity of the fluid with respect to the pappus), D is the characteristic length scale (in our case, this is the diameter of the pappus assuming filament length of 7.41 mm and varies according to pappus angle) and ν is the kinematic viscosity of the fluid at 20°C.
The drag coefficient was calculated as follows:
 where ρ = 1.0241 kg m−3 is the density of air, A is the projected area of the disk, taking into account porosity, and g = 9.81 m s−1 is gravitational acceleration. Additionally, m is the mass of the seed, for which an average measured value of 0.614 mg was used for all dry samples and 0.684 mg for all wet samples.
Particle image velocimetry (PIV) and flow visualisation
Samples were fixed in place inside a vertical wind tunnel for flow visualisation and PIV (1). Long exposure images were obtained using a Canon DSLR camera (EOS 70D). The raw experimental images were processed to distinguish the region of interest (i.e. the SVR) from the reflective pappus. To do this, we applied a digital graduated neutral density filter using the “Curves” contrast adjust tool and the “Blend” tool within the open source software GNU Image Manipulation Program (GIMP version 2.8.22).
For PIV, videos were obtained with a high-speed camera (Fastcam Photron SA1.1) shooting at 125 frames per second fitted with a macro lens (Tamron). Air flow velocity was 0.207 m s−1 throughout. 100 frames of each video were analysed in PIVlab (Matlab) (3) using single pass direct cross correlation with a window size of 128 pixels (corresponding to 3.88 mm) and a window overlap of 64 pixels. Data were filtered by excluding vectors of more than 2 standard deviations and a normalised median filter (4) with a minimum normalisation level (ϵ) of 0.1 pixels and a detection threshold of 3. Vectors were interpolated where missing and the mean vector field of all 50 pairs of images was calculated.
Noisy rows of data from the images were excluded from further analysis by removing the first row of the image (row size defined by the window size), which was always noisy, and identifying other noisy rows by fitting an autoregressive integrated moving average model (R package ‘tsoutliers’) to the profiles of streamwise velocity (uz) across the r direction of the image. The velocity profiles with outliers were considered noisy. A z portion of the image with no more than one consecutive noisy row was considered to form the vortex region and was used for further analysis. Analysis was also limited in the r direction by excluding regions of data that fell outside of the limits of the dandelion pappus width. The co-ordinates of the central point of the pappus and the pappus angle were measured from images. The pappus limits were calculated assuming the pappus formed a triangular shape with filaments that were 7.41 mm long (1).
The point P of minimal flow was determined by finding where uz along the z-axis was minimal at the r location of the centre of the pappus. Let zp be the z-coordinate of P, D the diameter of the pappus and τ the pappus angle. We found that
 (p < 0.001, R2 =0.34).
Using this relationship (Fig 2f), we identified a nominal z-coordinate of minimal uz at which we measured the wake deficit. At this co-ordinate, uz profiles across the r direction of the image were plotted (e.g. Fig S2b) and the following integral calculated (Fig 2h)
 to establish the extent of the velocity deficit in the wake of the pappus. Integrals were calculated for a fixed 10 mm window around the centre of each sample. This distance was chosen as it corresponds to the smallest observed pappus diameter in the dataset. The flow structure is not well resolved beyond the radial limit of the vortex (the frame rate is too low to capture the fast flow speed of the external regions) so this limited the r range for the analysis.
Similarly, it was not possible to identify the downstream stagnation point where the velocity vanished and thus the nominal vortex length was determined by obtaining the point beyond the centre of the pappus at which uz = 0.02 m s−1. This does not give the actual length of the vortex but gives an indicative value to compare between samples and treatments.
Meteorological data analysis
Hourly meteorological data was obtained from the Integrated Surface Database from the National Centers for Environmental Information (USA). Data for a 30 year period (1987 – 2017) were acquired for each location (Edinburgh (55.950, −3.373), Norwich (52.676, 1.283), Nottingham (52.831, −1.328), Manchester (53.354, - 2.275), Exeter (50.734, −3.414)) and filtered according the following criteria: entries were excluded if hourly wind speed, dewpoint or temperature were missing; data were only used from the beginning of April to the end of October in each year; occasional data measured between hours were excluded. Relative humidity was calculated from the dewpoint and temperature.
The release height of dandelion seeds was assumed to be 0.35 m according to ref (5). Wind speeds at this height were calculated by integrating the wind speed over a logarithmic profile following ref (6) and ref (7).
Dispersal modelling
The WALD model of wind dispersal was used to predict dandelion seed dispersal distances at varying terminal velocities (8). This is an analytical mechanistic model based on an inverse Gaussian distribution that uses hourly wind speeds and features of vegetation structure to predict dispersal kernels. Vegetation height around dandelions was taken to be 0.17 m, a value obtained from LEDA, a database of Northwest European flora life history traits (9). We assumed surface roughness, friction velocity and turbulent flow to be similar to dispersal of thistle species (short herbaceous vegetation), so used the same values and calculation methods for these parameters as (6).
As dandelion pappi can partially close at RH > 70% (Fig S1b) and field-measured RH > 90% is a good proxy for wetness on plant surfaces (10), we used RH = 90% as a cut-off point between dry and wet conditions.
Seed falling velocities for dry and wet conditions were 0.3 and 0.7 m s−1 respectively, corresponding to the measured values from our drop tests.
Dispersal kernels were obtained for each location by selecting a time point at random, calculating the wind speed at dandelion height (as above) and selecting a dispersal distance according to the probability distribution given by the WALD function. This was repeated for 10,000 simulations for each model run giving an overall dispersal kernel for the weather conditions at that location.
Detachment assays
A modified version of the method in ref (11) was used to assess detachment of seeds from the capitulum. Tests were conducted in a horizontal, open-circuit wind tunnel. The test section was 1 m long with a rectangular cross-section of 450 mm x 400 mm (Fig S4a). Either 3 days (Fig S4b,c) or 10-14 days after opening (Fig 4c), samples were placed in the middle of the test section and were subjected to a flow speed of 2 m s−1 for 30 seconds. Samples were held in place by passing an aluminium rod (rod diameter =1.5 mm or 3 mm depending on stem diameter) through the hollow stem attached to the capitulum or for older samples, in which the stem had degraded, were clamped to the rod. Detached seeds were collected in a mesh at the end of the test section (Fig S4a) and counted. This was repeated for 4, 6, 8 and 10 ms-1. After the maximum wind speed, the number of seeds remaining on the capitulum was also counted. For more turbulent conditions, a grid consisting of 11 equally spaced vertical rods (diameter =10 mm) was created and placed inside the test section (200 mm downstream of the inlet). This increased turbulence intensity to 9.1%, but the maximum wind speed was reduced slightly to 9.8 m s−1 and this was used instead of 10 m s−1. The turbulent intensities used here are comparable to that in some natural conditions (12), though turbulence in the atmospheric boundary layer exhibits enormous variability, with values as high as 400% reported (13).
Wet capitula were treated by placing in the moisture chamber with the humidifier switched on for one1 hour before placing in the wind tunnel.
Data analysis and statistics
All measurements were carried out on separate individual seeds from different infructescences except detachment assays, in which multiple seeds from each infructescence were counted.
Detachment assays were analysed by fitting Kaplan-Meier survival models to the data, with log-rank tests used to compare treatments (R package ‘survival’). For falling velocity tests, the following model was fitted to the data where: failing velocity ~ cos−2/3τ similarly to ref (14) and dry and wet groups were compared using Student’s 2-sample t-test. For PIV data, linear regression models were fit to the data. For the plot of the relationship between CD and Re, loess regression with a span of 0.8 was used to illustrate the trends in the data.
Data were inspected for normality where appropriate.
For boxplots, the centre line is the median, hinges indicate first and third quartiles, and whiskers extend to largest value no further than 1.5 times the interquartile range.
ACKNOWLEDGEMENTS
We thank Alex Twyford, Jonathan Silvertown and Tomasz Zielinksi for critical reading of the manuscript. We also thank Kazan Federal University Library for providing access to the 1894 manuscript by Taliev (8).
Footnotes
↵† Sadly deceased 15 July 2019 during preparation of this manuscript.


