

Abstract
Microtubules are highly dynamic polymers that play fundamental roles in all eukaryotes. As the control of microtubule nucleation and regulation is central to their function, there has long been interest in obtaining quantitative descriptions of microtubule polymerization. Textbooks have focused on variations of a nucleation-elongation mechanism: monomers are in rapid equilibrium with an unstable oligomer (nucleus), but once the nucleus forms, the polymer grows by monomer addition. While such mechanisms readily capture the actin assembly process, they are inadequate to describe the physical mechanism by which the much larger and more complex microtubules assemble. Here we develop a new model for microtubule self-assembly that has three key features: i) microtubules initiate via the formation of closed, 2D sheet-like structures which grow faster the larger they become; ii) the dominant pathway proceeds via addition of complete longitudinal or lateral layers; iii) as predicted by structural studies and the lattice model, the formation of lateral interactions requires payment of an energetic penalty for straightening early structures. This model quantitatively fits experimental assembly data, and provides important insights into biochemical determinants and assembly pathways for microtubule nucleation.
Introduction
The microtubule cytoskeleton plays essential roles organizing the interior of eukaryotic cells: microtubules can act as “tracks” for motor-based transport, they make up the mitotic spindle that mediates proper segregation of chromosomes during cell division, they help define cell polarization, and more (Desai and Mitchison, 1997; Prosser and Pelletier, 2017; Barlan and Gelfand, 2017). To fulfill these many roles, microtubules must assemble into a multitude of highly dynamic and spatially diverse networks. The dynamic instability of microtubules (Mitchison and Kirschner, 1984), which describes the switching of individual polymers between phases of growing and shrinking, allows wholesale reorganization of the microtubule network to occur rapidly and also provides a mechanism to efficiently search space (Holy and Leibler, 1994). Indeed, a host of regulatory factors allow cells to control how fast microtubules grow and how frequently they switch from growing to shrinking (catastrophe) or from shrinking back to growing (rescue) (Akhmanova and Steinmetz, 2015), and also to control the creation of new microtubules (Wieczorek et al., 2015; Kollman et al., 2011; Roostalu and Surrey, 2017), a process called nucleation.
Microtubules are hollow, cylindrical polymers formed from αβ-tubulin heterodimers that interact with each other in two ways: stronger head-to-tail (longitudinal) interactions between αβ-tubulins make up the straight protofilaments, and weaker side-to-side (lateral) interactions hold protofilaments together. The mechanisms underlying the dynamic instability of existing microtubules are increasingly well understood (Alushin et al., 2014; Zhang et al., 2015; Manka and Moores, 2018; Duellberg et al., 2016; Gardner et al., 2011; Geyer et al., 2015; Piedra et al., 2016; Driver et al., 2017; VanBuren et al., 2002; 2005; Grishchuk et al., 2005), but our understanding of spontaneous microtubule nucleation remains relatively primitive (reviewed in (Roostalu and Surrey, 2017)). Multiple factors contribute to this difficulty: first, nucleation occurs very rarely, so measuring it directly is much harder than measuring the growing and shrinking of existing microtubules. Second, the open, tube-like structure of the microtubule also poses unique challenges to assembly. In most organisms, microtubules contain 13 protofilaments, although there are clear examples of specialized microtubules containing 11 or 15 protofilaments (Chalfie and Thomson, 1982; Davis and Gull, 1983; Kwiatkowska et al., 2006; Burton et al., 1975; Saito and Hama, 1982; Tucker et al., 1992; Chaaban et al., 2018). Regardless of protofilament number, the hollow nature of the microtubule means that it takes many more αβ-tubulin subunits to close a tube than it does to make a minimal helical repeat for a simpler, helical polymer like actin. Perhaps not surprisingly given this structural complexity, there is no consensus for the sequence of intermediates that must be formed (pathway) during the transition from individual subunits to a closed tube. To complicate matters, the structure of the free heterodimer also changes from a bent confirmation in solution to a straight conformation within the final microtubule (reviewed in (Brouhard and Rice, 2018)). Once thought to be mediated by an allosteric transition within the heterodimer, it is now appreciated that this change occurs on the growing microtubule (lattice model) (Rice et al., 2008; Nawrotek et al., 2011; Ayaz et al., 2012). However, where in the assembly process the straightening takes place, how much energy is required, and how this obligatory conformational change affects nucleation all remain unknown. In addition to these factors, the biochemical processes underlying catastrophe also act to antagonize nucleation by destabilizing nucleation intermediates.
An early study of the kinetics of spontaneous microtubule nucleation, which used solution conditions that suppress catastrophe to simplify the behavior, posited that nucleation proceeded sequentially through two discrete intermediates (Voter and Erickson, 1984). The data from this pioneering study were later demonstrated to display a property called phenomenological scaling (illustrated in Fig. 1 using our own data), which allowed a more robust analysis that suggested the presence of additional intermediates (Kuchnir Fygenson et al., 1995; Flyvbjerg et al., 1996). The pathway proposed in this later work contains four distinct nucleation intermediates (6-mer, 9-mer, 12-mer, and 15-mer of αβ-tubulin); the largest intermediate was postulated to represent a ‘turning point’ after which elongation occurred by repeated additions of individual αβ-tubulin subunits. Demonstrating phenomenological scaling for the spontaneous nucleation data was important because it pointed to a common molecular mechanism over the entire concentration range measured, and because it provided a way to assess the self-consistency of experimental measurements. At the same time, the authors of that study also acknowledged that it was not possible to ascribe a biochemical interpretation to the species and rate constants of the abstracted kinetic model they put forth (Flyvbjerg et al., 1996). Indeed, when this modeling is applied to our own data, it actually predicts a non-integral number of steps, each of which add a non-integral number of αβ-tubulin heterodimers per step. Thus, while it is able to fit the kinetic data, this type of model cannot accurately capture the physical-chemical details of the underlying assembly process. Moreover, kinetic models such as these do not provide information on the specific geometry of the proposed intermediates.

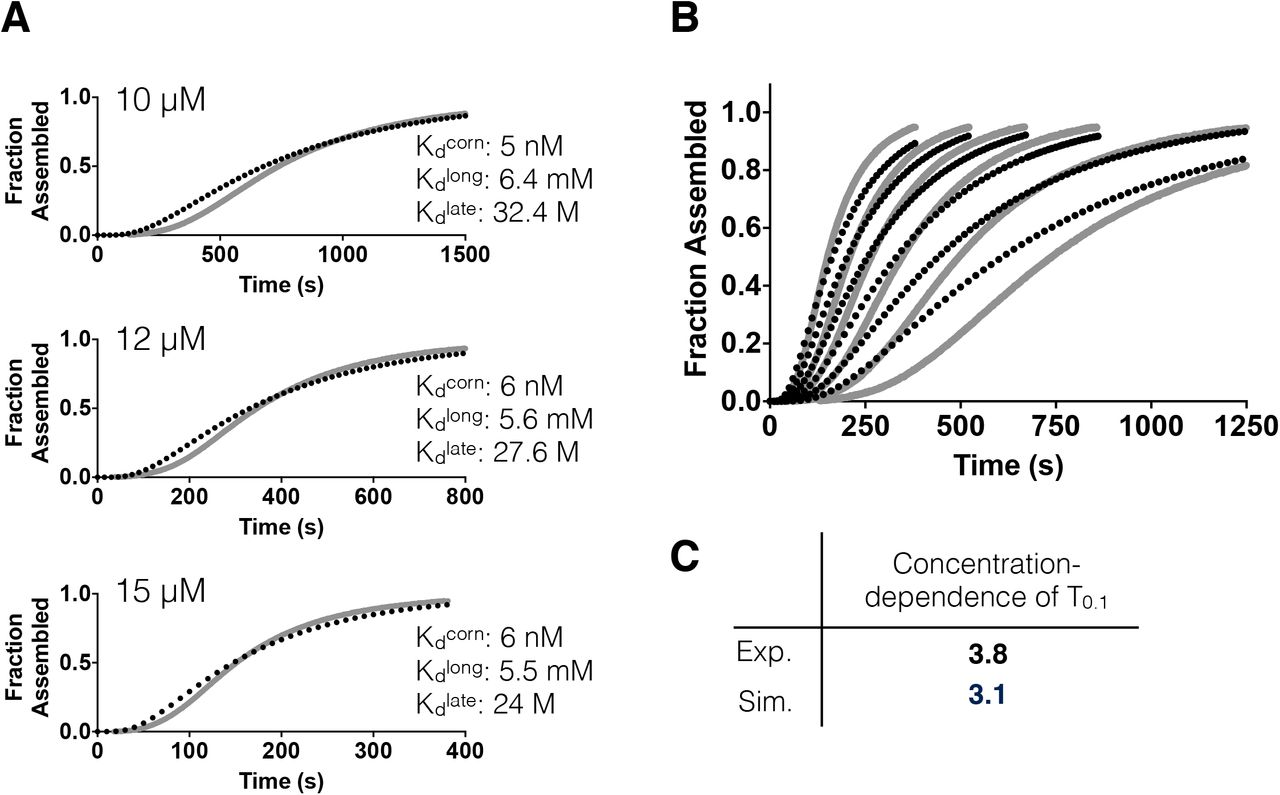
A Time course of spontaneous microtubule assembly measured by turbidity (absorbance at A350 nm) at ab-tubulin concentrations of (10, 11, 12, 13, 14, and 15 μM).
B The same data as in A but with the turbidity values of each curve normalized by the corresponding plateau (steady-state) value achieved. Inset shows the same data plotted on logarithmic axes. The horizontal red line indicates 10% assembly.
C Data from B but with the time values for each curve normalized by the corresponding T0.1 (time taken to reach 10% assembly). Inset shows how T0.1 depends on concentration. The collapse of all curves after this scaling procedure indicates that a common mechanism operates over the entire concentration range (Flyvbjerg et al., 1996).
D Cartoon of a mechanism to explain spontaneous microtubule nucleation previously postulated based on this kind of scaling analysis. The basic idea is that nucleation proceeds through a small number of discrete intermediate species: for the scaling analysis of the data presented in A the sequence of oligomers would be 8-mer, 12-mer, 16-mer (in other words, two intermediate species precede the 16-mer nucleus).
In this work, we sought to obtain more explicit insight into the molecular mechanisms of spontaneous microtubule assembly. While additional complexity and parameters could always be added, our primary goal was to explore the simplest biochemical models that could faithfully explain the experimental data. We build from the basic modes of αβ-tubulin interactions within a microtubule: a single subunit can make a longitudinal interaction, a lateral interaction or make both simultaneously (corner interaction). Starting with explicit simulations of the biochemical reactions that can occur for all possible αβ-tubulin oligomers up to 12-mers, we observed that a very small number of oligomers represent the dominant species. These oligomers are the “rectangular” ones in which the number of longitudinal and lateral contacts is maximized, such that they have no unfilled corners. Using this key insight, we developed an approximate model that only considered these dominant species, allowing us to include arbitrarily large oligomers while retaining a connection to the biochemical properties of individual subunits. Fitting this approximate but biochemically faithful model to experimental time courses for spontaneous microtubule nucleation yielded a new way to view microtubule nucleation. Rather than proceeding via a rare, rate limiting “nucleus”, our model indicates that microtubule assembly involves the continuous accretion of αβ-tubulins into a growing 2D lattice. Like crystallization processes, the larger the assembly, the faster it grows. Beyond this, our model reveals the dominant assembly pathways for forming a new microtubule, and provides new insights into how exogeneous nucleators and other regulatory factors can accelerate microtubule formation.
Results
Closed species dominate the assembly pathway
While phenomenological models for microtubule assembly can recapitulate observed assembly kinetics, they do not provide a direct connection to the sequence of assembly intermediates or to the underlying biochemical affinities. To provide insight into the biochemical determinants of αβ-tubulin self-assembly, we constructed an explicit model that includes all non-redundant tubulin oligomers from dimers through dodecamers (Fig. 2A shows all intermediates through hexamers). Here non-redundant means that we only consider a single exemplar n-mer for each unique combination of longitudinal and lateral contacts (Sup. Fig. 1 explains this using an example). We defined the biochemical pathways that connect different oligomers (arrows in Fig. 2A) by assuming that oligomers grow and shrink via addition and loss of individual αβ-tubulin subunits. An explosion in the number of species and reactions with increasing size made it impractical to explore oligomers larger than dodecamers (reaching dodecamers requires ~200 species and ~600 reactions) (Fig. 2F).

A Cartoon of the model. Individual ab-tubulin heterodimers (ovals) can associate longitudinally (blue arrows) or laterally (orange arrows). As oligomers grow in size, they can present sites where an associating tubulin would simultaneously make longitudinal and lateral interactions (“corner”; bold black arrows). The resulting collection of species and reactions was implemented in BerkeleyMadonna (Macey et al., 2009) for simulations. Species up to 6-mers are shown, but the model includes species up to 12-mers. Rapid growth of the number of oligomers and reactions with size made it impractical to consider even larger oligomers.
B (left) Plot showing that ‘rectangular’ species dominate the simulation. The four dominant species are shown, with values in parentheses indicating the height and width for the oligomers. (right) The same data plotted on a logarithmic concentration scale. Other closed oligomers are much less common. Non-rectangular oligomers are not shown, but are also much rarer than the dominant oligomers shown.
C A simplified ‘layer growth’ model that only considers rectangular oligomers. Arrows indicate longitudinal (blue) or lateral (orange) layer growth. The resulting collection of species and reactions was implemented in BerkeleyMadonna for simulations (see Methods)
D Cartoon of a ‘layer’ addition reaction with associated rate constants. The equilibrium constant and rate constant for layer addition can be defined in terms of underlying longitudinal, lateral, and corner affinities and a single on rate constant. An effective equilibrium constant and an approximation of the effective forward rate constant for this layer addition are shown. See Methods for derivations.
E Similar to B but showing results from simulations of the simplified layer model. This much simpler model with many fewer species and reactions quantitatively reproduces results from the explicit model.
F (left) Plot of the species count for all possible oligomers (black) and for the subset of closed oligomers (red). The extrapolation to a 40-mer emphasizes the magnitude of the simplification. (right) Similar plot but for the number of biochemical reactions.
We implemented the differential equations describing this discrete assembly scheme in Berkeley Madonna (Macey et al., 2009) to simulate the assembly pathway and kinetics. The only free parameters in this model are the affinities for the three different αβ–tubulin interaction modes (longitudinal, lateral, and corner (simultaneous longitudinal+lateral interaction) (Fig 2D); as is common, the on-rate constant kf was assumed (here we chose 106/sec based on experimental observations and consistent with work from others (VanBuren et al., 2002; Margolin et al., 2012; Zakharov et al., 2015; Coombes et al., 2013; McIntosh et al., 2018)). We sought to identify conditions under which some appreciable concentration of dodecamers would form, revealing that a relatively tight corner affinity (Kdcorner < 0.2 μM; Sup. Fig. 2) was required for flux into the largest oligomers. Importantly, the basic behavior is invariant to the choice of on-rate constant, although the value chosen does affect the best-fit affinities. Under conditions of high-affinity corner interactions, the simulations predominantly populated a small number of ‘closed’ oligomers (Fig. 2B). More explicitly what happens is that formation of an initial 2×2 oligomer occurs relatively quickly. Because of the weak longitudinal and lateral affinities, the next larger species containing a ‘singleton’ tubulin is poorly populated but presents an open, high-affinity corner site. Filling this stabilizes the first subunit and in the case of a 2×2 start, fills the next longitudinal or lateral layer. On larger assemblies, additional corners are vacant, which rapidly fill, essentially “zipping up” the layer. The net consequence is that closed species predominate, and that once initiated, layer completion occurs efficiently. This suggests that only considering transitions between closed oligomers could provide a much simpler assembly pathway still capable of quantitatively capturing the intricacies of microtubule assembly behavior. Importantly, such a scheme allows much larger oligomers to be simulated while maintaining a manageable number of reactions (e.g. Fig. 2C,F).
Whereas the reaction rates for each elemental reaction in the complete model (above) are invariant, in the reduced model the rates for adding or losing a layer are context dependent because they depend on the size and shape of the oligomer. Using the steady-state approximation, we derived an expression for the effective ‘forward’ rate constant governing addition of a longitudinal or lateral layer (Fig. 2D shows a simple example, the general expression and its derivation are provided in Methods). Considering the layer addition as a sequence of individual steps also allowed us to derive a ‘layer equilibrium constant’, which describes the expected populations of oligomers differing by a layer (Methods). Notably, both the rate constant and equilibrium constant for layer addition are defined in terms of the biochemical properties of individual subunits. Consequently, and in contrast to what occurs with phenomenological models, the reduction in the number of species and reactions (>10-fold for species and >35-fold for reactions up to 12-mers) afforded by the layer pathway does not come at the expense of a lost connection to the fundamental biochemical behavior.
We implemented the reduced, layer-based model into Berkeley Madonna to test if it could recapitulate the results from our explicit simulations when using the same input parameters for subunit affinities. Despite the dramatic reduction in complexity, and with the exception of very low-abundance intermediate species, the simplified layer-based simulations quantitatively reproduced the oligomer concentrations and the kinetics of oligomer formation observed with the explicit model (compare Fig. 2E to 2B). These initial benchmarking layer simulations only considered oligomers up to dodecamers so that we could make a direct comparison with the explicit model, but the formulaic nature of the oligomer sizes and transition rates in the reduced model means that this approach can easily be extended to much larger oligomers (Fig. 2F). Thus, the layer model provides a tractable way to simulate the pathway and kinetics of microtubule assembly in terms of the elemental biochemical interactions.
A simplified accretion pathway for spontaneous microtubule assembly
We wrote a custom program to expand the layer model to arbitrary sized oligomers without having to specify each one manually. Whenever an oligomer gained a 13th protofilament, we converted it into a microtubule. No additional penalty for seam formation was included. We assumed that once formed, microtubules elongate by capturing αβ-tubulin subunits one at a time in the open, pseudo-helical ‘corner’ sites on either end. In order to minimize the number of adjustable parameters, the same rate constants were used for events at either the plus-or minus-ends. These additional simplifying assumptions allow us to simulate spontaneous microtubule assembly (within the constraints of the layer model) without having to specify a particular nucleus or preferred assembly pathway.
We began testing our model by fitting it to a subset of our experimental assembly curves (taken from Fig. 1). The model fit these individual curves quite well (Fig. 3A), with minor discrepancies evident at low concentration. The optimized affinities differed somewhat from fit to fit, but shared common features: tight corner affinities (Kdcorn < 100 nM), weaker longitudinal affinities (Kdlong ~5-15 mM), and lateral affinities around 10-fold weaker than longitudinal affinities (Fig. 3A). We found it encouraging that the model could fit individual assembly curves, but to be convincing a single parameter set should be able to fit all the assembly curves simultaneously.

A Fits of the model (black dotted line) to individual assembly curves (solid grey line) at different concentrations. Fits to individual curves are good. Inset text shows the resulting longitudinal, lateral, and ‘corner’ (simultaneous longitudinal and lateral interactions) affinities, which differ somewhat from run to run.
B Global fit of the model (black dashed lines) to the full set of assembly data (grey lines). As evidenced by the poor fit at low concentration and by the concentration-dependence of the T0.ı (see C), the model underestimates the concentration-dependence of the progress curves.
C Tabulation of the concentration-dependence of T0.1 for the experimental data and for the model fit.
D (left) Cartoon illustrating that longitudinal dimers of αβ-tubulin could contribute to lateral growth. The associated forward rate constant for this case is also shown.
E The relative contribution of ‘monomer’ and ‘dimer’ initiation pathways can be estimated as indicated based on the affinities of longitudinal and lateral interactions. Plot predicting the fractional contribution of a ‘dimer’ pathway for lateral growth in terms of the relative strength of longitudinal and lateral interactions. The red star indicates the ratio obtained from the fit shown in B. Those parameters predict that the ‘dimer’ pathway should dominate the assembly, but it is not accounted for in our model.
In a global fit to the set of assembly curves (Fig. 3B), a limitation of the model became apparent: it could not simultaneously capture the correct behavior over the broad concentration range measured (Fig 3B), even though each individual concentration could be well fit (Fig 3A). Because all transition rates scale with the chosen on-rate constant (see derivations in Methods), changing the on-rate would not improve the global fits. The concentration dependence can be quantified in part from the slope of a plot of the log(T0.1) vs log(concentration) (inset Fig 1C, Fig 3C). The steeper this slope, the greater the spread in lag times with concentration. This discrepancy between model (slope = 3.1) and experiment (slope = 3.8) suggests that the model is missing some key behavior. In re-examining our assumptions, we realized that it was too restrictive to only consider monomer addition and loss as possible ‘elemental’ reactions within the layer assembly pathway. In fact, a simple calculation demonstrates that a ‘dimer pathway’ must be considered. Compared to the ‘two step’ monomer-based pathway in which a first monomer associates weakly and only becomes ‘locked in’ by a subsequent corner association (Fig. 3D, middle path), when the longitudinal affinity is stronger than the lateral one it is more efficient to initiate a lateral layer by adding a pre-formed longitudinal dimer (Fig. 3D, lower path). This is true even though longitudinal dimers are present at very low concentrations (roughly 1 part in a 1000 or ~10 nM). Our ‘monomer only’ model fit required a longitudinal affinity ~10-fold stronger than the lateral one, but under those conditions the dimer pathway, which was not accounted for in the monomer model, should account for ~90% of the lateral layer initiations (Fig. 3E). Thus, the reasonable looking fits do not make biochemical sense, because the monomer model ignored a pathway that has the potential to dominate the flux through oligomers.
Incorporating a dimer pathway fails to recapitulate experimental data without invoking a switch in lateral affinity
The cartoons and calculations presented in Fig. 3D,E illustrate how the rate of initiating a new lateral layer will be very sensitive to the concentration of αβ-tubulin longitudinal dimers. By contrast, once the slow step of initiating a new layer has occurred, zipping up occurs almost exclusively via addition of αβ-tubulin ‘monomers’, which far exceed longitudinal dimers in number/concentration. It is not necessary to include a dimer pathway for initiating a longitudinal layer: lateral dimers are very rare, and the ‘upper’ αβ-tubulin of a longitudinal dimer provides no increased stabilization as a longitudinal layer builds up.
Incorporating a parallel, dimer-based pathway for initiating lateral layers requires that at each step we specify (i) the concentration of longitudinal dimers, (ii) an association rate constant for the longitudinal dimers adding to a complete layer, and (iii) a dissociation rate constant for the lateral ‘unbinding’ of a longitudinal dimer (Sup. Fig. 3). The concentration of longitudinal dimers is easily calculated given the concentration of monomers and the equilibrium constant for longitudinal interactions. Because off-rate constants tend to vary over a much larger range than on-rate constants, for simplicity we used the same, roughly diffusion limited association rate constant as we do for monomers. We derived a formula that expresses the equilibrium constant for lateral association of a longitudinal dimer solely in terms of biochemical properties of the monomers (Sup Fig. 3). Parameterizing the ‘dimer pathway’ in terms of monomer biochemistry thus allows us to incorporate a higher-order reaction without losing connection to the fundamental monomer properties.
We first fit the dimer model to individual assembly curves, as we did for the monomer model (Fig. 4A). The longitudinal and corner affinities for these dimer model fits were comparable to those obtained from fits of the monomer model. The lateral affinity (~25-30 M in the dimer model) was ~30-fold weaker than the in the monomer model (~100 mM), reflecting a greatly diminished contribution of the monomer pathway for lateral initiation. While required biochemically, including a dimer pathway worsened the ability to capture the shape of individual assembly curves compared to the monomer-only fits. For the dimer pathway, the simulated assembly curves displayed a less pronounced lag phase and also appeared less cooperative (shallower sigmoid transition; compare Fig. 4A to Fig. 3A). Global fits of the dimer model to the set of assembly curves were markedly poorer than for the monomer model – in addition to showing a too shallow transition after the lag phase, the concentration-dependence of the characteristic time (T0.1) for assembly was too low (Fig 4C). Thus, a more complete biochemical model for the assembly process paradoxically degraded its predictive power.
A Fits of the new dimer model (black dotted line) to individual assembly curves (solid grey line) at different concentrations. Fits to individual curves are worse than for the monomer only model. Inset text shows the resulting longitudinal, lateral, and ‘corner’ (simultaneous longitudinal and lateral interactions) affinities; these differ mainly in the magnitude of the lateral affinity, which is much weaker than for the monomer only model.
B Global fit of the model (black dashed lines) to the full set of assembly data (grey lines). The fit is very poor, with the model predicting too fast assembly at all concentrations.
C Tabulation of the concentration-dependence of T0.1 for the experimental data and for the model fit. Consistent with the poor fit, the dimer model fails to capture the correct concentration dependence. The dimer model thus also underestimates the concentration-dependence of the progress curves.
Why was the monomer-only model able to fit the observed assembly curves so much better than a model incorporating a dimer pathway? The presence of a dimer pathway makes the effective rates of lateral and longitudinal growth much more comparable to each other (Fig. 3D, compare top and bottom rate expressions), whereas in the monomer-only model there is significantly more contrast between the rates for longitudinal and lateral growth. We speculated that the otherwise more exact monomer+dimer model must still be missing a critical feature that acts to penalize lateral growth.
Previous structural studies provide a physical justification for such a penalty (Pecqueur et al., 2012; Nawrotek et al., 2011; Ayaz et al., 2012; Wang and Nogales, 2005). Indeed, it is now well established that unpolymerized αβ-tubulin subunits adopt a ‘curved’ conformation in solution and that the microtubule lattice itself acts as an allosteric activator to ‘straighten’ αβ-tubulin during the assembly process (Buey et al., 2006; Rice et al., 2008; Ayaz et al., 2012; Nawrotek et al., 2011). That is, αβ-tubulin becomes progressively straighter as it becomes increasingly surrounded by lateral neighbors (reviewed in (Brouhard and Rice, 2018)) (Fig 5A); this straightening-induced conformational strain should work against lateral interactions, weakening those contacts. To explore these ideas in the context of our model, we introduced a very simple lateral penalty to mimic the greater strain intrinsic to straighter conformations: we assumed that the lateral interactions after the first pairing in a given ‘row’ were X-fold weaker.

A Cartoons illustrating αβ-tubulin straightening, which is thought to occur progressively with width (the number of lateral neighbors). To model this in a very simple way, we introduced a penalty to make lateral interactions weaker for the 3rd and successive lateral interactions.
B Performance of the ‘dimer with penalty’ model as a function of penalty strength. The improved goodness of fit from the global optimization is not very sensitive to the magnitude of the penalty, as long as the penalty is ~8 or greater.
C Illustration of the model fit to the experimental data for a penalty value of 8.
We fit the monomer+dimer+penalty model to the data as before, testing a range of penalty magnitudes (from 1 to 16 in Fig. 5B). The global fit to the experimental curves improved as the magnitude of the lateral penalty increased, with the best fits reached for penalty values greater than 4. Thus, penalizing lateral growth was sufficient to ‘correct’ the problems associated with the presence of a dimer pathway, and this correction only weakly depends on the value of the penalty, as long as the penalty is sufficiently large (Fig. 5B). A representative global fit (penalty value = 8, Fig. 5C,D) shows that the fit to the data is even better than for the monomer-only model (see Fig. 3B,C). Runs with other penalty factors gave fits of comparable quality, but as expected yielded somewhat different longitudinal and lateral affinities. Collectively, our computational experiments led us to what we believe to be the first simple, biochemically-based model that can recapitulate the observed concentration-dependent kinetics of spontaneous microtubule assembly.
A kinetically frustrated pathway for spontaneous microtubule assembly
The model developed here provides a biochemically-based pathway for microtubule assembly and explains why the kinetics of initial assembly are slow relative to polymer elongation. To describe this pathway, in what follows we focus on the width (lateral extent) of oligomers because the endpoint of the process--closure of the cylindrical lattice – typically requires a minimal width (fixed at 13-wide in our model).
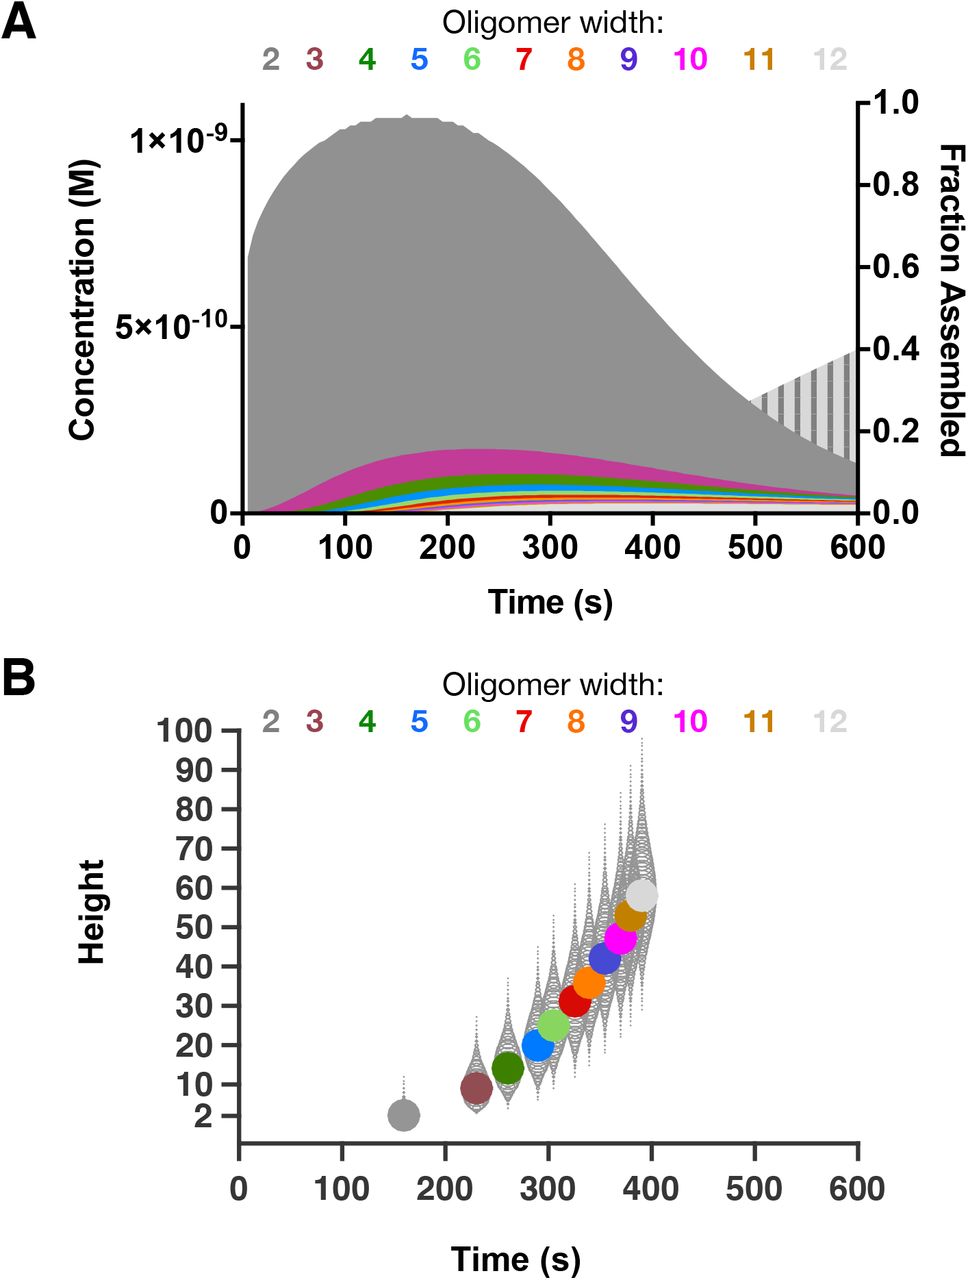
The summed concentration of different width tubulin oligomers as a function of time reveals that the concentration of oligomers decreases as width increases – there are fewer 3-wide oligomers than 2-wide, fewer 4-wide then 3-wide, etc. (Fig. 6A). This means that the transition from one width to the next accelerates throughout the assembly process. This acceleration can be understood as a statistical/kinetic consequence of the two-dimensional assembly pathway. No matter their height, all oligomers of a given width grow taller with the same characteristic rate because they present the same number of ‘landing sites’ for initiating a new longitudinal layer. However, taller oligomers grow wider faster than shorter oligomers, because increased height provides more ‘landing sites’ for initiating a new lateral layer. Similarly the wider oligomers add longitudinal layers faster than the narrower ones. Thus, the two-dimensional nature of the assembly pathway provides a simple explanation for why the assembly process accelerates as it progresses.

A Summed concentration for all oligomers of a given width, plotted as a function of time. Oligomers with width=2 dominate. Wider oligomers become progressively rarer, and peak at increasingly late times. The vertically striped light grey curve behind the others shows the extent of total assembly (right y-axis).
B Distribution of oligomer heights as a function of their width. The most populated height is plotted as a filled circle for each width (different colors), at the time that width peaks. Other height oligomers at a given width are plotted as open circles, with the radius reflecting their concentration relative to the peak species. The time to transition from one width to the next decreases as oligomers get wider and taller, and the spread of oligomer heights increases as oligomers get wider.
To provide more granular insight into the nature of the predominant microtubule assembly intermediates, we examined the distribution of oligomer sizes (Fig. 6B). For each oligomer width, at the time the concentration of oligomers of that width peaked, we plotted the most populated height (filled circle) and the relative amount of taller or shorter oligomers (grey teardrop/oval shapes, which are actually a set of circles with area scaled proportionally to the concentration). The many parallel pathways in the assembly process leads to an increasing spread in the range of oligomer heights as they get wider. For example, the most populated 50% of all 3-wide oligomers have heights between 7 and 11 (a height range of 5) whereas the most populated 50% of all 12-wide oligomers span heights between 50 and 64 (a height range of 15, three times larger than for 3-wides). The most populated immediate microtubule precursor (12 subunits wide) contains almost 700 tubulins: 58 subunits tall x 12 wide. This is much larger than the 12-18 subunits predicted by the Flyvbjerg nucleation-elongation model discussed above (Fig 1). Also note that at no time prior to forming a closed microtubule, does the rate of assembly equal the rate of elongation. The layer-based assembly model thus provides an ensemble-based view of the assembly pathway wherein many oligomers of varying height contribute appreciably to the formation of new microtubules.
While the concentration of 2×2 species determines the point of entry for the accretion-based assembly pathway, it is the straightening-induced reduction in the kinetics of lateral growth that most clearly causes the lag phase. And it is the kinetic consequences of this straightening penalty that are actually being approximated in the classical nucleation-elongation models. Thus, the apparent “nucleus” size (Fig. 1), is much closer to the number of tubulins in polymers of width = 3 (~27, see Fig. 6), than with the number of tubulins in the 12-wide immediate microtubule precursor species (~700, see Fig. 6). However, it should be clear from the pronounced height variability (Fig 6B) that this is a statistical average and does not represent a discrete nucleus.
Discussion
Many discussions of spontaneous microtubule formation have invoked the concept of a ‘critical nucleus’, which is analogous to the transition-state of a chemical reaction (Kollman et al., 2011). This traditional view of the assembly pathway assumes that (i) the formation and growth of early intermediates is thermodynamically unfavorable, and (ii) above a critical size, oligomer growth by monomer addition becomes favorable and this elongation proceeds at a fixed rate. The polymerization kinetics of relatively simple helical polymers like actin can be well-described by two-step, nucleation-elongation models that invoke a small critical nucleus representing a ‘mini-filament’ (the smallest oligomeric species that presents helical binding sites) (Tobacman and Korn, 1983; Sept and McCammon, 2001). In contrast to simpler filaments like actin, the spontaneous assembly kinetics of hollow, cylindrical microtubules do not conform to the simplest two-step, nucleation-elongation view (Kuchnir Fygenson et al., 1995; Voter and Erickson, 1984; Flyvbjerg et al., 1996). Indeed, the size of the smallest physically realistic oligomer that presents pseudo-helical binding sites (~26 tubulins) is ~2-fold larger than the size of the critical nucleus predicted from kinetic analyses (~12-15 tubulins), and moreover both the time-dependence of assembly and the concentration-dependence of the characteristic time (T0.1) are greater than would be expected for the two kinetic steps of the most basic nucleation-elongation mechanism. Even more complex, multi-step nucleation-elongation mechanisms (Flyvbjerg et al., 1996) fail to provide useful insights into the assembly pathway.
Our model provides an alternative conceptual framework for thinking about the biochemical pathway for microtubule formation, and the factors that limit the overall rate of assembly. Indeed, because there is no singular, transition-statelike species that dictates the assembly kinetics, we suggest that the term “nucleation” is potentially misleading when considering microtubule assembly and should be avoided. In what follows, we summarize the main features of the predicted assembly pathway, and discuss implications for the multiple ways that a template or other regulatory factor could accelerate the process.
The layer growth model predicts that a multitude of pathways contribute meaningfully to microtubule assembly. Stronger longitudinal interactions cause these intermediates to be taller than they are wide. Early in the assembly pathway, transitions to larger oligomers become energetically favorable but nevertheless occur slowly because adding a new layer depends on a weak and unfavorable initiating longitudinal or lateral interaction. The rate of transition between oligomers accelerates with increasing size, not because of any intrinsic changes in affinity, but because larger oligomers present more sites on which to stochastically initiate the next layer. These size-dependent changes in transition rates are a specific consequence of the two-dimensional nature of the assembly pathway. Even though nearly all of the layer additions are energetically ‘downhill’, the repeated difficulty of initiating each new layer contributes a series of progressively smaller delays into the assembly sequence. The overall ensemble of initiation barriers thus creates a kind of ‘frustration’ that dictates the unique kinetics of spontaneous microtubule assembly.
This layer-based view of the assembly pathway provides new ways for thinking about how regulatory factors might accelerate microtubule initiation. Our modeling indicates that the kinetics of microtubule formation are dictated by the need for repeated ‘layer’ transitions that are limited by the weaker lateral affinity and by the straightening penalty (e.g. Fig. 7A). Classical “nucleators” like the γ-tubulin ring complex (γ-TuRC) (Zheng et al., 1995) contain a lateral array of 12-14 γ-tubulins that are thought to form a ‘template’ on which a microtubule can elongate (Kollman et al., 2015; Moritz et al., 1995; 2000; Kollman et al., 2011). We wondered how the potency of templating might depend on the width of the template. To investigate this question in the context of our model, we modified our simulations to include various width templating oligomers (Fig. 7B), using a constant total amount of templating ‘monomers’. Thus, in the simulations there are progressively lower and lower concentrations of the wider oligomers (e.g. half as many 4-wide oligomers as 2-wide). The intrinsic affinity of αβ-tubulins for γ▧▧▧▧▧ is unknown, so we explored a regime where γ:αβ longitudinal interactions are identical to αβ:αβ (Supplemental Fig. 4) and another where γ:αβ longitudinal interactions are weaker than for αβ:αβ (Fig. 7). With the stronger γ:αβ interaction strength, even 2-wide “templates” potently accelerated assembly. This is at odds with experimental data showing that γ-tubulin small complexes (γ-TuSCs), which only contain two γ-tubulins, are much poorer nucleators than γ-TuRCs (Oegema et al., 1999; Kollman et al., 2015). By contrast, when γ:αβ interactions were weaker, templating oligomers that were 2 subunits wide only modestly accelerated the predicted assembly kinetics (1.1-fold faster characteristic time for assembly, T0.1) (Fig. 7C,D,E). A 3-wide oligomer was much more potent (1.7-fold faster) even though in the simulations the concentration of 3-wide oligomers was less than that of the 2-wide oligomer. This strong change in potency occurs because the ‘hardest’ transition in the assembly sequence is from two-wide oligomers to 3-wide oligomers, providing an explanation for why γ-tubulin small complexes (γ-TuSCs) only weakly stimulate assembly (Oegema et al., 1999). Progressively wider templating arrays show even greater potency, emphasizing that the barriers to lateral growth contribute throughout the entire assembly pathway.

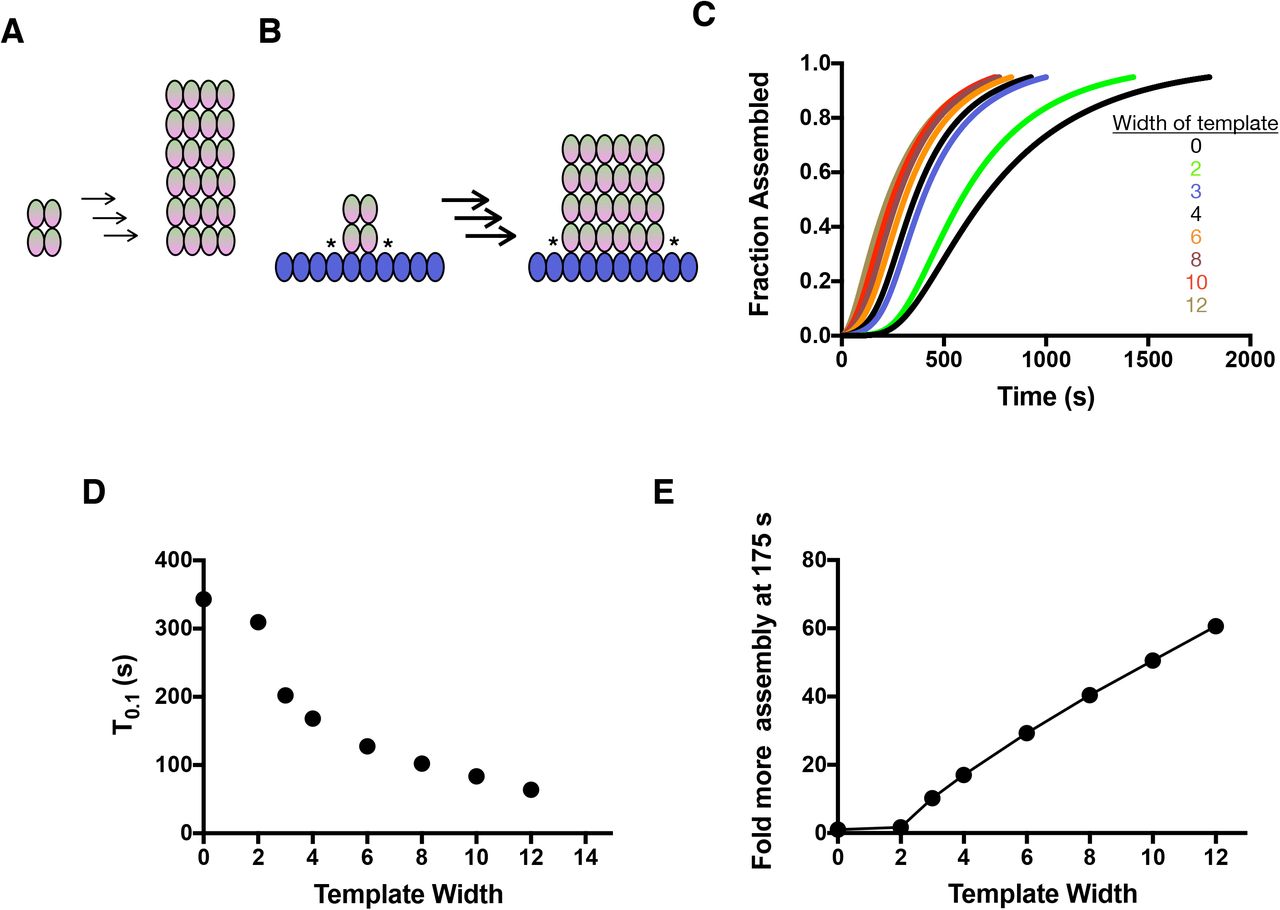
A Cartoon illustrating an intermediate stage of spontaneous nucleation. 2×2 oligomers of αβ-tubulin (left) assemble as described into rectangular intermediates that tend to be taller than they are wide (middle) because of the barriers to lateral growth. Arrows indicate multiple layer additions, each one associated with a delay.
B When αβ-tubulin adds to a γ-TuRC-like template, cartooned here as a row of blue ovals, the barrier to lateral growth is eliminated because ‘corner’ sites form at the border of the αβ-tubulin oligomer. This accelerates the accretion process (bolder arrows indicating faster transitions) and the resulting oligomers now tend to be wider than they are tall
C Simulated nucleation curves in the presence of γ-tubulin templates of different width assuming γ:αβ interactions are weaker than αβ:αβ interactions. The total concentration of templating monomers is held constant. Templates that are only two subunits wide (bright green) show a modest effect, but wider oligomers are increasingly potent.
D Quantification of the data from C. Wider templates are more potent than narrower ones. Templating the earliest step in nucleation (from 2-wide to 3-wide) yields the most dramatic decrease in T0.1.
E Relative extent of assembly at an early time (here, 175 s) plotted as a function of template width and using data from C. Relative assembly at a given time represents the fraction assembled for a given template divided by the fraction assembled in the untemplated control. The changes in nucleation kinetics can result in large changes in the overall degree of microtubule assembly at early times.
The idea that multiple reactions/transitions contribute to limit the overall rate of microtubule formation also suggests that strategies besides templating could enhance the rate of spontaneous assembly. The rates for layer additions depend on how fast tubulins ‘land’ on the growing sheet, so enhancing this rate should promote layer initiation and ‘zippering’. For example, XMAP215 family polymerases use an ‘accelerated delivery’ mechanism (Ayaz et al., 2014; Geyer et al., 2018) to make microtubules grow faster, and this same activity likely underlies the role for XMAP215 family proteins in microtubule nucleation (Roostalu et al., 2015; Wieczorek et al., 2015; Flor-Parra et al., 2018; Thawani et al., 2018; Gunzelmann et al., 2018; Popov et al., 2002). The efficiency of initiating new layers is primarily limited by the relatively weak longitudinal or lateral affinities, especially for the singleton tubulin that initiates each layer. Thus, a factor that stabilizes these associations should also increase the rate at which layer transitions occur. Proteins like TPX2 and doublecortin bridge between neighboring subunits in the lattice (Fourniol et al., 2010; Zhang et al., 2017); this ‘molecular stapling’ may help explain their documented roles in microtubule “nucleation” (Roostalu et al., 2015; Moores et al., 2004). Finally, altering the allosteric properties of αβ-tubulin itself should also profoundly effect microtubule initiation. For example, and in keeping with predictions of our model, studies of an αβ-tubulin ‘conformation cycle’ mutation (Geyer et al., 2015) that enhances the strength of lateral interactions (Driver et al., 2017)(perhaps via reducing the cost of αβ-tubulin straightening), greatly accelerates microtubule formation. Similarly, small molecule compounds like taxol that stimulate microtubule initiation and growth may do so by promoting straightening.
Conclusions and perspective
We described a relatively simple accretion model that explains spontaneous microtubule assembly kinetics in terms of subunit biochemistry and a sequence of ‘closed’ intermediates. Whereas in typical ‘nucleation-elongation’ paradigms the scarcity of the transition-state-like nucleus is what limits the rate of polymer formation, our model is more akin to a process like crystal growth. Indeed, in our accretion model most of the steps toward polymer formation are energetically favorable but kinetically frustrated by the difficulty of initiating a new layer; this difficulty decreases as layers become larger because more landing opportunities are presented. The accretion mechanism we describe is a direct consequence of the two-dimensional nature of the hollow, cylindrical microtubule lattice.
We did not consider the kinetic consequences of GTP hydrolysis within the nascent polymer in our model, because it was not possible to account for the stochastic hydrolysis within the context of our deterministic formalism. In keeping with that, our assay conditions were chosen to suppress microtubule catastrophe. While GTPase activity should frustrate assembly by preferentially destabilizing the smallest and least stable oligomers, we still expect that growth through accretion as outlined here will represent the dominant pathway for assembly.
Finally, our model provides a unifying quantitative framework for understanding the complex effects of regulatory molecules. Indeed, the ‘zippering’ transitions between closed oligomers that dominate the initiation process also share many features in common with microtubule elongation. Thus, our model also explains why factors that regulate microtubule elongation and shrinking also regulate spontaneous microtubule assembly.
Author contributions
MM collected the microtubule assembly data and helped write the manuscript. LMR constructed models, fit the data, and drafted the manuscript. DAA analyzed data, supervised the research, and helped write the manuscript.
Methods
Measurements of spontaneous assembly
The spontaneous assembly of phosphocellulose-purified porcine-brain tubulin was followed by turbidity at 350 nm basically as described previously (Voter and Erickson, 1984; Gaskin et al., 1974) Care was taken to remove microtubule seeds and inactive protein by cycling it through an additional polymerization/depolymerization step just before use: immediately prior to performing assays, tubulin at −80°C was rapidly thawed at 37°, placed on an ice-water slurry (0°C), and the buffer was adjusted to 80 mM K-PIPES, pH 6.8, 1mM EGTA, 4 mM MgCl2 and 1 mM GTP. After 5 min incubation, 0.5 volume of 37°C glycerol was mixed in and the tubulin was allowed to polymerize at 37°C for 20 min. Microtubules were pelleted through a 37°C, 60% glycerol cushion in 50 mM K-MES, pH 6.6, 5 mM MgSO4, 1 mM EGTA, 1 mM GTP in a TLA110 rotor (Beckman, Palo Alto, CA) at 80,000 rpm, 20 min. The pellets were resuspended at 37°C in assembly buffer (AB: 50 mM K-MES, pH6.6, 3.4 M glycerol, 5 mM MgSO4, 1 mM EGTA, 1 mM GTP) using a warm Potter homogenizer. The resuspended microtubules were then depolymerized on an ice-water slurry for 20 min and centrifuged in a TLA100.3 rotor at 100,000 rpm for 35 min at 2°C to remove any remaining polymerized tubulin. The supernatant from this cold spin was removed and used for the assembly reactions. The tubulin was kept at 0°C as reaction mixtures were prepared. A series of samples was prepared at different tubulin concentrations in AB and kept at 0°C in thin-walled, 0.5 ml plastic tubes (PCR tubes, Stratagene, Cedar Creek, TX). Samples were rapidly heated to 37°C directly in cuvettes pre-warmed to 37°C in a Pelltier cell changer (took 30 sec), in a custom built spectrophotometer. The A350 nm was recorded approximately every 4 sec on 4 samples at a time until plateaus were reached. Recording on the spectrometer was started prior to transfer of tubulin to the cuvettes so that early lag-phase data were not missed. The time was adjusted to ignore the 30 sec heating step. Scaling analysis was performed using a customized program.
Explicit simulations in Berkeley Madonna
We constructed a model in Berkeley Madonna (Macey et al., 2009) to simulate αβ-tubulin self-assembly. The first step in this process was to define the set of αβ-tubulin oligomers and how they are related to each other by gain/loss of an αβ-tubulin though a longitudinal, lateral, or longitudinal+lateral (‘corner’) interaction. Starting from the two-dimensional nature of the microtubule lattice, we built a list of all possible configurations for an αβ-tubulin oligomer of a given size. Fig. 2 illustrates how there are two kinds of possible dimers of αβ-tubulin (longitudinal and lateral), three kinds of trimers of αβ-tubulin, etc. Larger oligomers can have multiple configurations that are energetically equivalent. To minimize the number of species and reactions considered in the model, we used a single exemplar species to represent each set of n-mers with the same number of longitudinal and lateral contacts. For each exemplar species, population-weighted average rate constants were used to account for the different properties of each oligomer. Supplemental Figure 1 provides a worked example of this approximation for a tetramer of αβ-tubulin. We then used the ‘Chemical Reactions’ module in Berkeley Madonna (Macey et al., 2009) to build a set of rate equations corresponding to each possible transition. We did not pursue oligomers larger than 12-mers because the number of species and reactions became intractable. This model provides a way to analyze the rate and extent to which different species become populated for a given choice of the adjustable parameters.
Derivation of layer transition rates and validation in Berkeley Madonna
The explicit, monomer-based simulations in Berkeley Madonna (Macey et al., 2009) indicated that a simpler reaction scheme that only considered transitions between ‘closed’ (rectangular) oligomers. We used the steady state approximation to derive effective rate constants for these transitions, as described below.
We will illustrate the derivation of layer-based transition rate constants using a specific example. Consider the layer-based reaction associated with adding a longitudinal layer onto an oligomer that is, say, n tubulins tall and 4 tubulins wide (in other words, the net reaction is (n,4) <--> (n+1,4). To simplify the notation, we will call the starting species 4 and the final species 4’; the intermediates with one, two, and three tubulins on the layer will be called 4a, 4b, and 4c respectively. The individual reactions are:


The associated rate equations for these reactions, which account for the production and loss of intermediate species, are:


Starting from the last intermediate 4c, we apply the steady-state approximation to the intermediate species to obtain an expression for the net rate of producing 4’ from 4. Assuming that the concentration of 4c does not change with time, its time derivative is zero, so:


This yields an expression for the concentration of intermediate 4c in terms of its predecessor 4b. The multiplicative factor W3 is given by the pseudo-first-order rate constant for forming 4c divided by the sum of the pseudo-first-order rate constants for losing 4c (in the forward or reverse direction).
This process can be applied again to obtain an expression for the concentration of intermediate 4b in terms of its predecessor 4a:


Where in (16) we eliminated [4c] by substituting W3[4b], and in (17) we simply grouped terms in [4a] and [4b]. The weighting term W2 is again given by a similar ratio as for W3, but with an additional term that includes W3.
Applying the same procedure, we can obtain an expression for the concentration of the first intermediate 4a in terms of its predecessor, the closed rectangular species 4:


Finally, since the rate of finishing the layer is given by:


Where in (23) we used (13) to eliminate [4c] for a term involving [4b], (18) to eliminate [4b] for a term involving [4a], and (21) to eliminate [4a] for a term involving [4]. This yields an apparent rate constant for adding a layer, the terms of which only involve the fundamental rate constants and multiplicative factors that account for the number of ways a particular reaction can happen. In the case presented there are three such terms because the layer contains 4 tubulins. Because krCorner is small compared to kf[αβ], is can be neglected in the denominator and so all weights excepting the first one will be numbers between 1 and 2. W1 contains krLong in the denomimator, which in general is large compared to kf[αβ], so W1 tends to be a small number that reflects the difficulty of initiating a new layer. The general procedure is formulaic and can be applied to any size layer.
The effective equilibrium dissociation constant for the layer addition is given by

Finally, we compute an effective rate constant for layer loss by multiplying the equilibrium dissociation constant and the forward rate constant:


To determine if this reduced representation could accurately recapitulate the timecourses for rectangular species in the explicit model, we constructed a new model in Berkeley Madonna (Macey et al., 2009) (also truncated at 12-mers) that considered monomer-based reactions to form the first rectangular intermediate, a 2×2 tetramer of αβ-tubulin, but that only considered layer transitions for larger species. We input expressions for the layer transition rates as derived above, and ran the simulations using the same biochemical parameters used in the explicit simulations. The layer model faithfully reproduced the results from the explicit simulations (Fig. 2).
Derivation of the equilibrium constant for lateral association of a preformed longitudinal dimer
To implement the dimer pathway (Fig. 3 and Sup. Fig. 3), we assume that the on-rate constant for adding a dimer is the same as for adding a monomer. Given the on-rate constant, we obtain the off-rate constant (for the initiating dimer to dissociate) using the equilibrium constant for the dimer binding. We show here that this new equilibrium constant can be calculated purely in terms of ‘monomer’ properties. First, we write the dissociation constants in terms of free energies of association, as follows:
 where we have separated out the entropic cost of subunit immobilization (loss of rotational and translational degrees of freedom) as ΔS as has been done previously (e.g. (Erickson and Pantaloni, 1981; VanBuren et al., 2002)). The reason for doing this separation is that lateral association of a pre-formed longitudinal dimer should have the same entropic ‘cost’ as for association of a monomer (because the cost of losing rotational and translational degrees of freedom is already built in to the longitudinal affinity). The Kd values are the fitted parameters in the model.
What we wish to calculate is the dissociation constant for two simultaneous lateral contacts:

We prove here that:

Layer-based simulations of microtubule self-assembly
To enable simulations of arbitrarily large oligomers, we wrote a custom computer program to implement and automate the construction of the list of possible oligomers and the recursive calculation of rate constants for transitions between them, and to integrate the rate laws using finite-difference methods. To simulate spontaneous microtubule assembly, we converted species that reached 13-protofilaments wide into microtubules, and we assumed that microtubules elongated by monomer addition into a ‘corner’ site. We did not explicitly consider the seam, and for simplicity we assumed plus- and minus-ends elongated with identical kinetics. We used a downhill simplex algorithm to fit the simulated timecourses to the experimental ones.
Simulating the effects of template-like nucleators
To investigate the effects of template-like nucleators in the model, we modified the simulations to include an additional template species. We assumed a constant total concentration of ‘monomers’ that were distributed into templating oligomers of different widths. This assumption means that progressively wider oligomers are present in the simulations at progressively lower concentrations; for example, for a given concentration of templating monomers, there will be half as many 4-wide oligomers as 2-wide, and so on. For calculating the rate constants for the first layer addition onto the template, we assumed that only one longitudinal interface of this templating oligomer (the plus end) was active for nucleation.
In initial runs wherein interactions between γ- and αβ-tubulin were assumed to be of identical affinity, we observed potent nucleation even from templates that were only two subunits wide (Supplemental Fig. 4). Because two-wide nucleators like the γ-TuSC are much less potent than 12-14-wide oligomers like the γ-TuRC (Oegema et al., 1999; Kollman et al., 2015), we also performed simulations with 10-fold weaker interactions between γ- and αβ-tubulin than for αβ:αβ interactions (Fig. 7)
Acknowledgements
This study was supported by grants from the National Science Foundation to LMR (MCB-1615938 and MCB-1054947) and from the National Institutes of Health to DAA (R01 GM031627, R35 GM118099 and P01 GM105537). DAA is an Investigator with the Howard Hughes Medical Institute.
References


