

Abstract
The human body is made up of hundreds, perhaps thousands of cell types and states, most of which are currently inaccessible genetically. Genetic accessibility carries significant diagnostic and therapeutic potential by allowing the selective delivery of genetic messages or cures to cells. Research in model organisms has shown that single regulatory element (RE) activities are seldom cell type specific, limiting their usage in genetic systems designed to restrict gene expression posteriorly to their delivery to cells. Intersectional genetic approaches can increase the number of genetically accessible cells. A typical intersectional method acts like an AND logic gate by converting the input of two or more active REs into a single synthetic output, which becomes unique for that cell. Here, we systematically assessed the intersectional genetics landscape of human using a curated subset of cells from a large RE usage atlas obtained by Cap Analysis of Gene Expression Sequencing (CAGE-Seq) of thousands of primary and cancer cells (the FANTOM5 consortium atlas). We developed the heuristics and algorithms to retrieve and quality rank AND gate intersections intra- and interindividually. We find that >90% of the 154 primary cell types surveyed can be distinguished from each other with as little as 3 to 4 active REs, with quantifiable safety and robustness. We call these minimal intersections of active REs with cell-type diagnostic potential “Versatile Entry Codes” (VEnCodes). We show that VEnCodes could be found for 100% of the 158 cancer cell types surveyed, and that most of these are highly robust to intra- and interindividual variation. Our tools for generating and quality-ranking VEnCodes can be adapted to other RE usage databases and to other intersectional methods using alternative Boolean logic operations. Our work demonstrates the potential of intersectional approaches for future gene delivery technologies in human.
INTRODUCTION
The exact number of different cell types that make up the body of a human adult is yet to be defined, but is expected to be in the order of several hundred, perhaps thousands of different cell types (Valentine et al., 1994; Carrol, 2001). Major efforts have recently been launched to attempt to catalogue and molecularly describe every cell type in different tissues of the human body (Andersson et al., 2014; FANTOM Consortium and the RIKEN PMI and CLST (DGT), 2014; Macosko et al., 2015; Bahar Halpern et al., 2017; Regev et al., 2017; Hon et al., 2018). The number and the complexity of cell types increases further when one considers that cells exist in different states, not only when a cell divides or undergoes successive differentiation steps during normal developmental processes, but also when a cell becomes infected, cancerous or specifically responds to physical or chemical stimuli (Valentine et al., 1994; Carrol, 2001; Macosko et al., 2015).
A major challenge in biology and biomedicine has been to genetically identify and deliver genetically encoded messages to a specific cellular type and/or state within complex organisms. Most gene delivery systems are limited by the technology available to distinguish the desired cellular types and/or states between themselves prior to gene delivery; most technologies relying primarily on cell-surface markers for selectivity (Lukashev and Zamyatnin, 2016; Hardee et al., 2017). These markers are seldom cell-specific, and this lack of specificity inevitably leads to DNA delivery to unwanted cells. This can have negative consequences, such as introducing undesired artefacts in research studies or side-effects in gene-therapy-based interventions. Additionally, the usage of sporadically defined cell surface markers for cellular targeting restricts both the ability to systematize the generation of cell-specific gene delivery vectors and to scale this system up for any cell type or state in any organism.
An alternative to these “pre-DNA delivery” selectivity procedures is to use cell-type- and cell-state-unspecific viral or non-viral DNA delivery systems (Duan, 2016; Wong et al., 2016), and work out the cell specificity post-delivery by exploring unique genetic properties of the target cell. The transcriptional program of any given cell reflects, at the most basic level, a unique combination of binary on/off states of the regulatory elements (REs) present in the genome. REs can be used multiple times by different cells either at different anatomical sites, time points of life history or during disease or environmental responses (Mallo, 2006; Luan et al., 2006; ENCODE Project Consortium, 2012; Mortazavi et al., 2013; Kron et al., 2014; Andersson et al., 2014; FANTOM Consortium and the RIKEN PMI and CLST (DGT), 2014). Therefore, while the activity of a single carefully-chosen RE could theoretically provide sufficient specificity to identify a particular cell type and/or state post-DNA delivery in some cases, it is unlikely to provide the required specificity to distinguish most cell types and/or states between themselves (Mallo, 2006; Luan et al., 2006).
Aware of this fact, developmental biologists studying model organisms have devised intersectional genetic methods to increase target cell specificity of gene drivers by exploring the anatomical overlap between expression patterns driven by two independent REs (Lakso et al., 1992; Struhl and Basler, 1994; Awatramani et al., 2003; Suster et al., 2004; Stockinger et al., 2005; Luan et al., 2006; Farago et al., 2006). Similarly, molecular and synthetic biologists have engineered systems that use Boolean logic to sense different cell states in bacteria and yeast (Siuti et al., 2013, Nissim et al., 2007). In many of these synthetic computational systems, the REs are the inputs which will pass through a typical AND gate and give a single genetically-defined output (Figure 1). Similar systems have been applied to mammalian cells, where they are able to distinguish between different cancer cell types or detect cancer cells arising from normal cells in vitro (Nissim and Bar Ziv, 2010; Liu et al., 2014; Morel et al., 2016). Despite being successful, the full potential of this type of intersectional approach has never been evaluated or applied systematically to generate drivers for every cell type in a body, even less so to a complex organism like human, which lacks thoroughly developmentally-characterized gene drivers.

Scheme of the intersectional genetics approach to obtain cell-type specific drivers by restricting expression to the cells where two or more REs with broader activity overlap (intersect). REs are the inputs that will pass through a typical AND logic gate and give a single genetically-defined output in the cells where the RE activities intersect.
Here, we hypothesized that the majority of cell types and/or cell states in human could be distinguished post-DNA delivery using multiple input AND gates (intersectional methods of active REs, Figure 1). We further asked if the usage of a two-input AND gate would be sufficient to retrieve most human cell types and/or states and if not, which would be the ideal number of active REs required. We then developed an algorithm to quality rank intersections as regards their robustness. This is relevant in situations where more than one possible multiple input AND gate exists for a given cell type and/or cell state. Finally, we asked whether or not cancer cells could readily be distinguished from primary cells with this approach.
RESULTS
Data preparation / normalization
To quantify how cellular specificity scales with the number of intersecting active REs (k), we developed algorithms and scripts using Python language to analyze genome-wide data on promoter and enhancer usage for hundreds of primary human cell types obtained by the FANTOM5 consortium (Andersson et al., 2014; FANTOM Consortium and the RIKEN PMI and CLST (DGT), 2014; Lizio et al., 2015). Briefly, the FANTOM5 data consists of curated subsets of transcriptional start site “peaks” determined by capped analyses of gene expression (CAGE)-sequencing (CAGE-seq). The height of each CAGE-seq peak provides quantitative information in normalized tags per million (TPM) values, which is interpreted as being directly proportional to the activity of the promoter or enhancer which it represents.
Before analyzing the FANTOM5 data, we manually curated the FANTOM5 human cell type database consisting of 184 distinct cell types from multiple donors (giving a total of 562 datasets), by selecting for healthy primary cells and removing cell treatments/infections and cells obtained from cancer samples (Figure S1). We also attempted to remove datasets that were less likely to represent single cell types. Examples of the samples removed during curation are: datasets from cells infected with Salmonella or Candida albicans, datasets for cells labeled “whole blood”, and datasets from mesenchymal precursor cells obtained from cancer samples. Some datasets were merged into a single cell type category, for example: “CD8+ T Cells (pluriselect)” and “CD8+ T Cells”, or “Melanocyte dark” and “Melanocyte light” were treated as single cell type categories, respectively. This curation resulted in a list of 154 distinct primary cell types from multiple donors, giving a total of 537 samples and averaging ~3.5 samples (donors) per cell type (range 2-6). Table S1 contains the list of curated cell types used in this study as well as all of the excluded and merged categories.
The total number of possible RE combinations for a target cell type is C(r, k) = (r!/(k!(r − k)!), where r stands for the number of REs of the database (e.g., 201 802 promoters in FANTOM5), and k for the number of REs chosen to combine. For k = 4, this gives 6.9 x 10¹⁹ possible combinations. To ask if any combination is specific for the target cell type, however, we need to ask if the k combined elements are all active in the given cell type AND at least one of the k elements is inactive in each of the other cell types in the database. If the k elements could be binarized into active (TRUE) an inactive (FALSE) categories, this question can be asked using boolean logic gate functions such as: (1k1 AND 1k2 AND … 1kn) AND ((2k1 AND 2k2 AND …. 2kn) NOR (3k1 AND 3k2 … AND 3kn)… NOR (nk1 AND nk2… AND nkn)), where  represents the status of the RE element k in cell type c (where the target cell type is 1). The truth table for this function has 2(c*k) rows, which for 154 cell types and k = 4 gives 2.7 x 10185 rows. Clearly, saturating the search for all possible combinations for any given cell type and testing them by brute-force is a daunting computational task.
The complexity of the database for a given cell type can nevertheless be reduced for each search using heuristic methods. For instance, REs that are inactive in the target cell or active in the target cell and also active in most other non-target tissues (e.g., REs of housekeeping genes) are not helpful for the purpose of making cell-type-specific genetic intersections drivers.
Hence, to increase the likelihood of finding fruitful intersections and to reduce database complexity and computing time, we applied several filters on the database to select for sparsely-active REs. The first step is to define RE activity thresholds. We decided to be conservative and apply different activity thresholds for the target cell type and for the non-target cell types, to increase the chances that the selected REs are truly active in the target cell type and inactive in the non-target cell type. To reduce database size and concentrate on potentially active REs in the target cell type, we created subsets of data for each target cell type where we retained only the REs that were consistently potentially ON (>0 TPM) in all donors for that cell type (Figure 2A). We next collapsed the data from multiple donors of the non-target cell types to a single non-target cell-type datapoint by averaging the expression of the multiple donors (Figure2B). This reduces the database complexity by a factor of ~3.5.

Different conservative criteria for RE activity were applied to target (A) and non-target cells (“Other cell types”) (B). Each row represents a possible RE activity scenario. Each box represents the activity of the RE per donor (D) or the collapsed intersection or average (M), according to the color key. REs from target cells were considered active if the intersection of all cell donors were above a TPM threshold (blue squares). REs from other cell types were considered active if the average raw TPM (M) of all donors was above the threshold.
To select for sparsely-active REs, we studied the RE activity landscape by testing the following thresholds for RE activity in the target cell type: 0.5, 1 and 2 TPM. The higher the RE activity threshold, the more stringent the RE selection is. For inactivity, we tested 0, 0.01, and 0.1 TPM in non-target cells. By applying these thresholds, we transform the continuous CAGE-seq peak data into binary datasets.
We then wrote a program that randomly samples the filtered RE landscape by choosing a combination of k “active” REs for a target cell type and asking whether this combination is exclusive to the target cell type compared to the other cell types of the database. We call this the “Sampling Method” (Figure 3A).
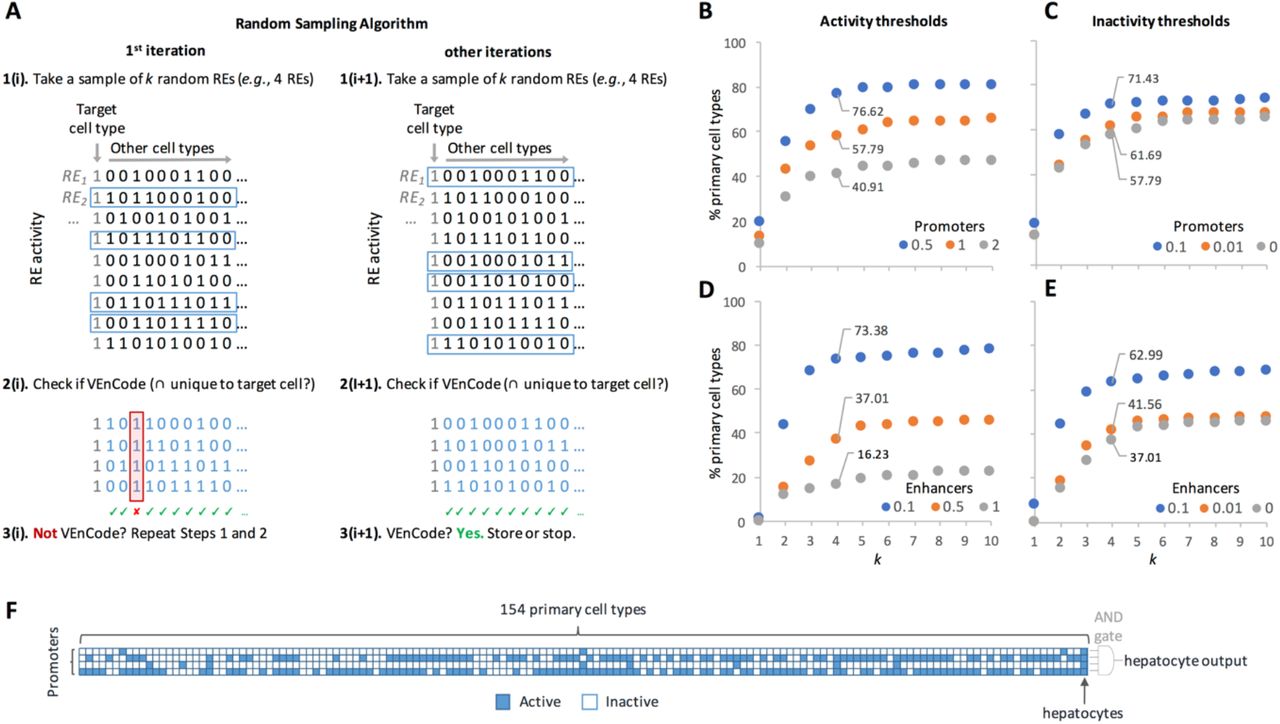
A. Rationale for the sampling method. First, k REs are randomly selected from the set of REs that are active (“1”) in the target cell type. Inactive REs are depicted as “0”. Then, we ask if at least one sampled RE is inactive in each other cell type in the data set. If yes, these k REs satisfy VEnCode criteria or the target cell type (e.g., the k REs must intersect exclusively in the target cell). If not, we repeat steps 1 and 2. If in the first or second iteration (i+1), the k REs satisfy VEnCode criteria, then the k RE selection is counted as a VEnCode and is stored. B-E. Probing the intersection genetics landscape for promoter (B, C) and enhancer (D, E) datasets using the sampling method. Plotted are the percentages of cell types found to have at least one VEnCode per k and different activity (B,D) and inactivity (C,E) TPM thresholds. For the activity panels, the inactivity threshold was fixed at 0 for both promoters and enhancers. For the inactivity panels, the activity thresholds were fixed at 0.5 and 0.1 for promoters and enhancers, respectively. F. Visual representation of a VEnCode for hepatocytes. Binary heatmap where each column represents one of the 154 primary human cell types and each row one RE from the promoter data set. Blue (active RE), white (inactive RE).
To further reduce computing time, the algorithm first selects for sparsely-active REs by removing all REs that are active in more than X% of the cell types. This removes broadly expressed REs. We start with X = 90%, but decrement 5 units (i.e., 85%) each time there are not enough REs left in the dataset after the filter (e.g., n of REs < k). We ran this sampling program up to n = 1000 times for a k range of 1 to 10, and calculated the percentage of cells for which at least one exclusive combination for the target cell type was found. This percentage served as an indicative of the cellular specificity of combinations of k active REs.
Random sampling of intersecting active REs
Using promoter data from the subpanel of 154 primary human cell types, we find that cellular specificity of k intersecting REs increases logarithmically from 10-20% for k = 1 up to a plateau of 40-80% starting at k = 5, depending on the activity threshold (0.5-2 TPM, with a fixed inactivity threshold at 0 TPM; Figure 3B). The 0.5 TPM activity threshold gave the highest selectivity. Relaxing the inactivity thresholds from 0 to 0.1 TPM (with a fixed activity threshold at 1 TPM) increased the % of cells that could be detected by 10-15% depending on the k used, again reaching a plateau at around k = 5 (Figure 3C). A similar scenario was observed using enhancer data, albeit the activity threshold that gave the highest selectivity was lower (0.1 TPM) than for promoters, likely reflecting the generally lower TPM values of the enhancer subset (Figure 3D). Relaxing the inactivity thresholds up to 0.1 (with a fixed activity threshold of 0.5 TPM) did not improve the cell selectivity (Figure 3E). These results suggest that combinations of just a handful of active REs could provide substantial cellular resolution in human. Moreover, as predicted, these results show that the usage of a single input (k = 1) has a very limited potential to detect cell types or cell states. The results also clearly show that, even though a two-input AND gate greatly increases the number of detectable cell types, it is unlikely to provide the breadth required to be applicable for a technique aimed at detecting most cell types and/or states in the human body. Finally, at least for this dataset and methodology used, our results suggest that our ability to sort cell types based on active RE intersections plateaus between 4-6 REs.
Safety is also a concern when considering possible human applications of RE activity-based methods, such as unwanted leakage (noisy or unpredicted RE activity) in cell-targeted therapies. Using high k values would be beneficial in this sense, because, for each extra k, there is an extra safety layer to account for false negatives when compared to k = 1. Namely, the probability p of leakage decreases exponentially by pk. By applying the simple RE selection criteria described above (with activity thresholds of 0.5 and 0.1 TPM for promoters and enhancers and a strict inactivity threshold of 0 TPM for both), the usage of a four-input AND gate (k = 4 combination of promoters and/or enhancers), which can theoretically add as many as three safety layers against false negatives when compared to k = 1, is able to discern ~77% and ~76% of human cell types, respectively (Figure 3B and 3D), suggesting that it is a good compromise between technical feasibility (i.e., generating biological systems that use four REs and translate the activity of the gene products regulated by these REs into a single genetic readout) and breadth of cell types that can be detected. These multiple-input AND gates can also be seen as the minimal combination of co-activated REs that is diagnostic of a given cell type or state within a given complex mixture of cells in a culture dish, in a tissue biopsy sample, or in the human body. We call these RE combinations, Versatile Entry Codes (VEnCodes) (Figure 3F).
Heuristic selection of intersecting active REs (VEnCodes)
The random “sampling” method still falls short of probing the enormous landscape of possible VEnCodes. We thus attempted a heuristic approach to probe the VEnCode landscape. We used the same binarization criteria as in the sampling method but removed the filter for sparsely-active REs that retains REs that were active in a percentage of the cell types assayed. This was done since the effectiveness of this approach is not affected by a large dataset of less sparsely-active REs. REs occupy the rows of the database and can be represented as  , where “a” represents the position of the RE in the VEnCode (e.g., for a VEnCode with k intersections, a will go from 1 to k) and b represents the row number in the RE list. We then applied a greedy algorithm that considers the sparseness of expression (Figure 4A). In brief, the REs are first sorted by expression sparseness and the sparsest RE (RE1) is chosen as a first-order position (hereafter, “node”) 1RE1. All cell type columns in which 1RE1 activity is 0 are then culled from the database, and all remaining >1RE>1 are resorted in ascending fashion according to the number of cell types they share co-activity with 1RE1. Then, 1RE1 is tested in combination with the next RE (2RE2) to verify if it satisfies criteria as a VEnCode (i.e., if the intersection between the active REs 1RE1 ∩ 2RE2 occurs exclusively in the target cell samples). It follows that for each k = 2 combination that satisfies VEnCode criteria, all further k > 2 combinations that use these two REs will satisfy the criteria for VEnCode. If no k = 2 combination satisfies VEnCode criteria, the algorithm creates secondary nodes and reiterates the pattern described above. To increase the coverage of the landscape, each multiple node test is performed with the three nearest neighbors by order of sparseness. If no k = 3 combination satisfies VEnCode criteria, the algorithm creates tertiary nodes and so on. We call this approach the “heuristic approach”.

A. Rationale for the heuristic method. An example is given for a VEnCode with k = 3. This algorithm follows a greedy strategy where at each node of the decision tree it makes the locally optimal choice. First, it sorts the REs in the dataset by sparseness, then it takes the sparsest RE (first-level node) and asks if it is inactive in all non-target cell types. If yes, this RE is cell-type specific, and the next k−1 sparsest REs can be added to increase safety. If not, it finds out in which cell types this RE is active and searches the data set for a new RE that is inactive in those problematic cell types. If this is successful, then the intersection between these two REs will be specific for the target cell type. In case there is no RE that matches the query, it re-orders the REs by sparseness, this time calculating sparseness only at the “problematic” cell types. It then chooses the sparsest RE as the second-level node and repeats the procedure as described for the first node, increasing node depth until a VEnCode is found. Node depth is always ≤k and the algorithm tests several nodes at each level before it gives up. In the example given, there was no need to reorder by sparseness as there was a satisfactory VEnCode. B-E. Probing the intersection genetics landscape for promoter (B, C) and enhancer (D, E) datasets using the heuristic method. Plotted are the percentages of cell types found to have at least one VEnCode per k and different activity (B,D) and inactivity (C,E) TPM thresholds. For the activity panels, the inactivity threshold was fixed at 0 for both promoters and enhancers. For the inactivity panels, the activity thresholds were fixed at 0.5 and 0.1 for promoters and enhancers, respectively.
Applying the heuristic approach to search for VEnCodes using similar threshold conditions as used for the sampling method above, we obtained cell-specific combinations of k promoters and enhancers for ~90% and ~80% of the cell types, respectively (Figure 4B-E). More importantly, this method shifts leftwards the plateau for the maximum number of cell types detected so that we are now able to retrieve specific combinations for a larger percentage of cell types even at lower k numbers. For instance, at k = 4, we retrieve ~88% and ~77% of cell types, using promoters and enhancers, respectively.
To try to find VEnCodes for the cell types where they could not be retrieved using either the sampling or the heuristic method, we combined enhancer (k1) and promoter (k2) data in a method we called “heuristic2” approach (Figure 5A). This method increases cellular resolution to ~85% of cell types for k = 2 (combinations of 2 k1 enhancers and 2 k2 promoters) and >90% of cell types for k = 4 (combinations of 4 k1 enhancers and 4 k2 promoters, Figure 5B), allowing the generation of VEnCodes for difficult cell types where they could be found using promoter or enhancer alone (Figure 5C). Even though none of our methods saturates the RE activity intersection landscape, these results already suggest that combinations of just a few active REs could provide substantial cell type resolution in human.

A. Rationale for the Heuristic2 method. This algorithm combines the efficiency of the heuristic method with the extra flexibility of using both enhancers and promoters to target a cell type. First, it finds the k sparsest enhancers (k1) that are active for the target cell type and asks if they are a VEnCode. If they are not, it focuses on the “problematic” cell types in which the enhancers are active, and, using the approach described in Figure 4, asks if there are any combination of promoters (k2) that are not active in those cell types. If so, then the intersection of the enhancer and promoter activities is specific to the target cell type. B. Probing the intersection genetics landscape using the Heristic2 method. Plotted are the percentages of cell types found to have at least one VEnCode per k using promoter (orange circles), enhancer (gray circles), or promoter + enhancer (blue circles) data. C. Visual representation of a VEnCode obtained using the Heuristic2 method for trabecular meshwork cells. Binary heatmap where each column represents one of the 154 primary human cell types and each row one RE from the enhancer (blue boxes) and promoter (orange boxes) datasets. Red boxes and arrows depict the cell type data that are preventing the interception of enhancers from being a VEnCode for the trabecular meshwork cells. Green boxes highlight the promoter expression data in those problematic cell types.
Measuring VEnCode robustness
Next, we asked whether we could devise algorithms to rank a VEnCode according to its quality and robustness. A k = 4 VEnCode assumes, based on the available RE usage data, that the four chosen REs are never active together in any cell type and/or state except in the desired target cell type and/or state. Clearly, there could be many instances when this premise is false, so that the VEnCode falls apart. For instance, the VEnCode is compromised if the VEnCode is also able to detect a cell type which is not included in the database used or if false negatives are a prevalent artifact of the databases used to devise VEnCodes (e.g., a given RE is labelled as inactive in our database, but it is, in reality, active or for any reason unstably fluctuates between active and inactive states). To attempt to quantify these problems, we carried out Monte Carlo simulations of false negative results by randomly activating REs and recalculating whether or not the VEnCode continued being selective for our target cell type after each simulation (Figure 6A). We scored how many false negatives on average (for n simulations) are required until the VEnCode falls apart. This gives the quality value Eraw for each VEnCode. Eraw varies as a function of k comprising the VEnCode and the number of cell types c in the database. The higher the k, the higher Eraw, attesting to the fact that intersections are more robust to technical errors and biological noise. To make E comparable between different conditions, we normalize Eraw according to a reference best-case-scenario Ebest(c, k) value, which was obtained by Monte Carlo simulations performed as described above, yet for the best-case-scenario for a VEnCode: where all k REs are inactive in the nontarget cell types). Hence, normalized E = 100*Eraw/Ebest(c, k) (Figure S2 and Table S2). The idea is that E is directly proportional to the intraindividual robustness of a given VEnCode towards a cell type (Figure 6B).

A. Outline of the method to calculate the E value of a VEnCode. Eraw is calculated by taking a VEnCode (1.) and accounting for possible false-negatives in the data by turning inactive REs into active ones (2.). To this end, the algorithm performs random 0-to-1 changes in the dataset, one at a time, and then checks if the VEnCode condition is still satisfied. It reiterates e1 times until the VEnCode condition is no longer satisfied. It then repeats the simulation n times (3.) and returns Eraw by calculating the average of all e values obtained (4.). Eraw is then normalized according to the formula described in Figure S2 and Table S2 to obtain E. B. Visual representation of four (1-4) hepatocyte VEnCodes obtained using different algorithms and promoter data. Binary heatmap where each column represents one of the 154 primary human cell types and each row one RE from the promoter data (blue boxes). The E value of each VEnCode is depicted on the right. C-D. The effect on E values of using sampling (blue) or heuristic (orange) methods to obtain VEnCodes. The heuristic method increases average E for most cell types for promoter (C) and enhancer (D) data. y axis represents different cell types ordered by increasing E obtained by the sampling method. Each dot is a VEnCode (n = 5-20 per primary cell type). Darker diamonds represent the mean.
To understand how E scales with cell type identity, we used the sampling method to obtain an unbiased set of VEnCodes using k = 4 promoters. From the 114/154 cell types for which we retrieved 5-20 VEnCodes in n = 10000 samplings, we obtained E values varying between 6 and 99 (Figure 6C and Figure S3A). The E quality index varied substantially between cell types. For instance, “Fibroblast - Mammary” cells only allow the generation of VEnCodes with small E values (between 5 and 17), while hepatocytes allow the generation of high-quality VEnCodes with large E values (between 62 and 91). To test whether the heuristic method improved VEnCode quality, we calculated E from a subset of 5-20 promoter VEnCodes obtained from 131/154 cell types, which comprised 113 cell types for which we obtained VEnCodes using the sampling method (Figure 6C and Figure S3B). As expected, the heuristic method statistically significantly improved VEnCode quality by an average of 21.1 units (range 657) above random sampling for 88.5% of cell types (100/113, p < 0.0005, Bonferroni-corrected unpaired T tests, Figure 6C). Similar results were obtained for enhancer VEnCodes: average improvement of 14.1 units (range 4-40) over random sampling for 83% of cell types (93/112, p < 0.00005, Bonferroni-corrected unpaired T tests, Figure 6D and Figure S3C-D). We conclude that the heuristic method not only finds VEnCodes for a larger amount of cell types, but also generates higher quality VEnCodes.
VEnCode interindividual robustness
An ideal VEnCode retains its specificity towards the target cell type across multiple individuals of a population. For this, the VEnCode must be robust to interindividual variation on cell-specific RE usage patterns. Interindividual variation could arise either due to technical variation introduced during determination of active and inactive REs for a given cell type in a given individual or as true biological variation in RE usage for that cell type between individuals. The likelihood of relying on false positive calls to generate VEnCodes should be inversely proportional to the number of individuals surveyed for RE usage in the target cell type. To verify this, we estimated interindividual robustness “z” of VEnCodes by calculating the percentage of VEnCodes generated from a subset of cell type donors that retained VEnCode satisfiability for all other donors of that cell type, whose data were not used to generate the initial VEnCodes (Figure 7A). Our results show that despite some variability between interindividual robustness across different cell types, on average, their VEnCodes (k = 4) are robust (Figure 7B). Namely, when promoter usage data from one and two donors are used, the z values increases on average by ~9.4% from 90.6 to 100%, respectively (p < 0.00001, Wilcoxon test for a subset of 66 cell types with 3 donors with 0 < n < 71 VEnCodes generated by the sampling method in all conditions; Figure 7, top left panel). Similar results were found for a subset of cell types (n = 9) with 4 donors, where 2 donors were sufficient to saturate z (Figure 7, bottom left panel). Enhancer data from a single donor seems to carry even more predictability for other donors than promoter data, as z is on average only 1.4% lower than 100% when data from one donor is used instead of 2 (p = 0.00096, Wilcoxon test for a subset of 67 cell types with 3 donors Figure 7, top right panel). When the subset of 6 cell types with enhancer data from 4 donors was analyzed, data from a single donor was sufficient to saturate z (Figure 7, bottom right panel). These results suggest that using data from more than one donor is most helpful for promoter data, where it can help significantly increase VEnCode interindividual robustness, and hence the likelihood that a VEnCode will be specific for the target cell in different individuals.
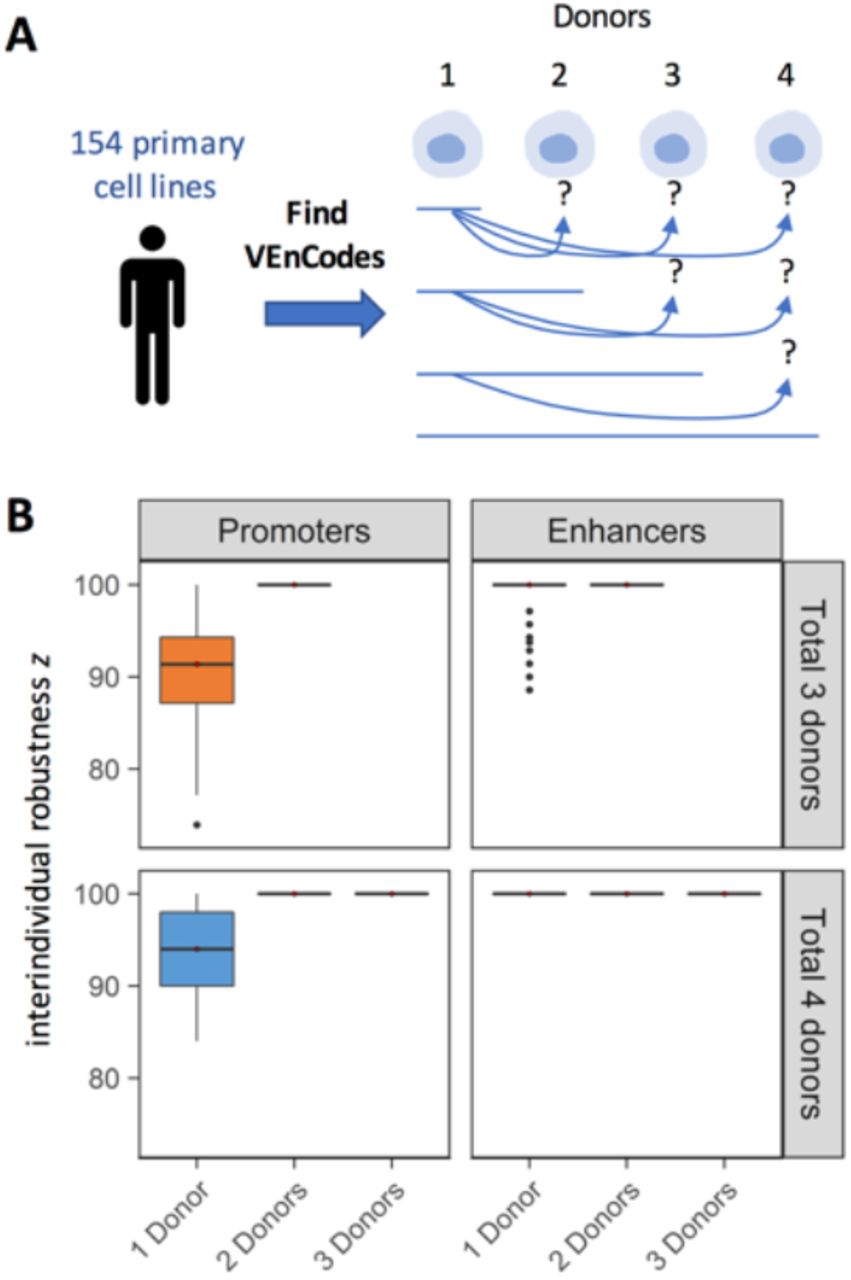
A. Rationale for the estimation of VEnCode interindividual robustness. VEnCodes that are generated based on data from one or more donors are tested as VEnCodes on data from other donors. The % of VEnCodes that satisfy VEnCode criteria for the other donors is z. B. Box plots representing z obtained from various primary cell types based on promoter and enhancer data. Subsets of primary cells for which three (top panels, orange) and four (bottom panels, blue) donors were tested. z is saturated at 100% for all cell types tested when VEnCodes are determined using data from 2 cell donors.
Even though there is no correlation between average VEnCode quality E for a cell type and the cell type’s interindividual robustness z (Figure S4), consistent with the fact that an interindividually robust VEnCode needs not be of high E quality, or that a VEnCode with a high E score is not necessarily the best VEnCode for multiple individuals, the optimal scenario would be to determine VEnCodes from a large cohort of donors of a cell type and then choose the VEnCodes with highest E scores from this subset. With this in mind, we calculated the five best VEnCodes using the Heuristic2 method with for k ranging from 1 to 4 for a list of primary cell types with at least 3 donors. This list can serve as a starting point to explore other properties of VEnCodes and cross-validation experiments using independent techniques (Supplementary Data S1; https://github.com/AndreMacedo88/VEnCode).
VEnCodes for alternative cell states: cancer
The FANTOM5 database contains RE usage data for 274 cancer cell line samples (Andersson et al., 2014 and FANTOM5 Consortium et al., 2014; Lizio et al., 2015), which can be merged into 158 cancer cell types (Table S3). If VEnCodes could be determined for cancer cell types, they could be used in different cell targeting methods, such as to improve cell selectivity in gene therapy directed towards cancer cells. To verify if VEnCodes could be determined for cancer cell types, we created in silico models for diseased patients carrying one cancer cell type each by adding the cancer cell type data to the 154 primary cell type database (Figure 8A). While there are many caveats and sources of additional noise with this strategy, such as cell line heterogeneity, long-term cell culture artifacts, cell donor gender, and incompleteness of the cell type and state database used, to cite just a few, it already serves the purpose of submitting the cancer cell types to the same stringent criteria as if they were a new primary cell type. Furthermore, the availability of data from cancer cell types obtained from multiple donors provides the possibility to test for interindividual robustness of the cancer cell VEnCodes.

A. Strategy for simulating a cancer patient in silico. B. Probing the intersection genetics landscape for cancer cell types using the Heuristic2 method. Plotted are the percentages of cell types found to have at least one VEnCode per k using promoter (orange circles), enhancer (gray circles), or promoter + enhancer (blue circles) data. C-D. The effect on E values of using sampling (blue) or heuristic (orange) methods to obtain VEnCodes for cancer cell types. The heuristic method increases average E for most cell types for promoter (C) and enhancer (D) data. y axis represents different cancer cell types ordered by increasing E obtained by the sampling method. Each dot is a VEnCode (n = 5-20 per primary cell type). Darker diamonds represent the mean. E-F. Case study of mesothelioma cancer cells stratified into epithelioid, sarcomatoid, and biphasic subtypes. Primary mesothelial cells are shown in the left column as a reference. Rows depict increasing k. Boxes are filled if at least one VEnCode is found using k REs. If a VEnCode is found, the box is colored according to binned average E value of the VEnCodes found (n = 1-20). G-H. Box plots representing interindividual robustness z values obtained from all cancer cell types with 3(G, H) or 4(I) donors based on promoter (left panels) and enhancer (right panels) data. G. Subsets of cancer cells for which biological replicates were available (i.e., repeated assays with the same cancer cell line). H-I. Subsets of cancer cells types for which independent cell lines were analyzed. z is saturated at 100% for all cell types tested when VEnCodes are determined using data from 2 cell donors.
Exploring the RE landscape of cancer cell types we again noticed that VEnCodes are readily obtained even for smaller k values (Figure 8B), except for enhancers, where only ~14% of cancer cell types had a specific enhancer (k = 1, Figure 8B). At k = 4, ~99% of cancer cell types surveyed could be distinguished using the heuristic method for promoters or enhancers (Figure 8B). This goes up to 100% using the heuristic2 method already with a k = 3 (Figure 8B). Cancer cell type VEnCodes are generally of very high quality, as shown by their large E values (Figure 8C and 8D). Using the heuristic method increases the E values, similarly to what we observed in primary cell lines (Figure 8C and 8D).
One caveat of the in silico cancer patient model is that not all cells of origin of some cancer cell types are present in the primary cell database. This is the case for small cell lung carcinoma (SCLC), which is thought to originate from neuroendocrine cells of the lung (Park et al., 2011). Certainly, the expansion of the primary cell database is warranted and will help to generate safer and more robust VEnCodes. To illustrate these issues more carefully, we looked at mesothelioma, for which the assumed primary cell of origin, the mesothelial cell, is available in the current database. We first stratified the mesothelioma cell types into three cytological classes according to Cellosaurus (Barioch, 2018) epithelioid (n = 7: ACC-MESO-1, ACC-MESO-4, Mero-14, Mero-41, Mero-82, Mero-95, NCI-H226, and No36 (epithelial-like stellate cells)), sarcomatoid (n = 3: NCI-H2052, NCI-H28, and ONE58), and biphasic (n = 5: Mero-25, Mero-48a, Mero-83, Mero-84, NCI-H2452) and then asked how difficult it was to generate robust VEnCodes for these mesothelioma types (Figure 8E and 8F). We find that while VEnCodes can be readily generated for primary mesothelial cells with k = 2, larger k values are required to generate VEnCodes for mesothelioma cells. VEnCodes were found for all mesothelioma subtypes, except for epithelioid mesothelioma cells, which could only be identified when promoter data was used, and even then they were of poor quality (E = ~7). In general, VEnCode intraindividual robustness E increased with higher k, again attesting for the potential safety value of using more intersections (Figure 8E and 8F).
As many cancer cell types are characterized by a level of heterogeneity, we were expecting less interindividual robustness in cancer cells relative to primary cell types. We thus applied the sampling method to calculate the interindividual robustness z of cancer cell types. We found that cancer cell type VEnCodes (k = 4) determined either from promoters or enhancer usage data, have very high interindividual robustness z, which is already saturated when data from 2 donors are used (Figure 8G-I). These results show that small RE usage signatures can reproducibly define dozens of cancer cell types. The level of interindividual robustness is similar to that of technical replicates (Figure 8G, compare top and bottom panels). Even genetically hypervariable cancer cell types, such as SCLC cells (George et al., 2015), for which data from four cell lines were available, also gave 100% z values when data from two donors were used (Figure 8I). We conclude that highly robust and safe cancer cell VEnCodes can be obtained using CAGE-seq data.
DISCUSSION
A major challenge in biomedicine is to access and gain control of a specific cellular type, be it in a healthy or disease state, within a complex and highly adaptable body. A methodology that allows genetic access to all cellular types and states in the human body would have a major impact in multiple domains of life science, including the possibility of studying and designing novel research tools, therapies, as well as better bioinspired technology and cosmetics. Such methodology addresses a major problem in the fields of life sciences research, biological engineering and gene therapy: cellular-targeting, i.e., how to restrict the desired genetic intervention to a unique set of cells within an organism or different cell states within unicellular populations. Even when specific solutions exist (e.g., antibodies against target cell surface proteins or viruses with tropism towards certain cell types) that give access to a single cell type or state in an organism, no approach is known that allows for the systematic generation of similar specific solutions for other cell types or states in any given organism. Therefore, there is a profound limitation in the technologies available to genetically access particular cellular types and states in a very limited set of organisms.
An alternative to these procedures is to use methods that do not rely on cell-specific strategies to deliver genetic materials to cells. For instance, to use a system that delivers the desired genetic material to as many cells as possible in a complex organism, unrestrictedly. Considering that such systems are becoming available (e.g., unbiased non-integrating viral delivery or chemical-based delivery), the challenge becomes to have an unlimitedly versatile genetic means of activating any particular genetic message exclusively within a target cell type.
Intersectional genetics provides a solution for cellular targeting in complex organisms. However, there are several challenges to apply intersectional genetics to human, some of which we have overcome in this paper. The first challenge was the understandable lack of a library of gene drivers with known expression patterns to choose intersections from. To enable the application of intersectional genetics in human for a wide variety of primary and cancer cell types and increase its safety and specificity, we attempted to explore alternative resources such as large RE usage databases. We explored a curated panel of 154 primary human cell types and 158 cancer cell types for which a uniform RE usage atlas consisting of CAGE-Seq data is currently available (Andersson et al., 2014; FANTOM Consortium and the RIKEN PMI and CLST (DGT), 2014; Lizio et al., 2015). FANTOM5 data and other datasets have been previously explored as potential sources of cell-specific features, including enhancers (Ienasescu et al., 2016). This tool (SlideBase) uses interacting sliders for the selection of expressed features from a given dataset by user-customized expression thresholds. However, while such user-friendly tools can serve this and many other purposes, they are neither conceived nor optimized for a systematic analysis of intersectional genetics. An additional limitation is that the datasets have not been curated with the conservative criteria for unique cell types that we used.
The second challenge was to understand the landscape of intersectional genetics, including its safety and reliability. To the best of our knowledge a systematic assessment of the potential and robustness of the intersectional genetics approach had never been performed for any organism. How far could intersectional genetics take us as an approach to gain accessibility to any given human cell? If there really aren’t specific single REs for all cell types, and/or if their usage is very risky for therapeutic and diagnosis purposes, would the intersection of two REs, for which there are technical solutions available, such as split-transcription factors and recombinase-based FLP-OUT strategies, be enough to generate cell type specific gene drivers for every human cell type?
We find that >90% of the human cell types surveyed can be safely and robustly distinguished from each other with as little as 3 to 4 REs. We called these combinations “VEnCodes” (for Versatile Entry Codes). VEnCodes can be defined as the smallest gene expression ON/OFF signature that carries enough diagnostic value to distinguish between the target cell and other non-target cell types within a complex mixture of cells. Clearly, VEnCodes with 1 and 2 REs exist and their technical exploitation is already feasible with current techniques. However, for many cells, more REs are required either to obtain a VEnCode, or to obtain a safer and more robust VEnCode. Hence, new intersectional methods are desirable to capitalize on the intersection of 3 or more active REs.
While we obtained VEnCodes for most cells using heuristic methods, we failed to obtain VEnCodes for ~10% of the primary cells surveyed, even when 10 RE intersections were allowed. It is important to notice that we have by no means saturated the VEnCode search space. Hence, more thorough, brute-force methods (e.g., an exhaustive sampling method) might find VEnCodes for these difficult cell types. However, some of these cell types might indeed have poorly-distinguishable or indistinguishable RE activity profiles. These cell types might require other techniques for detection. One possibility, which was not explored here, is to use other intersectional methods based other Boolean logical operations, such as OR, NOT, NOR.
To create a quality index for VEnCodes we determined its susceptibility to technical artifacts and biological noise using Monte Carlo simulations. We show that average VEnCode quality varies significantly between different primary cell types, so that certain cells like mast cells and hepatocytes are more safely distinguishable than most fibroblasts subtypes. By exploring RE usage data from the same primary cell type obtained from multiple donors, we find that VEnCodes are very (~100%) robust, especially when determined using enhancer data. Promoter data-based VEnCodes for primary cell types increases when data from at least two cell type donors are used. It is not clear if this reduced robustness using single donor promoter data is due a technical or biological source of noise.
To probe the RE space in a cell state paradigm, we explored data from different cancer cell lines isolated from patients diagnosed with tumors of the same cellular origin. We find that VEnCodes could be still be defined for all cancer types where multiple cell lines were available. Most cancer cell types are hypervariable in nature, posing a challenge for finding a specific VEnCode that detects different cell types across multiple individuals. However, VEnCodes could be determined even for notoriously hypervariable cancer cell types such as SCLC cells. Furthermore, as VEnCode retrieval can be systematized, in the absence of a single VEnCode that satisfies detection criteria for multiple cancer cell subtypes, multiple VEnCodes can be designed to account for cancer cell heterogeneity.
VEnCodes can now be explored as minimal RE-program-sensing parts that can be encoded genetically into plasmid-based biosensors, packaged into viral or non-viral systems, and delivered to cells in the body to diagnose whether or not the RE program of a given cell matches that of the VEnCode. Engineering biosensors that sense the activity of 3 to 4 REs and then perform a multiple-AND gate computation to generate a single output is technically feasible with synthetic biology. Such genetic biosensors could revolutionize medicine by allowing safe and specific gene delivery to any cell type or cell state in the human body.
Enhancer-based VEnCodes are clearly the most promising combinations for generating intersectional genetics tools. Each enhancer can, for instance, be placed directly upstream of a general or synthetic basal promoter. In contrast, one needs to consider that promoter-based VEnCodes, such as those obtained in the heuristic2 method, might not necessarily autonomously convey the desired cell type specific transcription when placed in a synthetic construct context. Nevertheless, there are many efforts to map enhancer x promoter interactions (e.g., Andersson et al., 2014; Mora et al., 2016; Hait et al., 2018), which could be used to optimize the heuristic2 method.
In summary, our results suggest that VEnCodes for a wide-variety of human primary cell types and cancer cells can be discovered and quality-controlled in silico using heuristic algorithms and publicly-available genome-wide RE-usage databases, such as the FANTOM5 promoter and enhancer atlases. The strategy described herein could be applied to other RE-usage databases. It would be interesting to use other databases to cross-validate the VEnCodes determined here. VEnCodes could be used to engineer intracellular biosensors or devices that use intersectional genetics tools to “read” the VEnCodes and translate them into a custom genetic output. This would allow systematic genetic access to any of these cell types or states. Genetic access carries enormous therapeutic potential by allowing the selective delivery of genetic messages and cures to cells, such as various forms of gene therapy or the specific genetic ablation of abnormal cancerous cells.
Author’s contributions
AM and AMG designed the study, implemented analyzes, analyzed the data, and wrote the manuscript.
Materials and Methods
Materials (code and data) are available at https://github.com/AndreMacedo88/VEnCode. Python language was used to implement all the algorithms and methods in this study (Python Software Foundation. Python Language Reference, version 3.6.5. Available at http://www.python.org. The R language with the ggplot2 package was used to generate the plots for the Figures (R Core Team, 2013: http://www.R-project.org/; Wickham, 2016).
Conflicts of Interests
The authors declare no conflicts of interests.
Acknowledgements
We thank Drs. Fabiana Heredia, Andres Garelli, Musa Mhlanga, Ney Lemke, Tatiana Torres, and Ms. Benilde Pondeca, and other members of the Integrative Biomedicine Laboratory for important discussions, comments, and/or suggestions on the manuscript. A.M.G. was supported by an FCT Investigator Grant (IF/00022/2012). A.M. was supported by fellowships from FCT (SFRH/BD/94931/2013) and the LIGA PORTUGUESA CONTRA O CANCRO (LPCC) 2017. Work in the Integrative Biomedicine Laboratory is supported by the FCT (UID/Multi/04462/2019; PTDC/BEXBCM/1370/2014; PTDC/MED-NEU/30753/2017; and PTDC/BIA-BID/31071/2017), the MIT Portugal Program (MIT-EXPL/BIO/0097/2017), and FAPESP (2016/09659-3).


