

Abstract
N6-methyladenosine (m6A) is one of the most abundant mRNA modifications in eukaryotes, involved in various pivotal processes of RNA metabolism. The most popular high-throughput m6A identification method depends on the anti-m6A antibody but suffers from poor reproducibility and limited resolution. Exact location information is of great value for understanding the dynamics, machinery and functions of m6A. Here we developed a precise and high-throughput antibody-independent m6A identification method based on the m6A-sensitive RNA endoribonuclease (m6A-sensitive RNA-Endoribonuclease-Facilitated sequencing or m6A-REF-seq). Whole-transcriptomic, single-base m6A maps generated by m6A-REF-seq quantitatively displayed an explicit distribution pattern with enrichment on stop codons. Independent methods were used to validate the methylation status and abundance of individual m6A sites, confirming the high reliability and accuracy of m6A-REF-seq. We applied this method on five tissues from human, mouse and rat, showing that m6A sites were conserved with single nucleotide specificity and tend to cluster among species.
Introduction
Among more than 100 RNA chemical modifications, N6-methyladenosine (m6A) is one of the most abundant form in eukaryotic mRNA, accounting for 0.1%-0.4% of all adenosine (1). The m6A modification influences various stages of mRNA metabolism as well as the biogenesis of lncRNA and microRNA, with affects across diverse biological processes including neuronal development, cell fate transition, immune response, DNA damage response, and tumorigenesis (2–10). Most m6A sites were found in conserved motif DRACH (D=G/A/U, R=G/A, H=A/T/C) (1), with partial methylation ratio ranging from 6% to 80% (11). Previous whole-transcriptome m6A maps have suggested that m6A modifications are enriched around stop codon, implying the functional importance of distribution pattern for m6A (12–14).
The chemical properties of m6A is similar to adenosine, making it difficult to discriminate by chemical reactions (15). Recently developed high-sensitivity mass spectrometry (LC-MS/MS) and blotting methods relying on antibodies were widely used to quantify the overall m6A level. To assess individual sites, methyl-sensitive ligase has been applied to confirm the methylation status of specific adenosines (16, 17), while the method called SCARLET can quantify the methylation level of individual m6A site (11). Other methods were developed to identify m6A in single-base resolution during reverse transcription, taking advantage of m6A-sensitive reverse transcriptase (18, 19), chemoenzymatic substitution of the N6-methyl group (20) or selective dNTP analogue such as 4SedTTP (21). Along with the rapid progress of single-molecule sequencing technologies, ONT sequencing platform is capable to detect modifications on model RNA (22), though the systematic error prevents the practical application in biological samples. Nevertheless, comprehensive interrogating of m6A at the transcriptome level is pivotal to reveal the biological importance of this mRNA modification. Methylated RNA immunoprecipitation and sequencing (MeRIP-seq or m6A-seq) has been widely used to profile m6A, identifying approximate region with m6A in ~100 nt length, while the exact location of individual m6A site remains undetermined (12, 13). Many refined methods have been developed to improve the resolution, such as PA-m6A-seq, miCLIP and m6A-CLIP (23–26). However, all of these methods are dependent on m6A-specific antibodies, suffering from poor reproducibility and complicated process. In addition, affinity variation and batch effects of antibodies make it difficult to quantify the methylation level (27). Therefore, a convenient and single-base resolution method is still needed for whole-transcriptome m6A identification and quantification, advancing the comprehension of m6A for its dynamics and cellular functions in post-transcriptomic regulation.
Several DNA endonucleases belonging to the restriction-modification (R-M) system have demonstrated sensitivity to DNA methylation. For instance, DpnI specifically cleaves methylated sites while DpnII is blocked by the same modified sequence. This feature has been adopted in genome-wide studies to detect the DNA 6mA modification in single base resolution (6mA-RE-seq/DA-6mA-seq) (28). For RNA endoribonucleases, a large group of sequence-specific enzymes belonging to the bacterial type II toxin-antitoxin (TA) system have been uncovered and the cleavage motifs are determined. Recently, an Escherichia coli toxin and RNA endoribonuclease, MazF, was reported to be sensitive to m6A modification within ACA motif, specifically cleaving the unmethylated ACA motif, leaving methylated (m6A)CA motifs intact (29). By screening the endoribonuclease pool, we identified endoribonuclease ChpBK as an endoribonuclease which can discriminate m6A-modified motifs from unmodified RNA. Taking advantage of the m6A-sensitive endoribonucleases, we developed m6A-sensitive RNA-Endoribonuclease-Facilitated sequencing method, m6A-REF-seq, which can identify transcriptomic m6A sites and quantify the methylation level in single-base resolution. To validate the m6A sites identified by this method, we employed a ligation-based method testing individual sites and achieved recurrent results independently. Further analysis revealed the hidden distribution pattern of m6A in single nucleotide resolution. Finally, we applied m6A-REF-seq to five tissues from human, mouse and rat, revealing the conservation of m6A in both single-base and regional levels across diverse tissues and species.
Results
Discrimination and quantification of m6A by endoribonuclease
The application of methylation sensitive DNA endonuclease in genome-wide 6mA identification inspired us to inspect the possibility of finding similar tools for m6A determination (28). To discover endoribonuclease with m6A sensitivity, we expressed and screened the candidate enzymes by testing the cleavage capacity to synthetic RNA oligonucleotides with or without m6A. Two enzymes, MazF and ChpBK, both belonging to the bacterial toxin-antitoxin system, were able to distinguish N6-methyladenosine (m6A) from unmethylated A. MazF recognized and cleaved the motif sequence ACA from the 5’-side of first A, leaving the methylated (m6A)CA motif intact (Fig. 1A). ChpBK was also blocked by m6A within the recognition motif, UAC (Fig. 1B). Synthetic RNA oligos with different m6A/A ratios were used to simulate the partially methylated mRNA. The cleavage assay demonstrated the fraction of digested oligo versus intact part was proportional to the methylation ratio, implying MazF has the potential to quantify the methylation level of mRNA (Fig. 1, C and D and fig. S1).

(A) Validation for the methylation sensitivity of endoribonuclease MazF by synthetic m6A-containing RNA oligonucleotide. (B) Validation for the methylation sensitivity of endoribonuclease ChpBK. (C) Various ratios of m6A-containing oligo mixed with unmethylated oligo digested by endoribonuclease. The m6A/A ratios of synthetic oligo are indicated to imitate practical RNAs with different m6A ratios. (D) Relative grayscale of proportionally mixed RNA oligo digested by endoribonuclease. (E) The schematic diagram of m6A-REF-seq.
The high sensitivity and specificity of enzymatically distinguishing m6A urged us to develop a new high-throughput method to identify single-base m6A on the transcriptome level. Since the MazF recognition motif ACA is more prevalent than that of ChpBK among known m6A sites, we chose MazF in following studies. Generally, mRNA from HEK293T cells was digested into fragments by MazF. After end-repair and purification, the mRNA fragments were ligated to NGS adaptors and amplified by PCR. To prevent potential false positives caused by unknown factors, a parallel sample batch demethylated by FTO in advance was also processed as the negative control (fig. S2). We call this method m6A-REF-seq, standing for m6A-sensitive RNA-Endoribonuclease-Facilitated sequencing (Fig. 1E).
Transcriptome-wide identification of m6A sites in single-base resolution
We developed a pipeline to analyze the high-throughput sequencing data generated by m6A-REF-seq (Fig. 2A). As we anticipated, most reads contained the ACA at the 5’ terminus, in line with the effect of MazF treatment (fig. S3). The intact ACA motif sequence observed internally within an RNA fragment was supposed to be methylated. We verified this using the known m6A site with ACA motif on the 18S rRNA as an example. The unmethylated rRNA fragments were cleaved on the ACA motif and the methylated fragments were retained (Fig. 2B). Next we scanned each ACA motif within the transcriptome and interrogated the methylation sites by calculating the reads harboring intact internal ACA motifs. To further eliminate the potential false positive caused by RNA structure, we predicted the probability of each RNA fragment forming secondary structure according to minimum free energy (30), and removed the candidate sites tending to reside in double-stranded regions. We performed three biological replicates and retained the recurrent candidate sites detected in at least two replicates (Fig. 2C and table S1). For each site, the ratio of sequence reads with internal ACA motif versus reads split at the end represents the relative methylation ratio. We compared the methylation ratio of each candidate site in MazF treatment to the sample treated with FTO in advance, which was considered as demethylated RNA. Most of m6A sites had dramatic reductions in methylation level with FTO treatment (Fig. 2D). Only candidate sites with a significant decrease of methylation ratio in FTO treatment were considered as accurate m6A sites. In total we identified 4,260 high-confidence m6A sites for further studies.
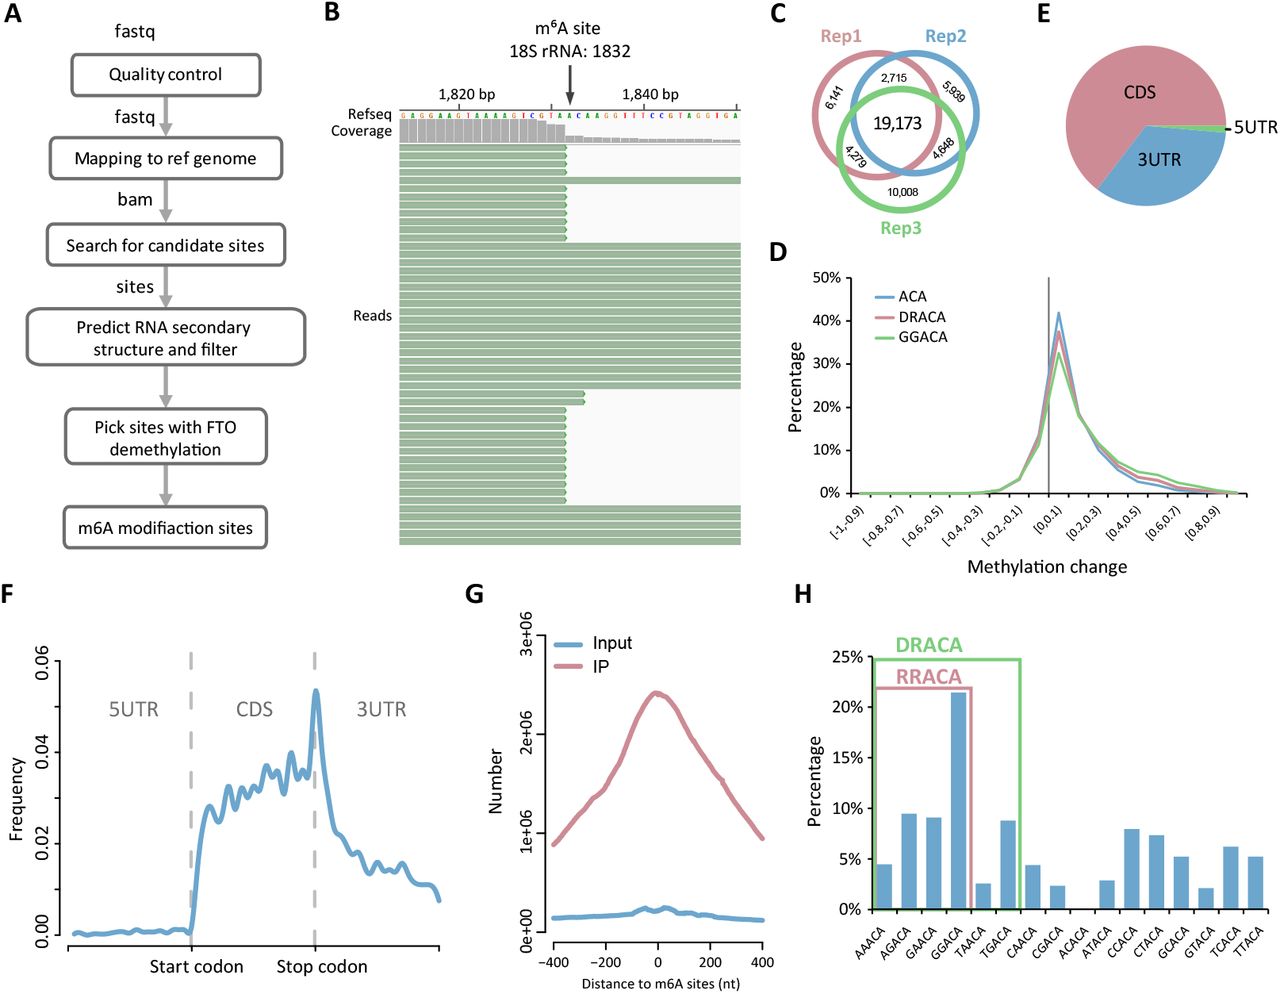
(A) The analysis pipeline of m6A-REF-seq data. (B) The snapshot of sequencing reads shows a known m6A site in 18S rRNA. (C) Overlap sites among three replicates after removing RNA secondary structure. (D) The overall shift of methylation ratio after FTO treatment. The value of methylation change indicates the methylation ratio of each m6A site in MazF minus that after FTO treatment. (E) Transcriptome-wide distribution of m6A. Pie chart shows the percentages of m6A sites located within CDS, 5’ UTR and 3’ UTR. (F) Single base m6A sites from m6A-REF-seq shows a typical transcriptome-wide distribution for m6A. (G) Overlap of m6A sites to the m6A peaks identified by antibody-based method. (H) The proportion of motifs containing m6A sites. The red square includes the RRACA motif, the green square includes the DRACA motif.
About 65% of these sites located in the CDS region and others were in UTRs (Fig. 2E). The transcriptome-wide distribution showed strong enrichment surrounding the stop codon (Fig. 2F), in line with the typical pattern discovered by antibody-dependent methods such as MeRIP-seq or m6A-seq. To compare the m6A location with MeRIP-seq in detail, we downloaded the profiling data deposited in GEO database (GSE29714) (12), and calculated the cumulated reads distribution of input and IP samples within the range of −400 nt to 400 nt flanking to every m6A site identified by m6A-REF-seq. The reads from IP samples were dramatically concentrated in this region, with a peak summit at almost the exact position of individual m6A sites; whereas reads from input sample did not show any enrichment, implying the m6A sites identified by m6A-REF-seq coincided well with the m6A peaks reported by MeRIP-seq (Fig. 2G). By expanding the context sequences flanking m6A sites, we found GGACA was the most enriched consensus motif. More generally, the consensus motifs DRACA and RRACA were overrepresented, accounting for 56% and 45% of all identified m6A sites, respectively (Fig. 2H). These results were in concordance with previous studies, in which DRACH/RRACH was the most preferred m6A motif in native mRNA (12, 13, 24).
High reliability of individual m6A sites identified by m6A-REF-seq
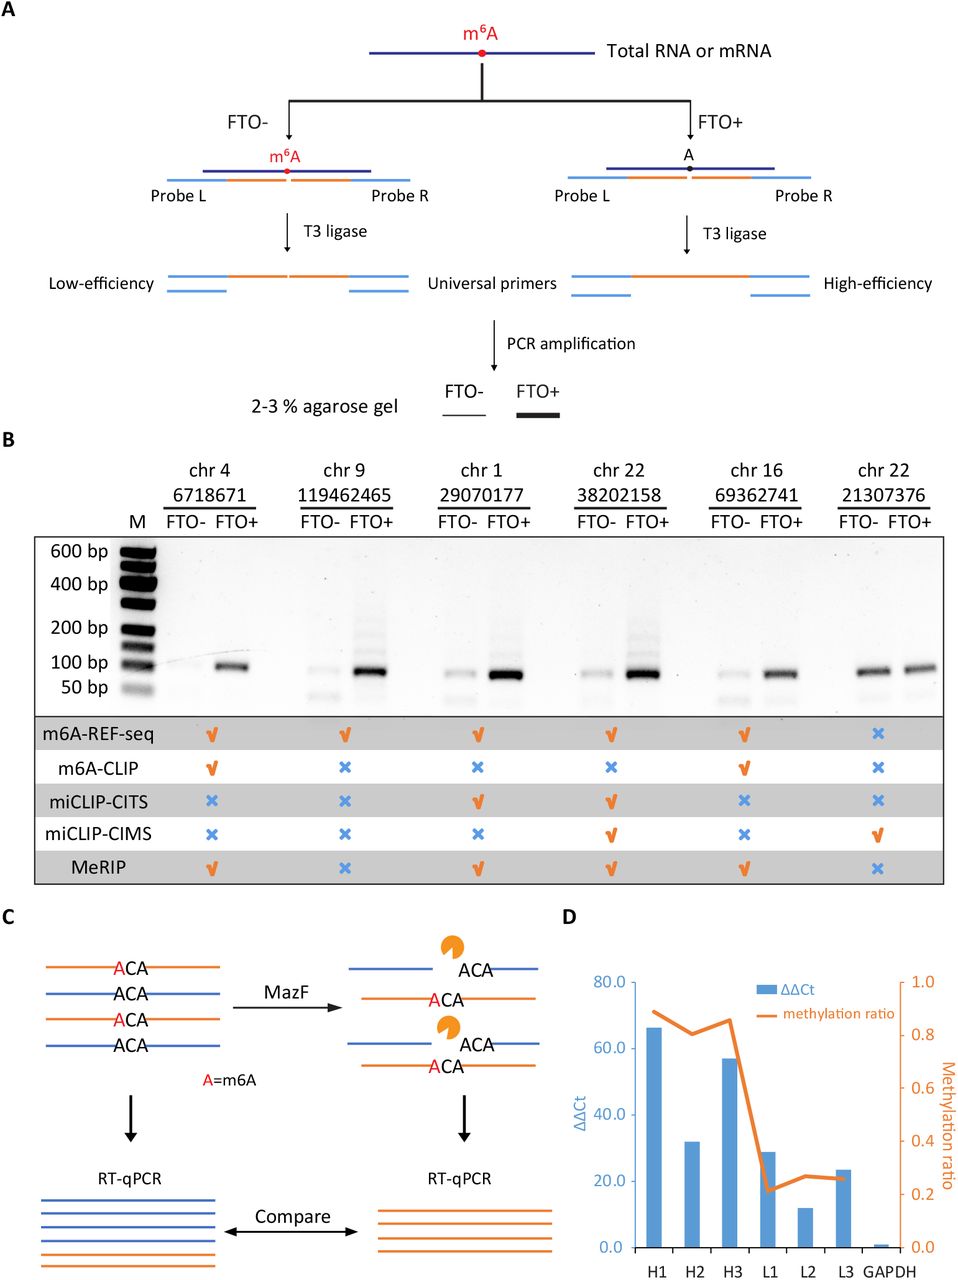
To show the reliability of m6A-REF-seq as a new method, we sought another independent principle to validate individual m6A sites. The T3 ligase was reported to be sensitive against m6A sites during the ligation reaction, which had been applied practically to identify m6A sites in mRNA (17). We adopted this method and designed the probe L and probe R based on the sequence flanking the exact site (table S2), then used the T3 ligase to concatenate the two probes to an integrated template which could be amplified by PCR. According to previous result, the ligation efficiency at m6A site was significantly suppressed comparing to the efficiency at unmethylated A sites (17) (fig. S4). PCR amplification magnified the difference of ligation efficiency. Thus the amount of PCR products could be assessed on gel to represent the ligation efficiency, implying the methylation status of the interrogated site (Fig. 3A). In vitro FTO demethylation of mRNA was conducted, followed by the same ligase-based protocol for negative control. We picked nine m6A sites, including eight m6A sites and one unmethylated A. Six out of eight m6A sites were validated by the ligase-based method while the unmethylated site was also confirmed (Fig. 3B and fig. S5). To the best of our knowledge, this is the first batch of individual m6A sites confirmed by two independent methods. Interestingly, one validated m6A site (chr1: 29070177; Fig. 3B) is located at 343 nt upstream from the stop codon of m6A reader protein YTHDF2, suggesting a self-regulating feedback loop mediated by RNA modification.

(A) Schematic diagram of ligation-amplification method for single-base m6A validation. (B) Validation results of six individual sites. Five of the sites are validated to be m6A sites, whereas the other one is confirmed to be not modified. Data for m6A-CLIP, miCLIP-CITS, miCLIP-CIMS and MeRIP-seq are downloaded from published literatures. (C) Schematic diagram of qPCR to quantify the methylation level of a specific m6A site. The undigested mRNA sample is treated as control. (D) qPCR results and methylation ratios of six m6A sites. H1-H3 represent the highly methylated sites (> 0.75) while L1-L3 represent the weakly methylated sites (< 0.35). The left y-axis represents the ΔΔCt values and the right y-axis represents the methylation ratio determined by m6A-REF-seq.
Two other antibody-dependent methods, m6A-CLIP and miCLIP, had reported comprehensive m6A maps in transcriptome level. We checked whether the six individual m6A sites could be identified by these two methods. Peaks from MeRIP-seq data were also included as reference. Out of the six sites, one of them was not reported in either previous method. The negative control site supposed to be unmethylated was reported by miCLIP as an m6A site but not by other methods (Fig. 3B). We suspect that differences in samples, as well as the dynamic nature of m6A methylation contribute to these inconsistencies and potential false positives. Nevertheless, these results emphasize the need of independent methods to confirm authentic m6A sites for downstream analysis, especially considering m6A as a highly dynamic RNA modification.
Quantification of m6A abundance by m6A-REF-seq
m6A-REF-seq not only determines the methylation status, but can also be used to quantify the methylation level of each m6A site by calculating the ratio of sequence reads with internal ACA versus reads split at the motif. To verify this, we designed a digestion-quantification assay that utilized RT-qPCR to evaluate the methylation level of identified m6A sites. First, mRNA was treated by MazF. The unmethylated sites located in ACA motif were cleaved, leaving intact methylated sites. After reverse transcription, cDNA spanning the intended m6A site was amplified by PCR to estimate the relative abundance. The same amount of mRNA without MazF digestion was amplified simultaneously as a control to compare with the digestion sample (Fig. 3C). We picked six m6A sites including three sites with high methylation level and three sites with low methylation level determined by m6A-REF-seq (table S3). The ΔΔCt values calculated from RT-qPCR results were comparable to the average methylation ratio determined by m6A-REF-seq (Fig. 3D and fig. S6), demonstrating m6A-REF-seq can principally quantify the methylation fraction of m6A sites.
Characterizing m6A distribution pattern in single-nucleotide resolution
Previous studies demonstrated that one of most remarkable features of m6A was the distribution enrichment surrounding stop codon (12, 13). However, limited by the resolution of antibody-based methods, it was hard to know the precise position relative to the exact stop codon site, which divides coding regions and 3’ UTRs. The single-nucleotide m6A identification method largely increased the resolution of m6A map. Interestingly, our results showed this stop-codonconcentrated pattern could be reproduced by using single-nucleotide m6A sites, without any preference to coding regions or 3’ UTRs (Fig. 4A). Meanwhile, it was worth noting that consensus motif DRACA and DRACH were also enriched near stop codon, suggesting sequence motif might be the dominant factor to shape this pattern (Fig. 4A).

(A) The distance of individual m6A sites to the stop codons. DRACA and DRACH background motifs are extracted from the transcriptome. (B) The relative position of m6A sites within exons. (C) The length distribution of m6A-containing exons versus all exons in m6A-modified genes. (D) The distances between two m6A sites are significantly enriched within 200 bp regions compared to random sampling (Fisher’s exact test, **p < 0.01).
m6A had been proposed to be involved in various key regulatory processes of RNA metabolisms, including splicing (31). We calculated the relative distances of m6A sites to intronexon boundaries in each exon and plotted in Fig. 4B. The result showed m6A distributed evenly along exon regions, with slight depletion towards the 3’ end. By mapping single m6A sites to exons, we compared the lengths of exons containing m6A modifications versus all exons. The lengths of m6A-containing exons were significantly greater than all exons (Fig. 4C, p < 2.2×10⁻¹⁶, Wilcoxon test), in line with previous report that m6A modification usually occurred within long exons (13).
Some indirect evidence showed that m6A tended to locate in short regions, suggesting a specialized working model of m6A as clusters. However, antibody-based methods could barely divide multiple sites from one m6A peak to demonstrate clustering. Utilizing the single-nucleotide m6A positions identified by m6A-REF-seq, we calculated the distances between each two adjacent m6A sites and compared to the control dataset, which contained the same number of sites randomly sampled from transcriptome 1,000 times. Our result showed two adjacent m6A sites were statistically prone to aggregate within 200 nt regions (p=6.6×10⁻⁵ and p=0.0065, Fisher’ exact test), supporting the hypothesis that m6A functions within clusters of modification (Fig. 4D).
Conservation of m6A sites in mammals
We next applied m6A-REF-seq to identify m6A modifications in different tissues of human, mouse and rat, and identified more than 3,500 individual m6A sites in each sample (tables S4 and S5). The transcriptomic distribution displayed similar patterns among tissues in three species (Fig. 5A and figs. S7-S9). To examine the conservation of m6A at the individual gene level, we first collected 13,117 one-to-one orthologs in three species. By mapping the m6A sites to these ortholog genes in each type of tissues, we identified 2,439 human genes, 3,596 mouse genes and 1,343 rat genes in brain, among which 571 of them were shared in three species. The numbers were 536 and 262 for kidney and liver, respectively (figs. S8 and S9). These common ortholog genes modified by m6A in all three species were significantly more than expected, indicating a well-conserved distribution of m6A in gene level (Fig. 5B and table S6). Similarly, previous studies have reported the count of shared m6A peaks between human and mouse were significantly higher than expected, implying the conservation and important functions of m6A modification (13).

(A) Metagene plots of m6A in the brain of human, mouse and rat. (B) Shared m6A-modified genes among three species. (C) Diagram showing the m6A sites conserved in the corresponding short regions from different species. (D) Frequency of distances for pairwise m6A in brain. Randomly picked ACA motifs are assigned for the same analysis as control. (E) Conservation scores of all m6A sites, methylation sites in ortholog genes and conserved m6A sites are compared to that for all A sites in ACA motifs (p-values < 9×10⁻¹⁰, Wilcoxon test).
Since m6A-REF-seq identified high confidence sites, we were able to investigate the conservation of m6A in single-nucleotide level. Another work analyzed the evolutionary conservation of yeast and human m6A sites in protein-coding regions and concluded that most m6A modifications were unconserved (32). However, the m6A sites used by this work were predicted based on the consensus motif DRACH, which could contain underestimated false-positives. Therefore, we mapped the single-nucleotide m6A sites identified by m6A-REF-seq to orthologous genes in three species, and calculated the significance of corresponding sites. In contrast to previous work, we found the counts of pairwise m6A sites were significantly more than expected (table S6). Furthermore, we tested whether the non-pairwise m6A sites tended to cluster in narrow corresponding regions among species. The shortest distances between pairwise m6A sites in ortholog genes were averaged (Fig. 5C). Random sampling of the same number of ACA motifs were performed for 1,000 times as control. The average distances between pairwise m6A sites were shorter than control (Fig. 5D, figs. S8 and S9), indicating that even though some m6A sites were not conserved in single-nucleotide level, they tended to cluster within conserved short regions across multiple species.
More extensively, we computed the PhastCons scores representing the conservation of each nucleotide among multiple-species (33). Identified m6A sites in brain were attributed and classified into sites conserved in three species or sites residing in ortholog genes. As expected, conserved m6A sites in single-base level and sites conserved in gene level had highest conservation scores (medians 0.991 and 0.970, respectively). The scores of overall m6A sites was also distinctively higher than that of all A sites in ACA motifs with the medians 0.791 and 0.338, respectively (Fig. 5E, p-values < 9×10⁻¹⁰, Wilcoxon test). Similar results hold for other tissues in human, mouse and rat (figs. S8-S10).
Discussion
Antibody-dependent pulldown methods are widely used to profile transcriptomic m6A, the most prevalent modification in mRNA. An antibody-independent, easy-to-use method is strongly desired to cross-validate the known m6A sites and study the dynamic functions in singlenucleotide resolution. We developed m6A-REF-seq, an antibody-independent, high-throughput and single-base m6A detection method based on m6A-sensitive RNA endoribonuclease. High sensitivity and specificity of endoribonuclease we discovered to discriminate m6A modification, as well as stringent data process by removing potential RNA secondary structure and the introducing of FTO demethylation control, ensured reliability of m6A sites identified by this method. Transcriptome-wide m6A maps in human HEK293T cell and mammalian tissues displayed similar distribution pattern with previous antibody-based pulldown methods. To validate the m6A sites identified by m6A-REF-seq, we introduced another independent method which utilized T3 ligase to differentiate individual m6A or A at template RNA. The high consistency between different methods demonstrated the efficiency of m6A-REF-seq with high confidence. We also applied quantitative PCR (qPCR) to show that m6A-REF-seq could quantify the methylation level of individual m6A site.
The RNA endoribonuclease MazF has high sensitivity and specificity for RNA substrates. It works very well on extremely limited substrate, as little as nanograms or even picograms. Rapid and simplified experiment design, without the need for antibody-enrichment step largely reduces the requirement of starting RNA amount and sample preparation time. Therefore, this method could be applied to the studies for rare biological materials such as samples from pathological tissues or early embryos. Additionally, m6A-REF-seq offers the potential to capture the subtle changes of m6A during metabolic processes, advancing the dynamic studies of this post-transcriptional RNA modification in different life stages.
By screening RNA endoribonucleases, we discovered two m6A-sensitive enzymes from the bacterial type II toxin-antitoxin (TA) system, which recognized specific motifs “ACA” and “UAC”, respectively. To cover all the RRACH motifs in the transcriptome, we need new enzyme(s) capable of recognizing more universal sequence motifs while retaining the m6A-sensitivity. Based on our preliminary screening, we speculated that the m6A-sensitivity might be a general feature of endoribonucleases belonging to type II TA system. Further exploring in the endoribonucleases pool would be helpful to expend the toolbox for RNA modification studies. Another strategy is to transform the existing enzyme to adapt for new recognition sequences while retaining the methylation sensitivity. We studied the structure of MazF protein and mutated the 56th Lysine to Alanine. Even though the MazF-K56A mutant did not meet our expectation, the methyl-sensitivity was retained (fig. S11), suggesting single base or amino acid mutation may influence the cleavage efficiency or even change the target motif. On the other hand, directed evolution would be a promising way to expand the recognition sequence scope of MazF or other related proteins, as long as dedicated screening system was created.
We applied m6A-REF-seq to five different tissues from human, mouse and rat. The singlebase m6A maps displayed a distribution pattern similar to previous findings, that m6A tended to enrich surrounding stop codon. More importantly, this unique pattern seemed to be conserved among different species. However, because of limited resolution, previous methods could not tell to what extent the modification is conserved. In this study, we mapped the m6A sites to orthologous genes in these three species and compared the conservation score in single-nucleotide level. We found significantly more m6A-modified genes were shared among species than expected, and a large group of m6A sites could be aligned to the syntenic regions, showing the m6A modification was conserved at both the gene and individual base level. The well-conserved feature restated the biological importance of m6A, implying other uncovered roles of this RNA modification.
Taken together, m6A-REF-seq provides a new perspective for single-base m6A identification on the transcriptome level. The independent principle eliminates the need for m6A-specific antibodies, making it unique and amenable for future applications in small and precious samples. The features of this efficient and convenient method largely expand the scope of m6A studies.
Materials and Methods
RNA materials
The RNA oligonucleotides were synthesized from Takara Bio Inc as listed below.
RNA-m6ACA 5’ UUGGUUUUUUUUGG(m6A)CAUGUAUAUAGU 3’
RNA-ACA 5’ UUGGUUUUUUUUGGACAUGUAUAUAGU 3’
RB1-m6ACA 5’ GUUGUGUGAUAU(m6A)CAUAUGGUGGUG 3’
RB1-ACA 5’ GUUGUGUGAUAUACAUAUGGUGGUG 3’
Human HEK293T cell line was cultured with DMEM (Corning) supplemented with 10% (v/v) FBS (Gibco) at 37 □ in the presence of 5% CO2, and tested to be mycoplasma negative. Total RNA from HEK293T cells was extracted using Trizol reagent (Thermo Fisher Scientific) and the mRNA was purified using Dynabeads mRNA Purification Kit (Thermo Fisher Scientific, Cat. No. 61006). The mRNA of human tissues (brain, liver and kidney), mouse tissues (brain, liver, heart, testis and kidney) and rat tissues (brain, liver and kidney) were purchased from Takara Bio Inc.
RNA endoribonuclease validation for MazF
RNA oligo (10 pmol) were incubated with 2.5 U MazF (mRNA intereferase-MazF, Takara, code No. 2415A) in the 20 ul reaction mixture of MazF buffer (40 mM sodium phosphate (pH 7.5) and 0.01% Tween 20) at 37 □ for 30 min. The RNA oligos were mixed with the m6A percentage of 0%, 20%, 40%, 60%, 80%, 100%, and the oligo mixtures were incubated with 2.5 U MazF in the 20 ul reaction mixtures. The samples were loaded into 15% urea-polyacrylamide gel and electrophoresed in 0.5× TBE buffer.
The FTO demethylation reaction was conducted in the reaction mixture contained 10 pmol m6A RNA oligo, 0-10 ug FTO demethylase, 283 μM of (NH4)2Fe(SO4)2·6H2O, 300 μM of α-KG, 2 mM of L-ascorbic acid, 20 U RNase inhibitor (Takara, code No. 2313A) and 50 mM of Tris·HCl buffer (pH 7.5). The reaction was stopped by 40 mM EDTA after 3h incubation at room temperature. The MazF cleavage reaction was performed to test efficiency of FTO demethylation.
Dot-blot assay of FTO demethylation
m6A FTO demethylase with different concentration (0 ug, 0.25 ug and 2.5 ug) were used in the dot-blot assay to test the demethylation of RNA. The total RNA was incubated with FTO, 283 μM of (NH4)2Fe(SO4)2·6H2O, 300 μM of α-KG, 2 mM of L-ascorbic acid for 3 h at room temperature. After purified with RNA Clean & Concentrator-5 kit (ZYMO Research), the concentration of total RNA was determined by Qubit RNA HS Assay Kit (Thermo Fisher Scientific) and diluted to 10 ul volume with 500 ng. Spotting and thermal crosslinking were carried out on a metal base plate preheated to 70 □. After thermal cross-linking for 15 min, UV cross-linking was conducted twice with 2000 KJ. Then, 3% BSA was used to block at room temperature for 1 h. The anti-m6A antibody (Synaptic Systems, Cat. No. 202003) was diluted to 1:2000 and incubated with the nylon membrane for 2 h. The nylon membrane was washed for three times with 1% TBST, and then was incubated with the 1:5000 diluted anti-rabbit antibody for 1 h. The membrane was washed for five times with 1% TBST. After draining off the water, the chemiluminescence detection signal was performed using the ECL system. The membrane was washed twice with 1% TBST. After draining off the water, it was dyed with methylene blue solution for 8 min, and then washed with 1% TBST. The signal was detected by a white light system.
Expression and purification of recombinant ChpBK protein
To express recombinant ChpBK protein (NCBI Reference Sequence: NP_418646.1), E. coli BL21(DE3) strain carrying PET-28a-chpBK OD600 plasmid was grown in LB medium supplemented with Kan 10 ug/ml at 37 □ and 200 rpm until the OD600 reach to 0.5. Isopropyl-β-D-thiogalactopyranoside (IPTG) was added to a final concentration of 0.4 mM and cell growth resumed for 2 h under the same conditions. Harvested cell pellets were lysed by sonication in 30 ml of buffer A (10 Mm BisTris, pH 7.0, 30 mM imidazole), and centrifuged for 20 min at 16,000 g and 4 □. The soluble fraction was incubated on ice for 30 min in the presence of DNase and RNase (10 g/ml; Thermo Fisher Scientific). The His-ChpBK fusion protein was purified from clarified lysates using a Ni-NTA beads (Invitrogen). Protein purity was determined by SDS-PAGE analysis and samples were quantified using the Bio-Rad protein assay and stored at −80 □.
Expression and purification of MazF-K56A in E. coli
The 56th Lysine of MazF protein was mutated to Alanine. The protein sequence is shown below, where the underlined bold “A” indicates the mutated amino acid.
>MazF-K56A
MVSRYVPDMGDLIWVDFDPTKGSEQAGHRPAVVLSPFMYNNKTGMCLCVPCTTQSAGY PFEVVLSGQERDGVALADQVKSIAWRARGATKKGTVAPEELQLIKAKINVLIG
The plasmid DNA pCOLD-MazF was transformed into E. coli Rossetta strain and a single colony was picked by sterilized loop and inoculated to 50 mL LB (containing Ampicillin) in sterile culture flask. E. coli was cultured at 37 □ until OD600 reached 0.6-0.8. IPTG (1 mM) was added to induce protein expression and cells grew overnight at 18 □. Cells were harvested by centrifugation and suspended in 200 ml lysis buffer (50 mM Tris pH 8.0, 350 mM NaCl, 10 mM Imidazole). Cell pellets were lysed by sonication and the supernatant were collected by centrifugation and applied to Nickel affinity purification using HisTrap HP. The column was washed by lysis buffer to remove non-specific binding protein and target protein was eluted with linear gradient of elution buffer (50 mM Tris pH 8.0, 350 mM NaCl, 500 mM Imidazole). We concentrated the protein and changed protein storage buffer to Ion-exchange binding buffer (20 mM HEPES, 50 mM NaCl, pH 7.5) by HiTrap desalting column. TEV protease was used to remove the His-tag and target protein was loaded to HiTrap HP Q column. Target protein was eluted by linear gradient of Ion-exchange elution buffer (20 mM HEPES, 1 M NaCl, pH 7.5). The concentrated protein was analyzed by SDS-PAGE.
RNA endoribonuclease validations for ChpBK and MazF-K56A
The digestion reaction of ChpBK was conducted in a 20 ul reaction mixture with 10 pmol RNA oligo (RB1), 1 ug ChpBK, 20 U RNase inhibitor and 10 mM Tris·HCl buffer (pH 7.5). The mixture was incubated at 37 □ for 30 min. The digestion reaction of ChpBK with different m6A percentage was conducted as described above. The MazF-K56A cleavage reaction was performed in a 20 ul reaction mixture with 10 pmol RNA oligo, 2 ug MazF-K56A and 1× MazF buffer (40 mM sodium phosphate (pH 7.5) and 0.01% Tween 20) at 37 □ for 30 min. All samples were loaded on the 15% urea-polyacrylamide gel and electrophoresed in 0.5× TBE buffer.
Library construction for next-generation sequencing
mRNA was first heated at 85 □ for 5 min and chilled on ice for 2 min to denature RNA secondary structure. The FTO demethylation reaction was conducted before MazF reaction in 20 ul of reaction mixture containing 100-200 ng mRNA, 2.5 ug FTO demethylase, 283 μM of (NH4)2Fe(SO4)2·6H2O, 300 μM of α-KG, 2 mM of L-ascorbic acid, 20 U RNase inhibitor and 50 mM of Tris·HCl buffer (pH 7.5). After incubating at room temperature for 3h, the reaction was stopped by adding 40 mM EDTA. In order to prevent the influence of FTO buffer, the MazF treatment was supplemented with the same reaction mixture except FTO protein. The MazF and FTO-MazF samples were heated at 85 □ for 5 min and chilled on ice for 2 min, and then incubated with 10 U MazF in the MazF reaction buffer at 37 □ for 30 min. The fragmented mRNA was purified by RNA Clean & Concentrator-5 kit (ZYMO Research) and eluted into 20 ul RNase-free water. The eluted RNA fragment was end-repaired by the T4 polynucleotide kinase (T4PNK; Vazyme Biotech) in 50 ul reaction mixture with 1x T4PNK buffer, and incubated at 37 □ for 30 min. After purification by RNA Clean & Concentrator-5 kit (ZYMO Research), the concentration of fragmented mRNA was measured by Qubit RNA HS Assay Kit (Thermo Fisher Scientific). The NGS library was constructed by using VAHTS Small RNA Library Prep Kit (Vazyme Biotech, NR801) with 10 ng fragmented mRNA and amplified by PCR for 15 cycles. Libraries were loaded on the 8% urea-polyacrylamide gel and electrophoresed in 0.5× TBE buffer, and purified libraries were sequenced on the Illumina HiSeq X10 platform. Three replicates have been conducted for mRNA of HEK293T cell line. The same protocol was also conducted for mammalian tissues.
NGS data analyses
First, quality control was performed on raw sequencing reads by the open software FastQC (http://www.bioinformatics.babraham.ac.uk/projects/fastqc/). Then adaptors were filtered by cutadapt (34) with at least 15 nt remaining length of paired-end reads. The clean reads were mapped to the reference genome (hg19) using Hisat2 (35) with default parameters except reporting only one result. IGV was used for data visualization (36). We scanned the motif ACA (and the reverse complementary motif TGT) on the reference genome and mapping result file, respectively, counting the number of ACA/TGT at the internal or terminal of a sequence read. As short sequence reads with lengths less than 15 nt were filtered, only ACA/TGT with the distance from the end of a read more than 15 nt was treated as “internal” of a read. Each ACA/TGT motif on the reference genome which has more than ten reads supporting the motif located internal of reads were treated as a candidate m6A site. The ratio of sequence reads with internal ACA versus reads split at the end represents the relative methylation ratio of each site. Candidate sites with repeated or continuous ACA motifs were removed.
As the RNA secondary structure could affect the reaction efficiency, we predicted the probability of each RNA fragment forming secondary structure, and removed the candidate sites tending to reside in double-stranded regions. The RNAfold program of ViennaRNA package (30) was used to predict intramolecular secondary structure of each read which supported the candidate sites. The condensed representation of the pair probabilities of each nucleotide was parsed according to the tutorials of ViennaRNA package. The pairing probability value of NNACA motif was calculated and candidate sites with high pairing probability were discarded. The FTO demethylation treatment was also treated as a negative control. Candidate sites with at least 10% methylation ratio decrease were remained as m6A sites. The metagene plot of m6A sites, which was described the relative location of each site on the 3’UTR, CDS, and 5’UTR of mRNA, was calculated and plotted as well. The previous m6A-CLIP and miCLIP datasets were downloaded from Ke et al. (25) and Linder et al. (24), respectively. The raw reads of MeRIP-seq datasets were downloaded from Meyer et al. (12) (GSE29714) and mapped to human (hg19) reference genome using Hisat2. The reads within the range of −400 nt to 400 nt flanking to every m6A site were plotted. As the sequencing data was single-end, we extended the reads to 200 nt to simulate the IP peak.
Single-base validation using ligase-based method
Refined single-base T3 ligase-based method (17) was used to validate m6A sites identified by m6A-REF-seq. The FTO demethylation sample was used as negative control (i.e. the FTO+ treatment in Fig. 3A). The ligation reaction mixture A consisted of 20 nM probe L, 20 nM probe R, 1× T3 ligation buffer (NEB) and 300 ng total RNA with or without FTO treatment. The ligation reaction mixture B consisted of appropriate amount of T3 ligase (NEB) with ligation buffer. Mixture A was heated at 85 □ for 3 min and then incubated at 35 □ for 10 min, and then the ligation reaction mixture B was added to the final volume of 10 ul. This mixture was incubated at room temperature for ligation reaction for 8-10 min and chilled on ice immediately. The volume of 1ul ligation product was used to PCR amplified for 24 cycles in the 2× Taq mix (Vazyme Biotech). The samples were loaded into the 2-3% agarose gel and electrophoresed in 0.5× TAE buffer to detect the signal.
qPCR validation for m6A quantification
The MazF treatment was performed in 10 ul volume with 500 ng mRNA and 10 U MazF at 37 □ for 30 min. The digested mRNA and non-digested mRNA were subjected to reverse transcription using 5×TransScript All-in-One First-Strand cDNA Synthesis SuperMix for qPCR (One-Step gDNA Removal; Transgen Biotech, AT341-02). TB Green Premix Ex Taq II (Tli RNaseH Plus, Takara, Code No. RR820A) was used on BIO-CFX96 Touch.
Characterizing m6A distribution pattern in single-base resolution
Consensus motifs DRACA and DRACH were scanned on the reference genome, and the distances of A sites in the two motifs to stop codons were calculated and plotted as well. The relative position in exon for m6A, regular A sites in DRACA and DRACH were computed. In order to estimate the distance between two adjacent m6A sites, only genes with more than two m6A sites were analyzed. We randomly sampled the same number of ACA motifs as the number of observed m6A and repeated this step for 1,000 times as control. The distances between adjacent A sites in control were calculated. Fisher’s exact test was used to test the significance of first two bins. The conservation analysis was conducted using PhastCons scores of human hg19 genome downloaded from UCSC.
Conservation of m6A in the same mammal tissues
m6A-REF-seq protocol was used to identify m6A sites in the different tissues of human (brain, liver and kidney), mouse (brain, liver, heart, testis and kidney) and rat (brain, liver and kidney). The one-to-one orthologous genes in pairwise species of human (GRCh37.p13), mouse (GRCm38.p6) and rat (Rnor_6.0) were downloaded from Ensembl (Ensembl genes 94). A total of 13,117 one-to-one orthologous genes among three species were retained for downstream analyses. Protein sequences of 13,117 orthologs in human, mouse and rat were aligned by Muscle (37) and then converted to corresponding coding sequence alignments using PAL2NAL (38). The shared m6A-modified genes and share m6A sites among species were calculated and tested for significances. The average pairwise distances among closely m6A sites in three species were calculated and compared with random control sample. The control sample was randomly picked for the same number of ACA motifs as the number of observed m6A for 1,000 times. Analyses of conservation score were conducted by using PhastCons scores of human (hg19), mouse (mm10) and rat (rn6) downloaded from UCSC.
Funding
This work was supported by the Ministry of Science and Technology of China (National Science and Technology Major Project, Grant No. 2018YFA0109100), National Science Foundation of China (Grant No. 91753129 and 31870808) and Natural Science Foundation of Guangdong Province (Grant No. 2018B030306044).
Author contributions
Z.Z. C.H. and G.Z.L. conceived the project; Z.Z., L.Q.C. and Y.L.Z. conducted the experiments; Z.Z. analyzed the NGS data; Z.S.Z., I.A.R., C.G.Y., J.R. and W.X. provided the supporting materials and ideas; Z.Z., L.Q.C., C.H. and G.Z.L. wrote the manuscript. All authors reviewed the results and approved the final version of the manuscript.
Competing interests
The authors declare no competing financial interests.
Data and materials availability
Data were deposited in NCBI’s Gene Expression Omnibus (GEO) under accession number GSE125240.


