

Abstract
Preprint usage is growing rapidly in the life sciences; however, questions remain on the relative quality of preprints when compared to published articles. An objective dimension of quality that is readily measurable is completeness of reporting, as transparency can improve the reader’s ability to independently interpret data and reproduce findings. In this observational study, we compared random samples of articles published in bioRxiv and in PubMed-indexed journals in 2016 using a quality of reporting questionnaire. We found that peer-reviewed articles had, on average, higher quality of reporting than preprints, although this difference was small. We found larger differences favoring PubMed in subjective ratings of how clearly titles and abstracts presented the main findings and how easy it was to locate relevant reporting information. Interestingly, an exploratory analysis showed that preprints with figures and legends embedded within text had reporting scores similar to PubMed articles. These differences cannot be directly attributed to peer review or editorial processes, as manuscripts might already differ before submission due to greater uptake of preprints by particular research communities. Nevertheless, our results show that quality of reporting in preprints in the life sciences is within a similar range as that of peer-reviewed articles, albeit slightly lower on average, supporting the idea that preprints should be considered valid scientific contributions. An ongoing second phase of the project is comparing preprints to their own published versions in order to more directly assess the effects of peer review.
Introduction
Editorial peer review refers to the process whereby researchers from relevant fields review scientific articles with the purpose of evaluating their quality and/or adequacy to a publication venue. The debate on the origin of such practice revolves around how one broadens its definition; however, articles have been evaluated by various forms of peer review since the creation of scientific journals (for a broad historical review, see Csiszar, 2016).
Despite the ubiquity of editorial peer review, we have little empirical evidence supporting its effectiveness to ensure article quality (Jefferson et al., 2007). Evaluations limited to individual journals (Goodman et al., 1994; Pierie et al., 1996) have shown that peer review slightly improves reporting of various items, with the greatest improvements observed in the discussion and conclusion sections. Nevertheless, large-scale evaluations of its effect on research quality have not been performed. Moreover, positive effects of peer review in individual journals do not necessarily imply that it will work as an effective filter on a systemic level (Ioannidis et al., 2010).
Additionally, traditional peer review has various drawbacks, including reviewer bias (Mahoney, 1977; Murray et al., 2018), lack of agreement among reviewers (Rothwell and Martyn, 2000; Pier et al., 2018) and vulnerability to various forms of system gaming such as ‘lottery behavior’ by authors (Ioannidis et al., 2010), predatory journals (Bohannon, 2013) and self peer review scams (Retraction Watch - self peer review; Ferguson et al., 2014). Its most often quoted limitation, however, is the time lag for publication of articles (Vale, 2015; Berg et al., 2016; Cobb, 2017) and the resulting delay in the dissemination of scientific findings. Due to its gatekeeping function, editorial peer review has also become associated with other problems of scientific publication, such as paywalls and high prices imposed by commercial publishers. In view of these problems, various initiatives have tried to reform or bypass peer review in order to provide faster and wider access to scientific knowledge.
Preprints are complete manuscripts submitted to publicly accessible repositories, which may or may not later be submitted to a formal scientific journal. Preprint usage is common in communities such as physics and mathematics, particular due to the popularity of arXiv, a seminal preprint server established in 1991 (Ginsparg, 2011). Spurred by the recent creation of new repositories such as bioRxiv and PeerJ, as well as by scientist-driven initiatives to support their use (Berg et al., 2016), biomedical scientists have recently become more adept at the practice (Cobb, 2017). Nevertheless, scientific reward systems still largely rely on formal journal publication, leading to a dissociation of fast knowledge dissemination through preprints from the certification provided by peer review (Cobb, 2017).
Predictably, the main concerns about this model of scientific communication revolve around the quality of non-peer reviewed studies (Vale, 2015; Berg et al., 2016; Calne, 2016). That said, preprints offer a unique opportunity to study the effects of peer review by allowing comparisons between non-reviewed manuscripts with their final published versions. Studies of samples from arXiv and bioRxiv using automated text measures have shown that changes from pre-to post-peer review versions are usually minor (Klein et al., 2018). Nevertheless, to our knowledge, no attempt has been made to evaluate changes in study quality.
Scientific quality has many dimensions, such as rigor in methodological design, novelty and impact of findings, and transparency in their reporting. Evaluating appropriateness of methodology or the significance of results is challenging due to the inherent subjectivity of these judgements and the necessity of area-specific expertise. Transparency and quality of reporting, however, can be assessed more objectively. Reporting guidelines and checklists have been developed in many fields of science to guide authors on the minimum information that a manuscript should include (Simera et al., 2009). Quality of reporting is used to evaluate study quality in meta-analyses (Ryan et al., 2013), as well as the effect of interventions focused on improving transparency (Han et al., 2017; Macleod et al, 2017; Hair et al., 2018). Moreover, it may be the aspect of manuscript quality that is most amenable to improvement by peer review, as reporting issues are relatively simple to detect and fix.
In this study, we aim to compare quality of reporting between preprints and peer-reviewed articles in the life sciences. With this in mind, we compiled a simplified list of essential items that should be reported in different types of biomedical articles, based on existing checklists (Moher et al., 2001; von Elm et al., 2007; Kilkenny et al., 2010; Bossuyt et al., 2015; Macleod et al., 2017; Hair et al., 2018). We then selected random samples of preprints from bioRxiv and peer-reviewed articles from PubMed in order to compare quality of reporting between them.
Methods
Data collection and analysis protocols were preregistered at https://osf.io/tksmx/. Analyses not included in the original plan will be referred to as exploratory throughout the text.
Study selection
We obtained a list of all articles published in PubMed and bioRxiv between January 1st and December 31st, 2016. This date range had to comprise the first version of a preprint or the online publication date for peer-reviewed articles. Random articles were double-screened by the coordinating team (C.F.D.C, V.G.S.Q., T.C.M. or O.B.A.) for the following inclusion criteria: articles should i) be written in English, ii) contain at least one original result, iii) include a statistical comparison between different experimental or observational groups and iv) have groups composed of human or non-human animals, cells, microorganisms or biological samples derived from them. We selected the first result presented in each article that filled these criteria, consisting of a single figure/subpanel or table, which was then used for analysis. Disagreements on inclusion were discussed until consensus was reached.
Articles were categorized according to the biological model (in vitro/cell lines, invertebrates, vertebrates and humans), and the number of articles per category was matched across groups. Thus, each selected study was included in the final sample according to the availability of selected studies in the other group until our planned sample size was reached.
Quality of reporting evaluation
Evaluation of each study was performed through an online questionnaire implemented on Google Forms. Questions were based on existing reporting guidelines (Moher et al., 2001; von Elm et al., 2007; Kilkenny et al., 2010; Bossuyt et al., 2015), journal checklists (Nature, 2013) and previous studies on quality of reporting (Macleod et al., 2017; Hair et al., 2018), and are presented along with their response options on Table S1. They were based on direct, objective criteria, in an attempt to avoid the need for subjective evaluation. Analyzed reporting items included measures to reduce risk of bias (e.g. blinding, conflict of interest reporting), details on reagents (e.g. antibody validation, reagent source), data presentation (e.g. summary and variation measures, identifiable groups, definition of symbols used), data analysis (e.g. statistical tests used, exact p values) and details on the biological model (e.g. culture conditions, animal husbandry, human subject recruitment and eligibility, ethical requirements). As not all of these apply to every article, some questions were category-specific, while others could be answered as ‘not applicable’. A detailed Instructions Manual for answering the questions (available as Supplementary Text 1) was distributed to evaluators to standardize interpretation. Importantly, most questions concerned only the result selected for analysis (i.e. the first table, figure or subpanel fulfilling our inclusion criteria) and not the whole set of results.
Two additional questions regarding evaluators’ subjective assessments were included in the questionnaire, to be answered on a five-point scale. The first asked whether the title and abstract provided a clear idea of the article’s main findings, ranging from “Not clear at all” to “Perfectly clear”. The second one asked whether the information required in the questionnaire was easy to find and extract from the article, ranging from “Very hard” to “Very easy”.
Evaluators were biomedical researchers and students recruited locally at Brazilian universities and online through the ASAPbio blog (Amaral, 2018) and social media. To be included as evaluators, candidates had to reach an agreement of at least 75% in a test set of 4 articles. This comparison was based on the consensus answers of 3 members of the coordinating team (C.F.D.C, T.C.M. and O.B.A.) for 2 sets of 4 articles, reached after extensive discussion over possible disagreements. A candidate who failed to reach the required level of agreement on the first set could try again on the second set after reviewing his own answers and the consensus ones in the first test. After achieving the agreement threshold, evaluators had access to the consensus answers as well as their own on the evaluated set(s).
Each article was assessed independently by three evaluators, and the most prevalent answer among evaluators for each question was considered final. If all three evaluators reached different answers (a possibility arising when more than two response options were available), the question was discussed by the coordinating team until consensus was reached. Agreement between individual pairs of evaluators was calculated as the mean percentage of identical responses between them, including the applicability of questions, for all articles evaluated by both members of the pair.
PDF files were redacted so that evaluators were blinded to the journal, list of authors, their affiliation and funders. However, some of this information could still be inferred from the formatting of the PDF file or from methodological details (such as the ethics committee or place of sample collection). Importantly, article formatting prevented evaluator blinding with respect to experimental group, as most journal articles were typeset in recognizable fashion for publication, a feature that we chose to maintain, as it is a direct consequence of the editorial process.
Data collection
Reporting scores were defined as the percentage of items reported for each article, using the total number of applicable questions – defined both by the biological model category and by the questions rated by the evaluators as not applicable – as the denominator. For some questions, a partial score was assigned for partial reporting, as described in Table S1.
We obtained the impact factor for each journal according to the Journal Citation Reports from the year of online publication (2016). It was unavailable for eight of the journals sampled. Citations for both groups were obtained from Google Scholar on Feb 6th, 2019. For preprints, we combined citations to the preprint with those received by its peer-reviewed version. Region of origin was obtained for each article according to the corresponding author’s affiliation. In the two cases with two corresponding authors from different regions, we assigned the article to the region that had the most authors.
The open-access status of journals was obtained from journal websites. Only fully open-access journals were classified as “open access” – i.e. hybrid subscription-based journals with open access options were classified as “subscription-based”. Journals were classified as “for-profit” or “non-profit” according to information obtained on their websites. “Non-profit” status was assigned to journals maintained by scientific societies or non-profit organizations. If a journal was associated with a scientific society but managed by a commercial publisher, it was classified as “for-profit”. Article size was defined in terms of number of labelled figure subpanels in the main text, as we considered this to be more related to the amount of data presented in an article than text length measures. The presence of supplementary material and its size (also defined as labelled figure subpanels) were also assessed as separate measures. Preprints were further classified according to the position of its figures in the PDF file, which could be presented embedded in the text or separately in the end.
Subject area of preprints was obtained from bioRxiv based on the repository’s prespecified categories. In the only article listing two areas, the first one was considered. For PubMed articles, two researchers (C.F.C.D. and O.B.A.) independently assigned the article to one of the subject areas from bioRxiv’s classification. Disagreements were solved by discussion until consensus was reached. Articles that were not adequately described by any of the listed categories were classified as “other”.
Outcome measures
Our primary outcome was the comparison of the overall score (i.e. the aggregate percentage of items reported for the whole questionnaire) between the bioRxiv and PubMed groups. Planned secondary outcomes included comparisons of category-specific questions (specific scores), of questions applicable to all categories (general score) and of the mean score for the two subjective questions (how clearly titles and abstracts presented the main findings and how easy it was to locate relevant reporting information). Other planned secondary outcomes were correlations between the overall score with region of origin, article size and journal impact factor (for PubMed only). For correlations between databases and categoric variables, the group (PubMed or bioRxiv) was used as a second independent variable and the interaction between variables was analyzed.
All other outcomes presented here were not preregistered and should be interpreted as exploratory. Namely, we compared mean evaluator agreement between groups (PubMed and bioRxiv) and assessed bias among evaluators by an interaction analysis. Additionally, correlations between the overall reporting score with subjective assessments, presence and size of supplementary material, commercial and open access status of publisher and number of citations were performed. Furthermore, we also explored differences between preprints with figures embedded or not within the text by comparing these groups’ overall reporting scores and subjective assessments.
Sample size calculation
Sample size was calculated to detect a difference of at least 10% between groups in the primary outcome with 90% power at α=0.05, based on the coefficients of variation for the reporting scores obtained from a blind pilot analysis of the first 10 articles in each group, which had mean values (± S.D.) of 67.9 ± 10.6 for PubMed and 65.0 ± 13.1 for bioRxiv. This resulted in a calculated sample size of 76 articles per group, with each evaluator analyzing between 25 and 32 articles.
Statistical analysis
The complete dataset obtained is provided as Supplementary File 1. All analyses were performed using R (v. 3.5) and the analysis script is available as Supplementary File 2. Data is presented throughout text as mean ± standard deviation. Lines in graphs always represent mean values.
All comparisons between two groups were performed using Student’s t test. Interactions between categoric variables were analyzed using 2-way ANOVA (bias assessment, region of origin and presence of supplementary material). Correlations between quantitative variables were assessed by Spearman’s (number of main and supplementary figures, impact factor and citations) or Pearson’s (subjective assessments) coefficients. The primary outcome was interpreted considering α=0.05. To account for multiple comparisons, we considered Sidak’s α correction for 15 comparisons (α adjusted=0.003) and for 4 correlations (α adjusted=0.013) for secondary analyses, excluding the preregistered primary outcome and exploratory analyses. Non-planned analyses were considered exploratory: thus, although we present p values for these analyses, we refrain from considering any of them as ‘significant’.
Results
Article features
Adoption of preprints has been variable across different disciplines within the life sciences (Abdill and Blekhman, 2019). This can be clearly observed in our sample (Table 1), as Neuroscience articles account for almost half of our bioRxiv sample, while prevalent areas in the PubMed group such as clinical sciences and pharmacology are underrepresented among preprints. There are also regional differences in uptake, with preprints more commonly coming from North America and Europe than from other regions (Table 1). Differences in the animal species used seem to be minor, as the vast majority of studies used rodents in both groups, although bioRxiv articles used mice more frequently than rats, while the opposite was seen in PubMed (Table 1).
Sample description. Number of articles in each group by geographic region, main subject areas and animal species used. Only the most prevalent areas and animal models for both databases are shown here – complete data is available in Table S2.
Agreement between evaluators
15 out of 23 candidates reached criteria to be included as evaluators in the study. Agreement between evaluators after completion of data collection was above the test threshold for all pairs (Table S3), with an overall agreement of 79.9%. Virtually no difference was found between mean agreement for bioRxiv and PubMed articles (79.3 ± 5.9 vs. 81.1 ± 6.8, respectively; Student’s t test, t=-1.73, p=0.09, n=72/group). There was also no evidence of group bias by individual evaluators, as measured by interaction between evaluator identity and group in overall scores (Table S4); 2-way ANOVA; Group: F=17.75, df=1, p=3.1×10⁻⁵; Evaluator: F=1.60, df=14, p=0.08; Interaction: F=1.16, df=14, p=0.30.
Overall reporting score
As defined in our preregistered protocol, the overall score comparison between bioRxiv and PubMed was the primary outcome in this study. As shown in Figure 1, there was a small difference between scores favoring peer-reviewed articles (67.3 ± 12.4 vs. 72.5 ± 10.1, Student’s t test, t=-2.84, p=0.005). Importantly, as this comparison is observational in nature, it cannot be directly attributed to an effect of peer review. Thus, we performed secondary analyses to inquire whether the difference could be explained by particular study features in each group.

Overall reporting scores for bioRxiv and PubMed articles. Student’s t test, t=-2.84, p=0.005, n=76/group. Y axis refers to the percentage of applicable items that were reported in the study. Absolute difference between means [95% CI] is 5.2 [1.6 – 8.9].
Reporting scores by category
As secondary outcomes, we compared the overall reporting scores for each article category, as well as those for the general and specific parts of the questionnaire (e.g. in vitro, invertebrate, vertebrate and human studies). As shown on Table 2, the small difference favoring PubMed articles was largely consistent across categories. In an exploratory analysis, we also looked at the individual sections that compose the general score (Table S5), in which larger differences were found in the drugs and reagents section (63.0 ± 38.8 in bioRxiv vs. 79.4 ± 29.6 in PubMed, Student’s t test, t=-1.97, p=0.05).
Scores by article category and questionnaire section. Sample sizes are per group and p values refer to Student’s t test for each comparison. Considering Sidak’s correction for multiple comparisons, none of the individual differences are significant; however, sample sizes are much smaller than for the primary analysis.
When analyzing the reporting of individual questions, the largest differences observed in favor of peer-reviewed articles were in items concerning reagents (i.e. drug suppliers and antibody validation) and experimental animals (i.e. reporting of strain, sex, supplier and randomization). Conversely, features such as reporting of unit-level data, completeness of statistical results and exact p-values were more frequent in bioRxiv articles (Table S6).
Correlations between region of origin, article size and impact metrics with reporting score
Region of origin was initially classified in 6 categories (Africa, Asia, Europe, Latin America, North America and Oceania); however, due to the small sample size in some regions, we combined Africa, Latin America and Oceania into a single category (Other) for analysis (Figure 2A). We did not find an effect of region on quality scores (p=0.81, F=0.72, df=3, 2-way ANOVA) or a significant interaction of region with the difference between PubMed and bioRxiv scores (p=0.08, F=2.66, df=3 for interaction, 2-way ANOVA).

(A) Reporting score by region of origin. Two-way ANOVA, pGroup=0.004 (F=8.31, Df=1), pRegion=0.54 (F=0.72, Df=3), pInteraction=0.05 (F=2.66, Df=3). (B) Overall reporting score and number of subpanels in main text. All articles, ρ=-0.30, p=0.0001; bioRxiv, ρ=-0.34, p=0.003; PubMed, ρ=-0.22, p=0.05. N=152 (76/group). (C) Correlation between reporting score and impact factor. ρ=-0.07, p=0.52 (n=68). In all panels, bioRxiv articles are in red and PubMed ones are in blue.
To test whether differences in article length could account for group differences in reporting scores, we looked for a correlation between the number of subpanels in articles and their reporting score. We found a negative correlation for the aggregate of articles (ρ=-0.30, p=10-4), mostly led by the correlation in the bioRxiv sample (ρ=-0.34, p=0.003), while the PubMed one showed a weaker correlation (ρ=-0.22, p=0.05; Figure 2B). As exploratory analyses, we also tested for correlations between the presence of supplementary material (Figure S1A) or number of supplementary figure subpanels (Figure S1B) with overall reporting scores. No interaction between reporting score and either variable was found (presence of supplementary material: p=0.38, F=0.77, df=1 for interaction, 2-way ANOVA; number of subpanels: ρ=- 0.20, p=0.13 for all articles, Spearman’s correlation). An interesting finding, however, is that preprints contained supplementary data more frequently and had more subpanels on average than peer-reviewed articles (Figure S1B).
Mean (± S.D.) impact factor for PubMed articles was 3.3 ± 2.1, ranging from 0.5 to 14.9, and showed no correlation with the overall reporting score (ρ=-0.07, p=0.52; Figure 2C). There was also no correlation of reporting score with the commercial status of the publisher (p=0.47, Student’s t test) or with open access status of the journal (p=0.76, Student’s t test) (Figures S2A and S2B). The correlation between number of citations and reporting scores was also analyzed for each group separately as an exploratory analysis (Figure S2C), with no clear correlation found in either group (PubMed: ρ=0.03, p=0.78; bioRxiv: ρ=0.12, p=0.29).
Subjective assessment
As described in the Methods section, evaluators answered two subjective questions concerning the clarity of the title and abstract and the easiness to extract information for the objective part of the questionnaire. In both of these comparisons, we found differences favoring PubMed that were larger than that observed in reporting scores (Figures 3A and 3B): abstract clarity had a difference [95% CI] of 0.4 [0.2 – 0.6] (t=-3.61, p=4×10⁻⁴) and easiness to locate information had a difference of 0.7 [0.5 – 1.0] (t=-6.22, p=5×10⁻⁹) in a 5-point scale.
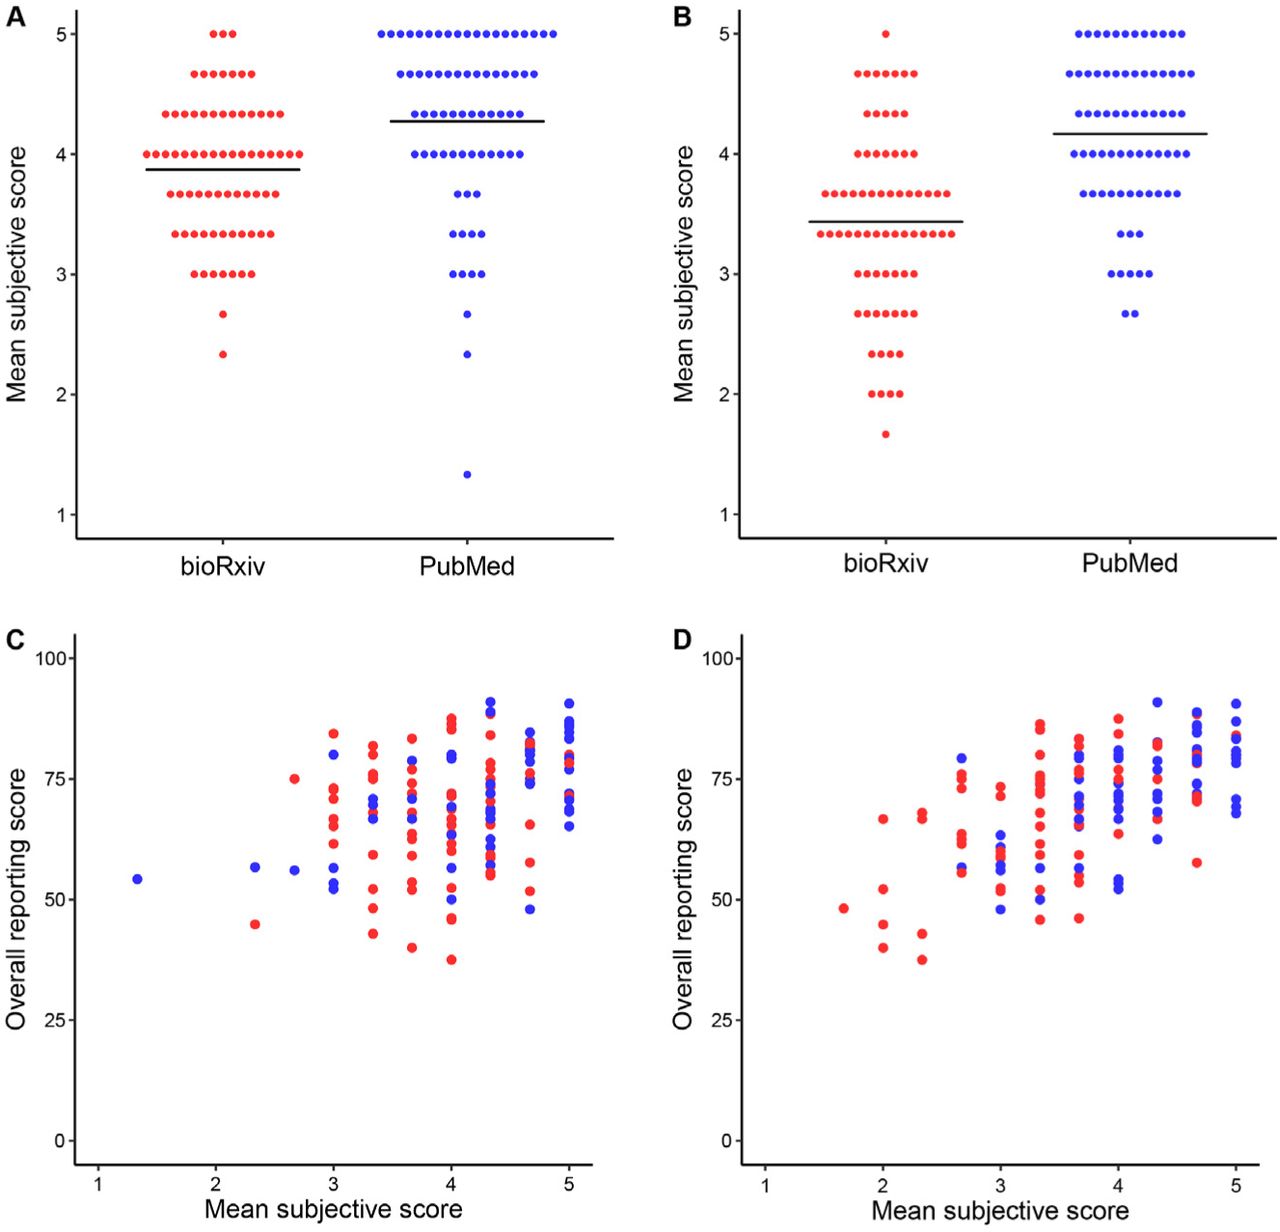
(A) Scores were given as an answer to “Do the title and abstract provide a clear idea of the article’s main findings?”. Mean score (± S.D.) is 3.9 ± 0.6 for bioRxiv and 4.3 ± 0.7 for PubMed (Student’s t test, t=-3.61, p = 4×10⁻⁴, n=72/ group). (B) Scores were given as an answer to “Was the required information easy to find and extract from the article?”. Mean score (± S.D.) is 3.4 ± 0.8 for bioRxiv and 4.2 ± 0.6 for PubMed (Student’s t test, t=-6.22, p = 5×10⁻⁹, n=72/group). (C) Title and abstract clarity vs. reporting scores. r=0.39, p=1.6×10⁻⁶, n=144 (all articles); r=0.14, p=0.22, n=72 (bioRxiv); r=0.55, p=5.1×10⁻⁷, n=72 (PubMed). (D) Easiness to extract information vs. reporting scores. r=0.59, p=9.7×10⁻¹⁵, n=144 (all articles); r=0.54, p=8×10⁻⁷, n=72 (bioRxiv); r=0.59, p=5.6×10⁻⁸, n=72 (PubMed). In all panels, bioRxiv articles are in red and PubMed ones are in blue.
Based on the latter result, we questioned whether easiness to extract information could account for the difference observed in our primary outcome. To test this, we performed an exploratory correlation analysis between the two subjective questions and the overall reporting score for each group. These analyses showed a moderate correlation of reporting scores with clearness of title and abstract among PubMed articles (Figure 3C) and a strong correlation of reporting scores with easiness to extract information in both groups (Figure 3D).
Correlations between formatting and reporting score
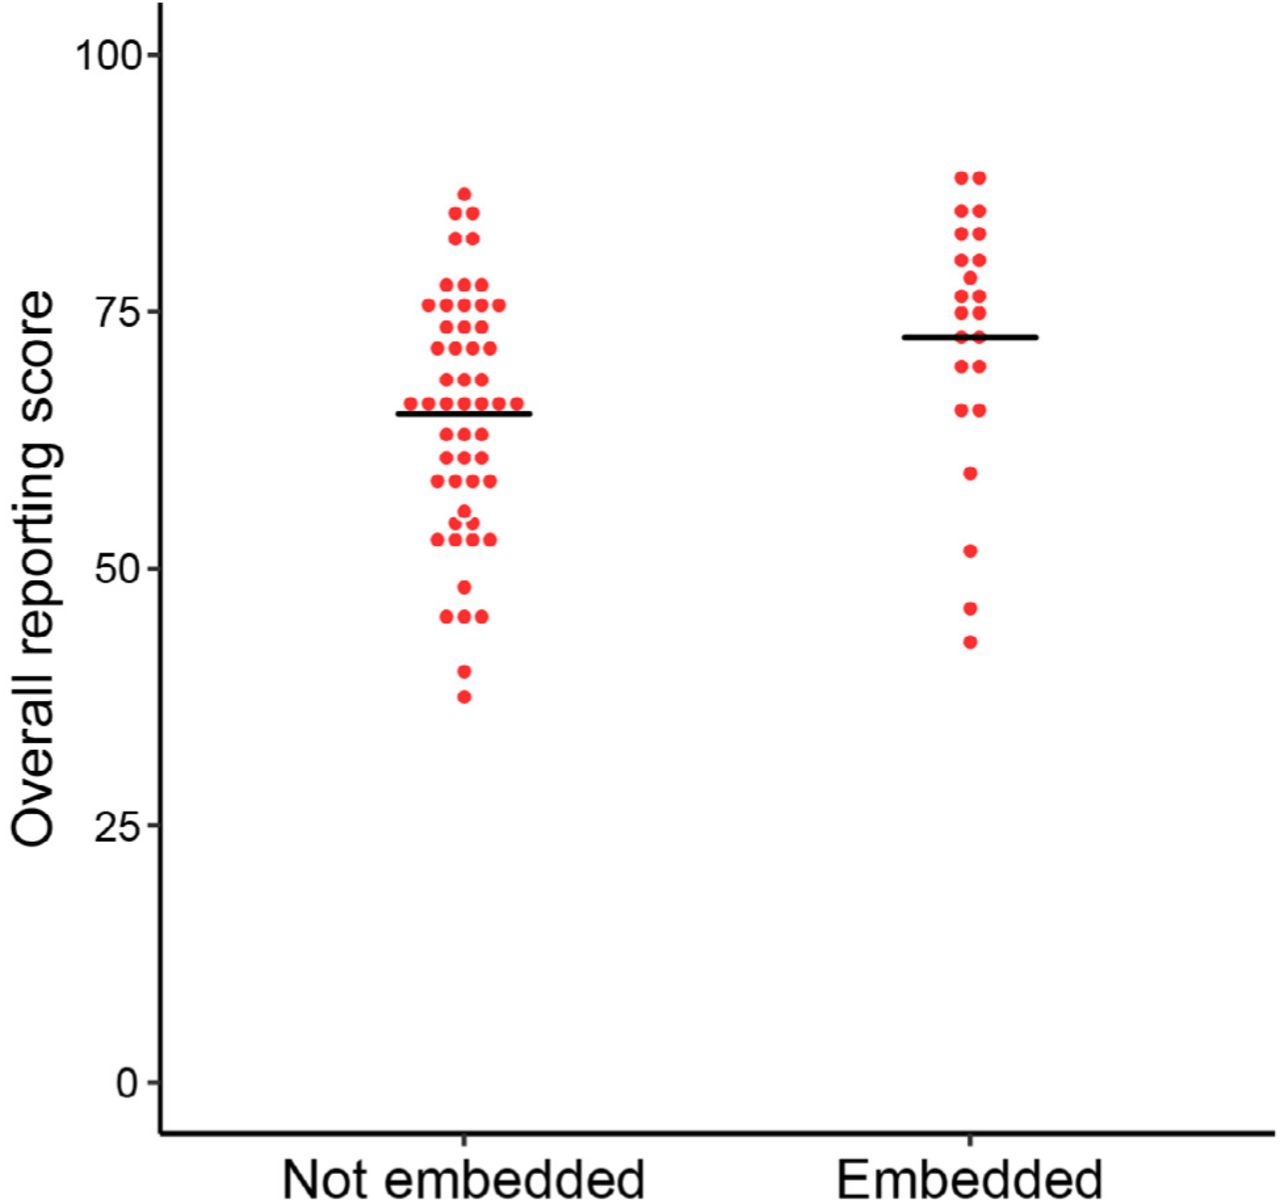
Based on these correlations, we inquired whether differences in article formatting could account for the differences in subjective assessment and reporting scores. As an exploratory way to assess this, we compared bioRxiv papers with figures presented at the end of the article with those with figures embedded in the text, which tend to be closer to the way data is presented in peer-reviewed articles (Figure 4). We found a small difference in reporting scores favoring the embedded group (72.5 ± 12.6 vs. 65.0 ± 11.8, Student’s t test, t=-2.48, p=0.01) whose magnitude was similar to that between bioRxiv and PubMed articles. Nevertheless, there was no association of embedding with the subjective assessments of title and abstract (3.9 ± 0.6 (not embedded) vs. 3.8 ± 0.6 (embedded), Student’s t test, t=0.58, p=0.56, Figure S3A) or easiness to extract information (3.3 ± 0.8 (not embedded) vs. 3.6 ± 0.6 (embedded), Student’s t test, t=-1.43, p=0.16, Figure S3B).

Overall reporting scores and article formatting. Preprints were classified according to the position in which figures were presented, either embedded in text or not. Student’s t test, t=-2.48, p=0.01 (nNot=49, nEmbedded=23).
Discussion
In this study we present a comparison of quality of reporting between articles found in the two major databases for preprints and peer-reviewed articles in the life sciences: bioRxiv and PubMed. Peer-reviewed articles had significantly better reporting scores in our sample, although the observed difference was small and variation ranges were similar between groups. As this is an observational study, this difference cannot be directly attributed to effects of peer review, since it could also stem from potential confounders, such as differences in the scientific communities represented within each database. Thus, the typical manuscript submitted to a PubMed journal may not be comparable to the typical article found on bioRxiv even before peer review occurs.
Such preexisting differences seem likely given the vastly different distribution of scientific fields in both databases. 2016 marked the beginning of bioRxiv’s rapid growth, and uptake by different communities within the life sciences has not been uniform (Anaya, 2016; Inglis and Sever, 2016; Abdill and Blekhman, 2019). Our sample does not faithfully reflect the server’s distribution of subject areas (Abdill and Blekhman, 2019) because of the limitations imposed by our inclusion criteria, which required the use of biological models. Still, major differences can be observed between included articles in this sample and those in the PubMed one. This difference could be due to the early adoption of preprints through arXiv by scientists working on evolution and neuroscience (Anaya, 2016), as well as to concerns about the ethical consequences of preprints among clinical researchers (Lauer et al., 2015; Tabor, 2016). The regional distribution of articles in both groups also seems to differ in our sample, with a greater uptake of preprints in North America and Europe than in the rest of the world.
Subjective ratings of how clearly titles and abstracts presented the main findings and how easy it was to locate relevant reporting information showed more robust differences favoring PubMed. This could indicate that there are important differences between articles in both groups that were not assessed by our questionnaire, which focused on objective reporting features. Moreover, the questionnaire was developed mostly with basic experimental research in mind; thus, it might be less applicable for specific types of articles such as genomics, neuroimaging and electrophysiology articles with complex datasets, which were more frequently found in the bioRxiv sample. Additionally, the use of the first table or figure for analysis meant that, especially in clinical articles, which typically start with a description of the study sample, the data under study were not always the main findings of the article.
Even though we developed the questionnaire and manual to be as objective as possible, some items still required appropriate expertise or subjective assessment for correct interpretation. As most of our evaluators work in laboratory science, articles from other fields might have presented added difficulties. Although our high inter-rater agreement suggests that precision was reasonable, crowdsourced efforts such as these inevitably lead to some heterogeneity between evaluators. On the positive side, they also dilute individual biases, a particular concern in our case as evaluators were not blinded to the group of origin. Although blinding would have reduced risk of bias, it would have required removing article formatting, which is arguably a contribution of the editorial process, and could have introduced errors in the process. Nevertheless, the relative homogeneity of the effect across different evaluators suggest that assessment bias was at most a minor issue.
Concerning formatting, the structure of preprints was more variable than that of PubMed articles, as bioRxiv does not impose any particular style; thus, most preprints presented figures and/or legends separately from the description of results in the text. In an exploratory analysis of this variable, we found that articles with embedded figures had a mean reporting score similar to that of PubMed articles (72.5 ± 12.6 and 72.5 ± 10.1, respectively). Although this comparison is also observational and exploratory, with unbalanced sample sizes between groups, embedding figures within the text of preprints seems like a sensible and simple recommendation that could conceivably improve information retrieval from articles.
To our knowledge, this is the first study to compare a dimension of article quality between preprints and peer-reviewed articles. Previous studies in specific journals have found small positive differences brought about by peer review, which were most evident in the results and discussion sections (Goodman et al., 1994; Pierie et al., 1996). In our sample, we found better reporting of materials and biological models in peer-reviewed articles. On the other hand, the opposite pattern was observed for statistical reporting, with preprints presenting more exact and complete statistical results, although the difference was small. As it seems unlikely that peer review would worsen reporting of results, this is more likely to be either a consequence of practices in specific scientific communities or a chance finding. Concerning risk of bias measures, we found better reporting on bioRxiv for sample size calculation (9.2% vs. 2.6%), on PubMed for randomization (30.8% vs. 5.5%), and similar numbers for blinded assessment of outcomes (5.2% in PubMed vs. 4.1% in bioRxiv), but proportions are smaller than those reported in the preclinical literature using animal models (Macleod et al., 2015).
Given the small differences found in quality of reporting, we may conclude that articles posted as preprints on bioRxiv are generally similar to peer-reviewed articles indexed on PubMed in terms of quality of reporting; nevertheless, there is on average a small difference favoring peer-reviewed articles. While this difference could be a consequence of peer review, it could also reflect preexisting differences between articles from different scientific communities. To assess the effects of peer review more directly, we are currently comparing the preprints included in this study with their own published versions. At present, our results suggest that quality of reporting among preprints is within a comparable range to that of peer-reviewed articles, supporting their validity as scientific contributions as a way to make science communication more agile, open and accessible.
Conflicts of interest
O.B.A. is a voluntary ambassador for ASAPbio, a scientist-driven non-profit promoting transparency and innovation in life science communication.
Funding information
This work was supported by a FAPERJ (Fundação de Amparo à Pesquisa do Estado do Rio de Janeiro) grant to O.B.A. C.F.D.C. and T.C.M. received scholarships from CNPq (Conselho Nacional de Desenvolvimento Científico e Tecnológico).
Author contributions
C.F.D.C., T.C.M and O.B.A. designed the study. C.F.D.C. and V.G.S.Q. coordinated data collection. C.F.D.C., T.C.M, V.G.S.Q. and O.B.A. screened articles for inclusion. C.A.M.C., C.B.H., D.R., D.E.H., E.A.D-S., F.E., F.Z.B., G.D.G., I.R.C., K.L.H., M.M., P.B.T., S.J.B., S.F.S.G. and V.T.B. collected data. C.F.D.C. and O.B.A. wrote the manuscript. All authors critically revised the manuscript and approved the final version.
References


