

Abstract
In mammalian cells, widespread acceleration of cytoplasmic mRNA degradation is linked to impaired RNA polymerase II (Pol II) transcription. This mRNA decay-induced transcriptional repression occurs during infection with gammaherpesviruses including Kaposi’s sarcoma-associated herpesvirus (KSHV) and murine gammaherpesvirus 68 (MHV68), which encode an mRNA endonuclease that initiates widespread RNA decay. Here, we show that MHV68-induced mRNA decay leads to a genome-wide reduction of Pol II occupancy at mammalian promoters, which requires the cellular 5’-3’ exonuclease Xrn1. Viral genes, despite the fact that they require Pol II for transcription, escape this transcriptional repression. Protection is not governed by viral promoter sequences; instead, location on the viral genome is both necessary and sufficient to escape the transcriptional repression effects of mRNA decay. We hypothesize that the ability to escape from transcriptional repression is linked to the conformation of viral DNA in replication compartments, providing a means for these viruses to counteract decay-induced viral transcript loss.
Introduction
Regulating messenger RNA (mRNA) abundance is of central importance during both cellular homeostasis and disease. While it is intuitive that transcriptional changes in the nucleus impact RNA levels in the cytoplasm, evidence in both yeast and mammalian cells now indicates that the converse is also true: altered cytoplasmic mRNA decay rates can broadly impact transcription by RNA polymerase II (Pol II). In yeast, stabilizing the cytoplasmic mRNA pool by removing mRNA decay factors such as Xrn1 causes a compensatory decrease in Pol II transcription (Sun et al. 2012; Haimovich et al. 2013; Shalem et al. 2008; Shalem et al. 2011; Dori-Bachash et al. 2012)Furthermore, reducing or slowing Pol II transcription leads to an increase in overall mRNA stability (Sun et al. 2012) supporting a “buffering” model in which yeast compensate for widespread perturbations to mRNA abundance by alternatively changing rates of decay or transcription.
Broad changes in mRNA abundance are often triggered in mammalian cells during viral infection. Numerous viruses, including alphaherpesviruses, gammaherpesviruses, SARS coronavirus and influenza A virus drive accelerated mRNA decay during infection by expressing mRNA specific endoribonucleases and/or activating host nucleases. This decay contributes to viral immune evasion, increases the availability of translation machinery, and facilitates temporal viral gene regulation (Richner et al. 2011; Liu et al. 2013; Parrish & Moss 2006; Shiflett & Read 2013; Dauber et al. 2011). Viral endonucleases target host and viral mRNAs for cleavage, whereupon cellular exonucleases degrade the resulting mRNA fragments (Karr & Read 1999; Glaunsinger et al. 2005; Huang et al. 2011; Kamitani et al. 2009; Jagger et al. 2012). This strategy accelerates basal RNA decay by circumventing the typically rate limiting steps of deadenylation and decapping (Covarrubias et al. 2011; Gaglia et al. 2012; Eckmann et al. 2010; Gallouzi & Wilusz 2013; Schoenberg & Maquat 2012).
Although yeast and mammals share key proteins involved in cytoplasmic mRNA decay and transcription, studies with RNA-decay inducing viruses in mammals have revealed that unlike the yeast pathway, accelerated mRNA decay leads to an extensive shutoff of cellular gene expression (Abernathy & Glaunsinger 2015; Gilbertson et al., 2018). Infection with the gammaherpesviruses KSHV or MHV68 causes reduced Pol II recruitment at host promoters in a manner dependent on mRNA cleavage by the viral endonucleases SOX or muSOX, respectively. Thus, accelerated mRNA decay is not broadly counteracted by increased transcription-based repopulation, but instead leads to a more extensive shutdown of cellular gene expression. However, similar to yeast, the mammalian connection between decay and transcription requires the activity of cellular exonucleases such as Xrn1, which degrade the viral endonuclease cleavage products (Abernathy et al. 2015; Covarrubias et al. 2011). Pol II repression requires exonucleolytic degradation of the mRNA cleavage fragments, as the initial endonucleolytic mRNA cleavage without further fragment degradation is insufficient to activate this signaling(Abernathy et al. 2015). Accelerated Xrn1-mediated degradation causes trafficking of released RNA binding proteins (RBP) from the cytoplasm to the nucleus, which may provide a means for the cell to detect and respond to increased RNA turnover (Gilbertson et al., 2018).
During MHV68 infection, in addition to host mRNA, cytoplasmic viral mRNA is susceptible to cleavage by muSOX (Abernathy et al. 2014). However, measurements of nascent transcript production from a subset of viral promoters suggested that viral genes are robustly transcribed during the stage of infection when host transcription is reduced (Abernathy et al. 2015). A major outstanding question is how these viral promoters escape mRNA decay-induced transcriptional repression despite being transcribed by RNA Pol II. Here, we measured Pol II occupancy across the mouse and MHV68 genomes in infected cells to more comprehensively define how accelerated mRNA decay impacts polymerase occupancy. Our data demonstrate a genome-wide reduction in Pol II recruitment at host promoters under conditions of increased mRNA decay, and underscore a key role for Xrn1 in this process. In contrast, Pol II occupancy of the viral genome appears broadly resistant to the effects of mRNA degradation. This protection is not conferred by viral promoter sequences; instead, location on the replicating viral genome is both necessary and sufficient to escape the transcriptional effects of mRNA decay. We propose a model in which DNA amplified in viral replication compartments, unlike the cellular chromatin, is immune to transcriptional repression during accelerated cytoplasmic mRNA decay. Thus, while both viral and cellular mRNA pools are susceptible to cytoplasmic degradation, transcriptional repopulation selectively counteracts this loss for viral genes.
Results
Accelerated RNA decay broadly reduces Pol II occupancy
We previously reported that Pol II occupancy at several individual mammalian promoters was significantly reduced during accelerated cytoplasmic mRNA decay(Abernathy et al. 2015; Gilbertson et al., 2018.). To more comprehensively assess the extent of mRNA decay-induced transcriptional repression, we evaluated global Pol II occupancy by chromatin immunoprecipitation and deep sequencing (ChIP seq) in mock versus MHV68 infected MC57G mouse fibroblasts at 24 hours post infection (hpi). As a control, we also infected cells with a version of MHV68 containing the point mutation R443I in the viral muSOX endonuclease gene, which reduces its mRNA cleavage activity (Richner et al. 2011). MHV68-infected cells displayed less promoter-proximal Pol II at 86 percent of loci compared to mock-infected cells, averaged across two biological replicates (Fig 1A, Suppl Fig 1A). Loss of Pol II occupancy was primarily due to muSOX-induced mRNA decay, as promoter-proximal Pol ll recovered at 67 percent of these loci during infection with R443I MHV68 (Fig 1A, Supp Fig1A). Sixty-three genes, or 1.3 percent of loci, showed higher Pol II occupancy in WT infection as compared to mock infection, although these did not share any common GO terms (Supp Table 1). We independently validated the ChIPseq results by ChIP-qPCR at the Rplp0 and Fus promoters, both of which showed a significant reduction of Pol II occupancy in cells infected with WT but not R443I MHV68 (Fig. 1B). The genome-wide reduction in poised Pol II in WT but not R443I infected cells was also evident when the sequencing reads from positions −2000 to +4000 around the transcription start sites (TSS) were plotted as a histogram (Fig 1C, Supp Fig 1B). The variability between replicates in R443I recovery is likely due to differences in the extent of host shutoff reduction between replicates (Supp Figure 1C).

A) Pol II ChIP-seq signal profiles of host genes are shown in mock-infected, MHV68-infected and R443I-infected cells. Each row of the heat map displays Pol II occupancy of one gene from - 1000 to +1000 in 25bp bins. Genes are ranked by the Pol II-transcription start site (TSS) proximal signal in mock infected cells. (B) Sequence tags were binned into 25-bp bins for −2000 to +4000 around the TSS. Mock, MHV68 (red) and MHV68 (blue) and R443I (green) traces are shown along with their input controls. (C) Pol II ChIP-seq coverage across the Srsf2 gene for ChIP-seq replicate 1 and 2 with mock, WT MHV68 and R443I shown. Alignment files were converted to the tiled data file (tdf) format and visualized in the Integrative Genome Viewer. (D) Pol II transcription termination is not dependent on RNA decay. Sequence tags were binned into 25-bp bins for transcription termination sequence (TTS) proximal Pol II for −1000 to +1000 bp around the TTS with the same color scheme as (B).

(A) Pol II ChIP-seq signal profiles of host genes in mock-infected, MHV68-infected and R443I-infected cells. Each row of the heat map displays Pol II occupancy of one gene from −1000 to +1000 in 25bp bins. Genes are ranked by the Pol II-transcription start site (TSS) proximal signal in mock infected cells. (B) ChIP-qPCR validation of Pol II occupancy at the Rplp0 and Fus promoters. Pol II ChIP was performed on mock, MHV68 WT or MHV68 R443I cells and Pol II levels were assayed near the TSS of two repressed host genes during MHV68 infection from the ChIP-seq data. (* p < 0.05, ** p < 0.01, students t-test) (C) Sequence tags were binned into 25-bp bins for −2000 to +4000 around the TSS. Mock (red), MHV68 (blue) and MHV68 R443I (green) traces are shown along with their input controls. (D) Scatterplot of Pol II occupancy of promoters and gene bodies, averaged across two replicate experiments with inputs subtracted out. Mock is compared to WT MHV68 infection on the left and to MHV68 R443I infection on the right. Linear regression lines are plotted in blue and equations are provided. A y=x line is plotted for reference in red. (E) Pol II transcription termination is not dependent on RNA decay. Sequence tags were binned into 25-bp bins for transcription termination sequence (TTS) proximal Pol II for −1000 to +1000 around the TTS with the same color scheme as (C).
To assess the stage of transcription impacted by RNA decay, we compared the amount of Pol II in promoter regions (−50 to +200) and the amount of Pol II in gene bodies (+200 to +5000) between mock and infected samples. Consistent with the above analyses, MHV68 infected cells contained markedly less promoter proximal Pol II than uninfected cells, and this signal was partially recovered in the R443I infection (Fig 1D). Genes with impaired Pol II promoter binding during MHV68 infection also had less Pol II within the gene body compared to mock infected cells, which again was not observed during R443I infection (Fig 1D). Notably, the difference in regression line slopes between MHV68 and mock infected cells was clearly more marked when comparing Pol II promoter occupancy than gene body occupancy, suggesting that the primary transcriptional defect is at the stage of initiation. This is consistent with data from previous studies that found no defect in serine 2 phosphorylation of elongating Pol II and no consistent change to Pol II elongation during MHV68 infection (Abernathy et al. 2015; Gilbertson et al. 2018.).
Finally, to assess if RNA decay affected transcription termination, we binned sequencing reads between 1kb upstream and 1kb downstream of the transcription termination site (TTS) (Fig 1E, Supp Fig 1D). TTS-proximal Pol II shows no defect in termination in either infection condition, suggesting Pol II removal from host transcripts is not impacted by MHV68 infection or by RNA decay.
Pol II Loss is dependent on Xrn1
Our previous work implicated the catalytic activity of the host 5’-3’ exoribonuclease Xrn1 as necessary for the RNA-decay dependent loss of Pol II at several individual host genes (Abernathy et al. 2015). To determine the extent to which mRNA decay-induced Pol II repression is dependent on Xrn1, we measured Pol II occupancy by ChIPseq in mock and MHV68 infected cells upon depletion of Xrn1 using siRNA (Fig 2A). Remarkably, knockdown of Xrn1 resulted in a near complete recovery of Pol II promoter occupancy in MC57G cells infected with WT MHV68 (Fig 2B, Supp Fig 2A). We validated these findings using independent biological replicates at Rplp0 and Fus by ChIP qPCR (Fig 2C). On a gene-by-gene basis, we observed similar levels of Pol II at promoters in mock and infected cells depleted of Xrn1 (Fig 2D, Supp Fig 2B). Fig 2E shows representative Pol II occupancy of Srsf2 during knockdown conditions. Similarly, comparing the amount of Pol II in gene bodies and at TTS of Xrn1-depleted cells (as described in Fig 1) showed little difference between mock and MHV68 infected conditions (Figs 2F, 2G, Supp Fig 2C). Together, these data highlight the essentiality of Xrn1 for the genome-wide repression of Pol II occupancy during virus-induced mRNA decay.
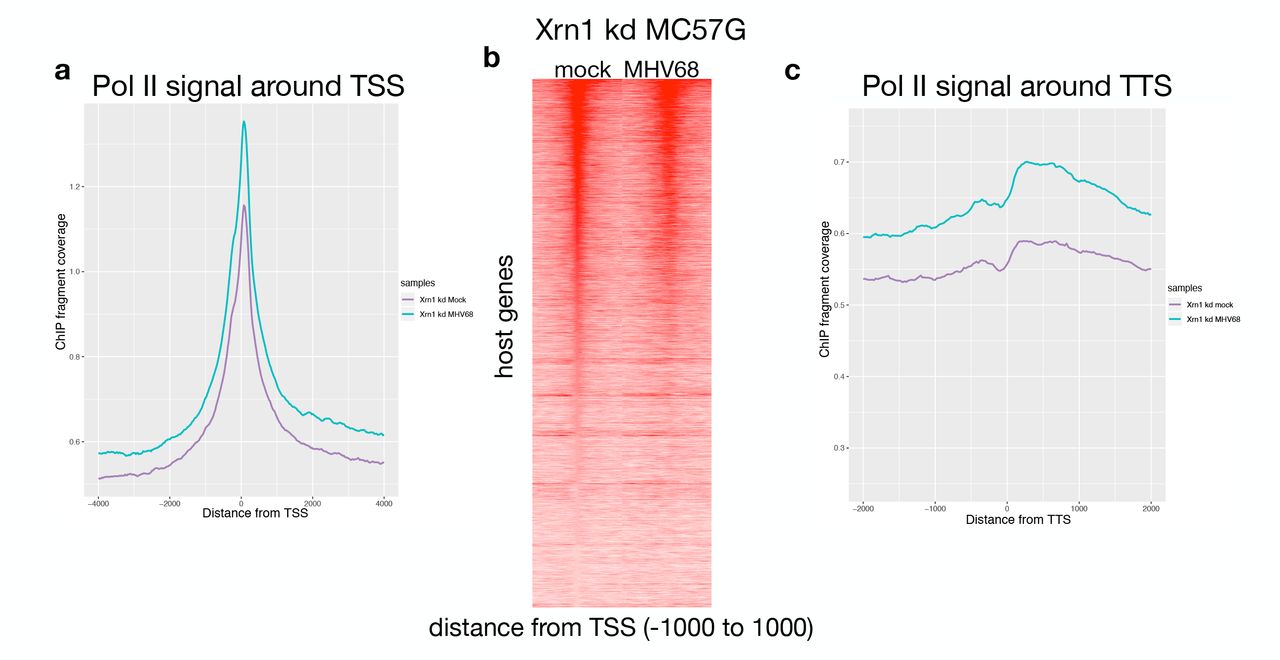
(A) Sequence tags were binned into 25-bp bins for −4000 to +4000 around the transcription start site (TSS) in mock (purple) and MHV68 infected (green) Xrn1 kd samples for Pol II ChIPs. (B) Pol II ChIP-seq signal profiles of host genes in mock and MHV68-infected cells depleted of Xrn1. Each row of the heat map displays Pol II occupancy of one gene from −1000 to +1000 in 25 bp bins. (C) Sequence tags were binned into 25-bp bins for transcription termination sequence (TTS) proximal Pol II for −1000 to +1000 bp around the TTS.
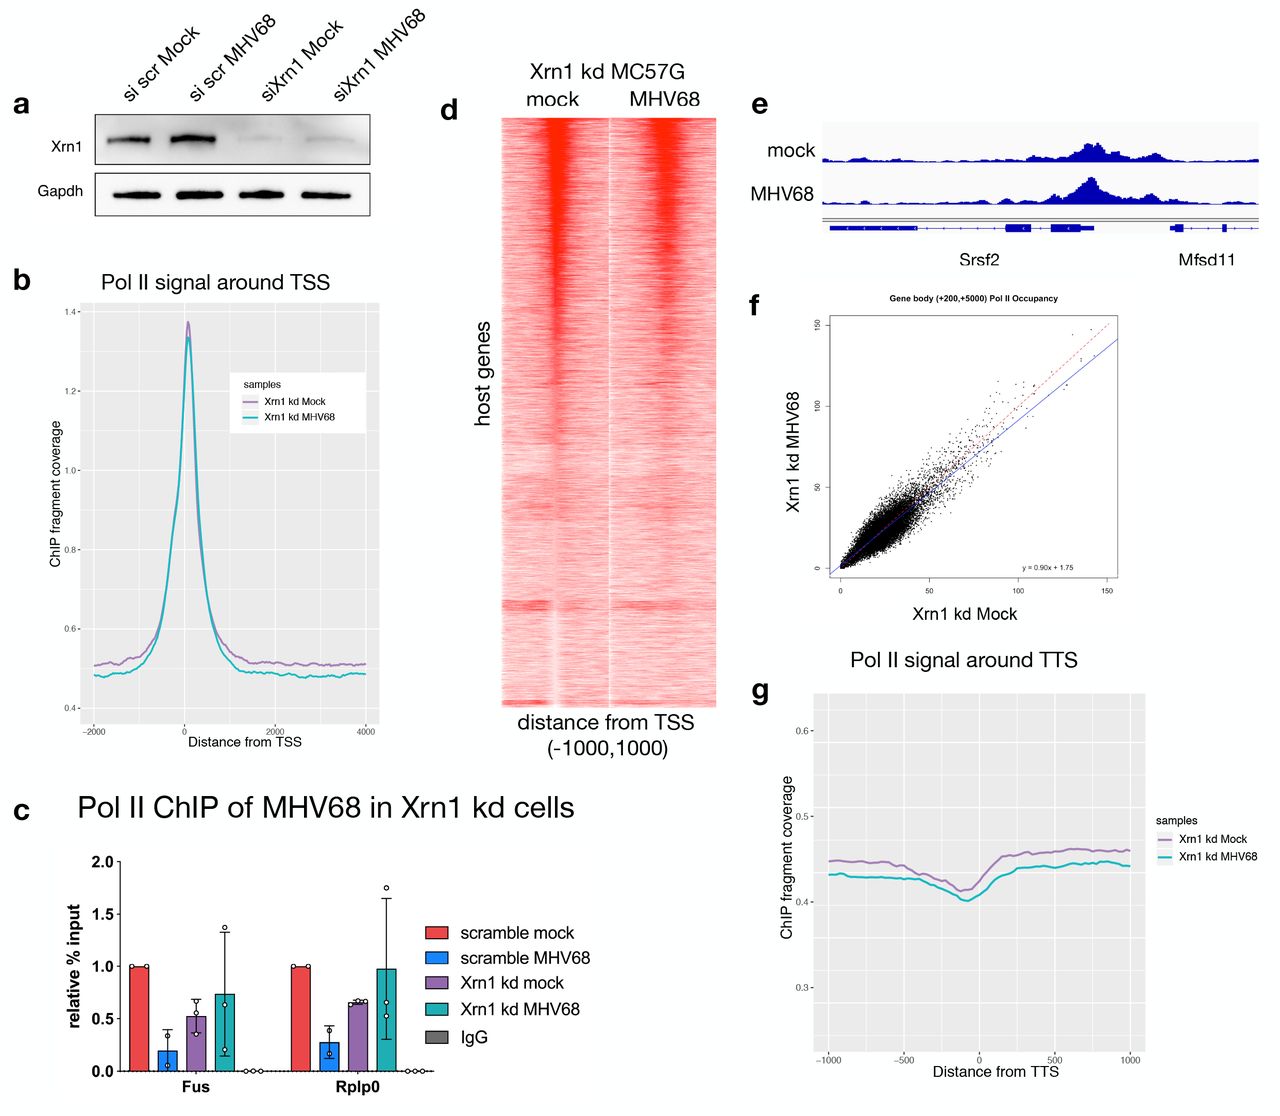
(A) Representative western blot showing the efficiency of Xrn1 knockdown (kd) in MC57G cells, with Gapdh serving as a loading control. (B) Sequence tags were binned into 25-bp bins for −2000 to +4000 around the transcription start site (TSS) in mock (purple) and MHV68 infected (green) Xrn1 kd samples for ChIPs and input controls. (C) ChIP-qPCR validation of Pol II occupancy at the Rplp0 and Fus promoters during mock and MHV68 infection in Xrn1 kd conditions. (D) Pol II ChIP-seq profiles of host genes in mock-infected and MHV68-infected cells depleted of Xrn1. Each row of the heat map displays Pol II occupancy of one gene from - 1000 to +1000 in 25 bp bins. (E) Pol II ChIP-seq coverage across the Srsf2 gene for mock and MHV68-infected Xrn1 kd cells. Alignment files were converted to the tiled data file (tdf) format and visualized in the Integrative Genome Viewer (IGV). (F) Scatterplot of Pol II occupancy of the gene bodies comparing mock to WT MHV68-infected cells during Xrn1 kd with a linear regression line plotted in blue and equation shown. A y=x line is plotted for reference in red. (G) Sequence tags were binned into 25-bp bins for transcription termination sequence (TTS) proximal Pol II for −1000 to +1000 around the TTS for mock (purple) and MHV68 infected (green).
Pol II recruitment to viral genes is not affected by RNA decay
Herpesviral genes are transcribed in the nucleus by mammalian Pol II, and thus could be similarly subjected to the mRNA decay-induced transcriptional repression observed across the host genome. We therefore analyzed Pol II occupancy of the viral genome in WT MHV68 and R443I infected cells to determine how viral genes respond to RNA decay. The average Pol II signature across 82 viral ORFs between −500 and +500 basepairs (bp) around the TSS (O’Grady et al., manuscript in preparation) was comparable in cells infected with WT or R443I MHV68, with a slightly higher signal in the R443I infection (Fig 3A). Indeed, there was a robust and widespread Pol II signal in both infection conditions across the viral genome (Fig 3B). Thus, herpesviral genes appear to escape mRNA decay-induced transcriptional repression.

(A) Viral gene Pol II recruitment is independent of RNA decay. Sequence tags were binned into 25-bp bins for −500 to +500 around the TSS. MHV68 WT (blue) and R443I (green) traces are shown. (B) Pol II ChIP-seq coverage across 5.5kb of the MHV68 genome for MHV68 WT and R443I in wild type (WT) cells and MHV68 infection in Xrn1 kd cells. Alignment files were converted to tdf format and visualized in the IGV. (C) Pol II ChIP qPCR signal is similar across gene bodies. Three regions of the ORF54 and ORF37 gene were assayed by Pol II ChIP-qPCR during MHV68 WT or R443I infection to assess the relative levels of Pol II across the gene.
In contrast to host genes, we did not observe peaks of promoter-proximal Pol II on the viral genome in our ChIPseq data (see Fig 3A, B). Pol II ChIP qPCR across various regions of ORF54 and ORF37 also showed a similar Pol II signal throughout each gene body and at their promoter. We did note a decrease in signal near the TTS of ORF54, however this was true for both WT and R443I infections (Fig 3C). We hypothesize that pervasive transcription of the viral genome at 24 hpi, compounded by the presence of TSSs on both Watson and Crick strands, likely contributes to this phenotype.
PABPC is not excluded from viral replication compartments
We next considered how the viral genome maintains high levels of Pol II occupancy during accelerated mRNA decay. During replication, viral DNA is transcribed within viral replication compartments (RCs) in the nucleus, which exclude host DNA and thus stain poorly with DAPI (Chang et al. n.d.; Taylor et al. 2003; Monier et al. 2000). Although they are not membrane bound, these compartments selectively enrich for factors required for viral replication (such as the viral processivity factor ORF59) and gene expression (such as Pol II) (Li et al. 2018; Dembowski & DeLuca 2015; Rice et al. 1994). Virus-induced mRNA decay causes increased trafficking of cytoplasmic poly(A) binding protein (PABPC) from the cytoplasm to the nucleus, which we have recently linked to transcriptional repression (Kumar et al. 2011; Gilbertson et al. 2018). To determine whether replication compartments selectively exclude nuclear PABPC as a means of avoiding transcriptional repression, we monitored its localization in cells lytically infected with MHV68 or KSHV. As expected, the majority of infected cells displayed increased nuclear PABPC compared to unreactivated or uninfected cells as measured by immunofluorescence (IF). We further saw that PABPC was not excluded from replication compartments (Fig. 4A, B, Supp Fig 3A). To determine PABPC localization relative to RCs, we first identified cells with RCs by looking for regions of Pol II or ORF59 staining that excluded DAPI. We then quantified nuclear PABPC pixel intensity, and counted cells as having an overlapping RC/PABPC signal when the PABPC pixel intensity was at least 2x that of cells without nuclear PABPC from the same image. Indeed, 85 percent of MHV68 infected cells showed overlapping PABPC/Pol II signal and 90 percent of reactivated iSLKs showed an overlapping PABPC/ORF59 signal (Fig 4C). Thus, PABPC exclusion from RCs is unlikely to underlie viral promoter escape.

(A)IF was performed on unreactivated iSLK cells using antibodies recognizing PABPC and ORF59. Host DNA was stained with DAPI.
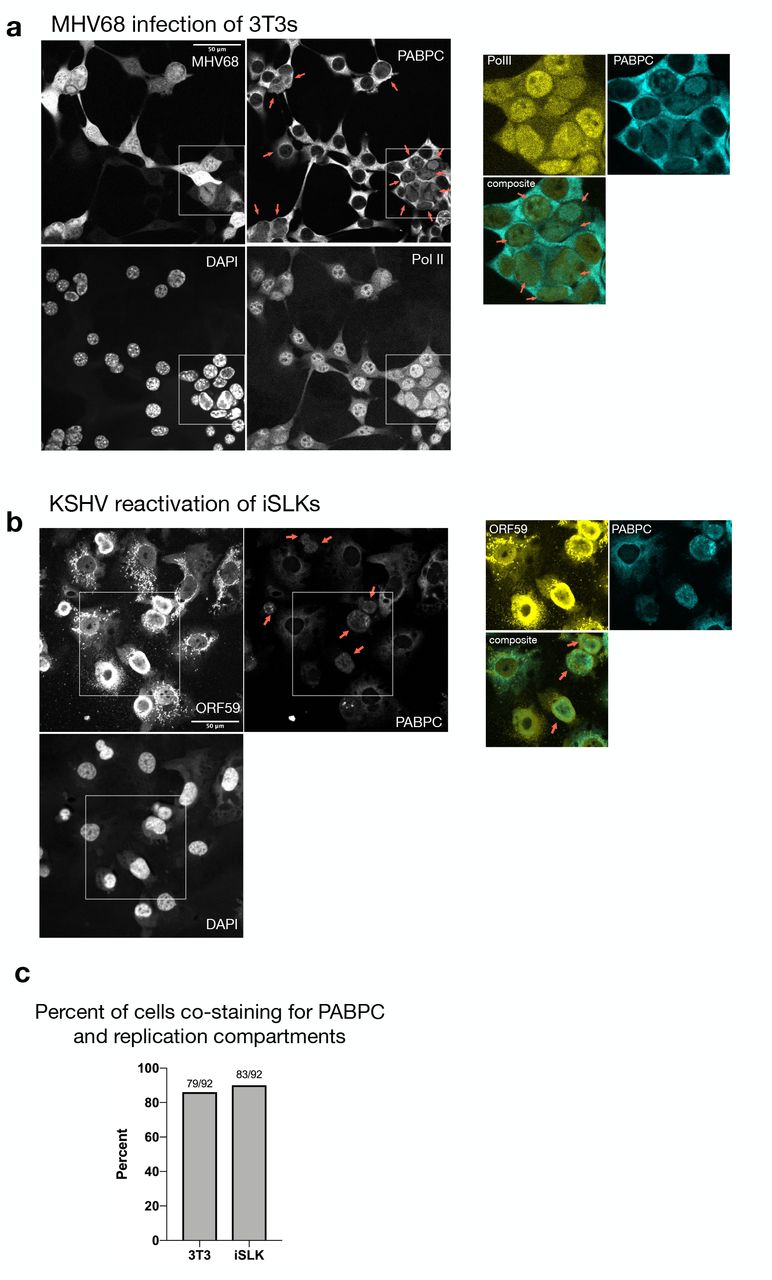
(A) Imunofluoresence (IF) was performed on MHV68 infected 3T3 cells at 27 hpi and stained with PABPC, Pol II and DAPI. The MHV68 genome contains GFP, which served as a marker of infection. Cells with RCs are denoted with red arrows. RCs were identified in cell nuclei with PolII staining overlapping regions that are DAPI negative. The inset shows a merge of Pol II and PABPC staining for several cells that co-stain for both proteins in RCs. (B) IF was performed on KSHV-positive iSLK cells reactivated for 48 h and stained with PABPC, ORF59 and DAPI. Cells with RCs are denoted with arrows and were identified in cell nuclei with ORF59 staining that overlaps with DAPI negative regions. The inset shows a merge of ORF59 and PABPC staining for several cells that co-stain for both proteins in RCs. (C) Percent of RC containing cells that overlap with PABPC signal. Fractions of cells with PABPC signal in RCs over total number of cells counted with RCs are displayed.
Viral promoters fail to escape transcriptional repression outside of the viral genome
We then tested whether viral promoter sequence elements were sufficient to enable escape by querying whether they remained immune to transcriptional repression upon relocation from the viral genome into the host DNA. We inserted the MHV68 late promoter M7 or the KSHV LANA promoter upstream of a puromycin resistance cassette into 293T cell chromatin using either lentiviral transduction or random plasmid DNA integration, respectively. We induced mRNA decay and host transcriptional repression in these cells by expression of MHV68 muSOX or the herpes simplex virus type 1 (HSV-1) endonuclease vhs. Similar to the host promoters Gapdh and Rplp0, Pol II recruitment to both integrated viral promoters was repressed upon induction of mRNA decay (Fig 5A, 5B).
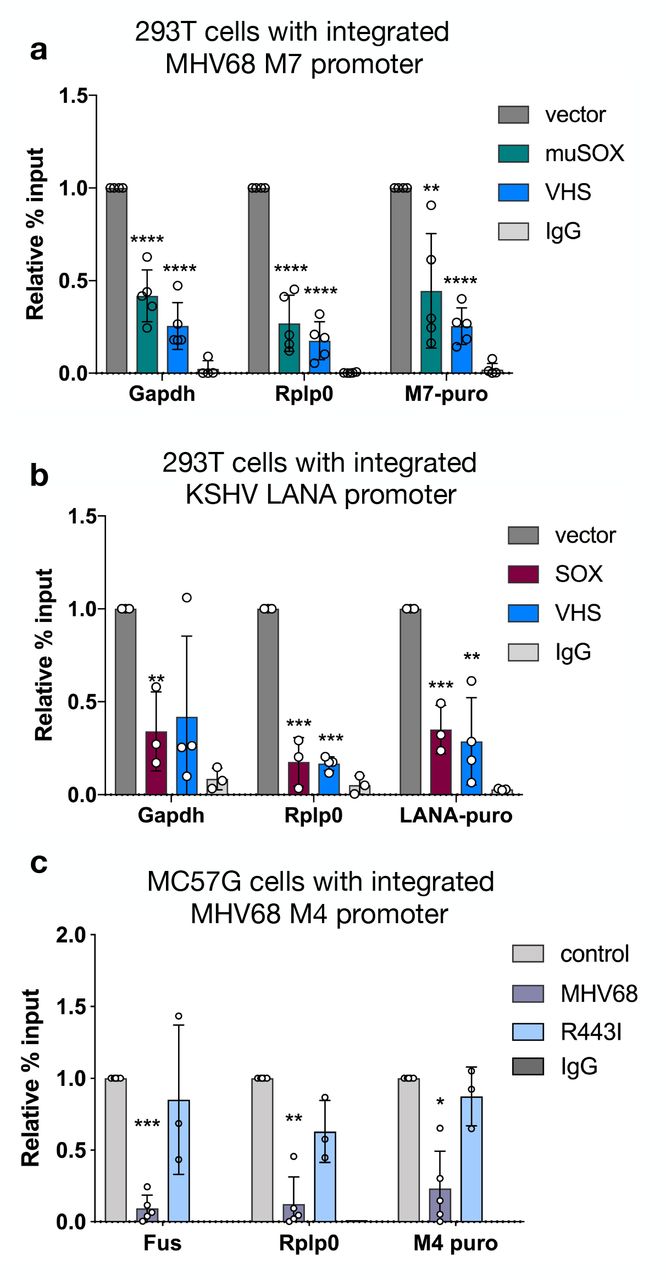
(A) The MHV68 M7 viral promoter driving puromycin resistance was lentivirally integrated into 293T cells. 24 h post transfection of muSOX or VHS, Pol II-ChIP qPCR was used to measure Pol II levels at two host promoters (Gapdh, Rplp0) and the integrated M7 promoter. (* p < 0.05, ** p < 0.01, *** p <0.001, **** p<0.0001 students t-test) (B) The KSHV LANA promoter driving puromycin resistance was integrated into 293T cells by random incorporation. Pol II-ChIP qPCR was used to measure Pol II levels 24 h post SOX or VHS transfection as described above. (C) The MHV68 M4 viral promoter driving puromycin resistance was lentivirally integrated into MC57G cells. The cells were then infected with WT MHV68 or R443I at a MOI of 5 and Pol II levels at the indicated promoters were assayed by Pol II ChIP-qPCR.
To confirm that viral promoters integrated into the host genome were also repressed in the context of infection, we infected MC57G cells containing an integrated MHV68 M4 promoter-driven puromycin cassette with MHV68. Indeed, the M4 promoter was repressed to a similar degree as host Fus and Rplp0 promoters during infection with WT MHV68 but not the mRNA decay-deficient MHV68 R443I (Fig 5C). In summary, these data argue against the presence of protective elements within viral promoters, and instead suggest that the chromatin context or location on the viral genome underlies escape from mRNA decay-induced transcriptional repression.
Non-MHV68 promoters escape repression on the viral genome
A prediction from the above results is that non-MHV68 promoters would gain protection from transcriptional repression when present on the replicating viral genome. To test this, we measured the Pol II occupancy and transcriptional potential of the cytomegalovirus (CMV) promoter, which drives green fluorescent protein (GFP) expression on the MHV68 genome. Unlike alpha- and gammaherpesviruses, the betaherpesvirus CMV does not accelerate mRNA decay. Furthermore, in either a plasmid context or when integrated into 293T cells, the CMV promoter is strongly repressed during muSOX-induced mRNA decay (Fig 6A, B). However, placed in the context of the replicating MHV68 genome, the CMV-GFP promoter had a Pol II ChIPseq signal during both MHV68 WT and R443I infection that was not markedly different from several other representative viral genes (ORFs 4, 25, 48, 52, 72, M11) (Fig 6C).

(A) 4SU-RNA levels of luciferase driven by CMV in muSOX and vector-control expressing cells. Cells were separated using the co-expressed Thy1.1 marker to ensure pure populations of transfected cells. (B) The CMV promoter driving puromycin resistance was lentivirally integrated into MC57G cells. The cells were then infected with WT MHV68 or R443I at an MOI of 5 and Pol II levels at the indicated promoters were assayed by Pol II ChIP-qPCR. (C) ChIP-seq traces comparing WT MHV68 to R443I coverage from −300 to +200 around the TSS in 25 bp bins, averaged from two biological replicates. Six representative viral genes and CMV-GFP are shown. (D) 293T cells were infected with KSHV and then transfected with muSOX twice over a 24 h period to induce accelerated decay. Pol II levels at the indicated KSHV and human promoters were measured by ChIP-qPCR. (** p < 0.01, students t-test)
Finally, we evaluated whether lytically replicating viral DNA was necessary to confer escape from transcriptional repression, or whether some other feature of the non-replicating viral genome was important. To this end, we examined Pol II occupancy at promoters of several genes expressed from the KSHV genome during latent infection in 293T cells, when the viral DNA is maintained as an episome but not amplified in replication compartments. Latent infection does not promote mRNA turnover, and thus we transfected muSOX into these cells to stimulate mRNA turnover in the absence of lytic replication. Similar to the host genes Gapdh and Rplp0, we observed an RNA decay-induced repression of Pol II occupancy at the latent viral promoter LANA and the viral K1 promoter was repressed in 4 out of 5 experiments (Fig 6D). We also observed repression of the human Ef1α promoter, which is present on the Bac16 KSHV viral episome as a driver of the GFP reporter gene (Fig 6D). In sum, these observations indicate that the viral genome per se does not confer protection from transcriptional repression; instead, features linked to lytic genome amplification in replication compartments facilitate robust Pol II recruitment under conditions of accelerated mRNA turnover.
Discussion
Here, we demonstrate that virus-induced mRNA decay broadly decreases Pol II recruitment to mammalian promoters, extending prior observations made with individual cellular genes to the genomic scale. Although the MHV68 endonuclease muSOX cleaves the majority of cytoplasmic mRNA, we found that the cellular 5’-3’ exonuclease Xrn1, which degrades these cleaved fragments, is essential for inhibiting Pol II recruitment across the mammalian genome. In contrast, promoters on the replicating viral genome recruit Pol II with similar efficiency during normal or accelerated mRNA decay, indicating that they escape transcriptional inhibition. This protection is lost upon relocation of the viral promoters into the host genome or when the viral genome is in a latent state, emphasizing the importance of DNA context and replication state, rather than promoter sequence, in determining the transcriptional response to accelerated mRNA decay.
Across the host genome, Pol II occupancy appears to be most strongly affected at the stage of recruitment. The reduction in promoter-proximal Pol II is propagated into the gene body, although the differences there were less pronounced, suggesting that once transcription of a gene initiates there are not subsequent blocks to elongation. This agrees with prior studies of individual host loci in MHV68 infected or muSOX expressing cells (Abernathy et al. 2015; Gilbertson et al. 2018). We also did not observe a defect in transcription termination, or evidence of polymerases on the DNA after TSSs, suggesting that the gammaherpesvirus MHV68 does not induce the termination defect and run-on transcription of host genes recently described in HSV-1 (Rutkowski et al. 2015).
Two pieces of evidence indicate that reduction of Pol II at host genes is unlikely due to sequestration of or competition for the transcription machinery by the viral DNA. First, infection with the mRNA decay mutant virus R443I, which replicates its viral genome to WT levels (Richner et al. 2011), does not induce the widespread reduction in Pol II recruitment to host promoters. Second, transfection of muSOX alone (or other broad acting viral endonucleases) in the absence of viral infection is sufficient to induce transcriptional repression at host promoters. Therefore, we instead favor the hypothesis that one or more cellular proteins released from degrading mRNA fragments triggers a signaling event that restricts transcription machinery occupancy of mammalian chromatin (Gilbertson et al. 2018).
Reduced Pol II occupancy of the host genome during MHV68 infection parallels infection data from the alphaherpesvirus HSV-1. HSV-1 infection results in a genome-wide reduction in Pol II occupancy of host chromatin and reduced nascent RNA production of the majority of host transcripts (Rutkowski et al. 2015; Abrisch et al. 2016; Spencer et al. 1997). Furthermore, early data showed that while the endogenous mouse β-globin locus was transcriptionally repressed during HSV-1 infection, its expression was rescued upon integration of the β-globin gene into the HSV-1 genome (Smiley et al. 1987; Smibert & Smiley 1990). Experiments with gene-specific null viruses have implicated immediate early (IE) proteins in the HSV-1 transcriptional repression phenotype, including ICP27, which can accelerate mRNA turnover (Spencer et al. 1997; Smiley 2004). Additionally, we have previously published, and confirm in this report, that transfection of HSV-1 vhs, another broad acting endoribonuclease, is sufficient to induce reduced Pol II occupancy of several host promoters (Abernathy et al. 2015). Thus, in addition to targeting host and viral mRNAs for cytoplasmic decay, both alpha and gammaherpesviruses restrict Pol II occupancy of the host genome, although additional work is needed to establish whether the underlying mechanism is similar.
During the lytic stage of herpesvirus infection, viral DNA is localized to replication compartments. These non-membrane bound structures are sites of viral genome replication, transcription, and packaging (Schmid et al. 2014). They are enriched for many host and viral proteins involved in these processes, including chromatin modifying factors and Pol II (Dembowski & DeLuca 2015; Rice et al. 1994; Li et al. 2018). Replication compartments grow and coalesce over infection, excluding host chromatin, which becomes pushed to the nuclear periphery (Chang et al. n.d.; Taylor et al. 2003; Monier et al. 2000). We recently showed that muSOX and Xrn1-coordinated mRNA decay causes differential trafficking of many cellular RNA binding proteins between the cytoplasm and nucleus (Gilbertson et al. 2018). Knockdown and overexpression studies suggested that at least one of these proteins, PABPC, is associated with transcriptional repression. Here, we detected PABPC in viral replication compartments of infected cell nuclei, indicating that selective exclusion of PABPC from these compartments is not the mechanism by which the viral genome escapes repression. Instead, we hypothesize that either the state of viral DNA or other protective features of the replication compartment confers escape from transcriptional repression.
Protection from mRNA decay-induced transcriptional repression was not conferred to host or viral promoters present on the latent viral episome, indicating that lytic phase viral DNA replication or replication compartment formation is key to this phenotype. The latent genomes of gammaherpesviruses including KSHV and Epstein Bar Virus (EBV) are heavily methylated and histone-rich, with the exception of promoters of genes expressed during latency, the latent origin of replication, and CTCF binding sites (Günther & Grundhoff 2010; Szyf et al. 1985; Hilton et al. 2013). Notably, during latency key lytic promoters like RTA contain both the activating H3K4me3 and the repressive H3K27me3 histone marks, representing a ‘poised’ state (Toth et al. 2010). Rapid changes shortly after lytic cycle induction result in hypomethylation and removal of repressive marks at early gene promoters(Günther & Grundhoff 2010; Toth et al. 2010). At later stages of infection, KSHV, EBV and HSV-1 genomes have been shown to be largely nucleosome free, consistent with histones not being packaged in virions (Dembowski & DeLuca 2015; Monier et al. 2000; Hollingworth et al. 2017). For gammaherpesviruses, this is the stage at which mRNA degradation is most pronounced. We therefore hypothesize that the ‘open’ state of viral DNA during lytic replication plays an important role in facilitating Pol II recruitment under conditions of accelerated cytoplasmic mRNA decay. Future work is geared towards exploring whether widespread mRNA decay alters cellular chromatin states and DNA accessibility and, if so, how this influences transcription factor recruitment.
In conclusion, decay-coupled transcriptional repression is a novel facet of viral manipulation of the cellular gene expression landscape. We hypothesize that the ability to escape from transcriptional repression is linked to the open conformation of viral DNA in replication compartments, and that this helps these viruses counteract decay-induced viral transcript loss. While widespread mRNA decay has been shown to facilitate immune evasion, gene expression control, and latency establishment, the robust viral transcription we document here presents a parsimonious explanation for a novel way in which the virus benefits from accelerated decay.
Materials and Methods
Plasmids and Primers
pCDEF3 muSOX and VHS and SOX have been previously published(Abernathy et al. 2015). pCDEF3-GFP was used as a control.
Primers used for qPCR and for cloning are listed in Supp Table 2. M7 and M4-puro were made by cloning the respective promoter sequence upstream of the puromycin cassette in a pLKO-sgRNA vector. The promoter of M4 was defined as the 1131bp upstream of the M4 coding region not overlapping with other viral ORFs and the promoter sequence of M7 was previously published (Wong-Ho et al. 2014). pGL3-kLANA-puromycin was made by introducing the puromycin gene into the I-CeuI and XbaI sites of pGL3-kLANA via InFusion (Clonetech) cloning. pGL3-kLANA was made by amplifying KSHV’s LANA promoter sequence (Jeong et al. 2001)and using InFusion cloning to introduce it into the XhoI and HindIII sites of pGL3. pGL3-CMV was similarly made by introducing the amplified CMV promoter into the same sites of pGL3.
Cells and transfections
MC57G mouse fibroblast cells (ATCC), 293T cells (ATCC) and NIH 3T3 cells (ATCC) were maintained in DMEM (Invitrogen) supplemented with 10% fetal bovine serum (FBS). iSLK BAC16 cells (Brulois et al. 2012) were maintained in DMEM supplemented with 10% FBS and 1mg/mL hygromycin B. To reactivate iSLK cells, they were treated with 1ug/mL doxycycline and 1mM sodium butyrate for 48h.
DNA transfections were carried out in 293T cells at 70-90% confluency in 10 cm plates with 10 μg host-shutoff factor plasmid or vector control using PolyJet (SignaGen) 24h before harvesting and again at 18h before harvesting.
Lentiviral transduction was carried out by spinfecting 1×10⁶ 293T or MC57G cells with lentivirus made from 2nd generation plasmids at a MOI <1 for 2h with 4ug/mL polybrene (Fisher). Twenty-four hours later puromycin (1 μg/ml for 293T or 3 μg/ml for MC57G) was added to select for transduced cells. 293T cells stably expressing the kLANA-puromycin cassette were made by transfecting the cells with 1 μg pGL3-kLANA-puromycin using PolyJet, then selecting with puromycin for random integration events.
For the CMV-luciferase promoter assay, populations of 293T cells expressing muSOX were selected 24h post-transfection using the Miltenyi Biotec MACS cell separation system according to the manufacturer’s instructions as previously described (Gilbertson et al. 2018).
293T cells were infected with KSHV by reactivating iSLK-Bac16 cells for 48h and then spinfecting cell-free virus onto a monolayer of 293T cells, as described for lentiviral production but in the absence of polybrene.
3 million MC57G cells were nucleofected with a 100uL Neon tip (1400 Voltage/20 Width/2 Pulse) to knockdown Xrn1 using a pool of 4 siRNAs (Dharmacon M-046621-01-0005) or a non-targeting control (Dharmacon D-001206-14-20) using 10uL of 20uM siRNA.
4SU labeling
Cells were incubated in suspension with 500 μM 4SU (Sigma T4509) in DMEM supplemented with 10% FBS for 10 min then washed with PBS. RNA was extracted with TRIzol followed by isopropanol purification. RNA (300 ug) was incubated in biotinylation buffer (50 mM HEPES [pH 7.5], 5 mM EDTA) and 5ug MTSEA-biotin (Biotium #90066), rotating at room temperature in the dark for 30m. A no biotin control was made from an equal amount of total RNA and incubated as above but without the addition of MTSEA-biotin. RNA was then phenol:chloroform extracted and precipitated with isopropanol. The pellet was resuspended in DEPC-treated water and mixed with 50 uL Dynabeads MyOne streptavidin C1 (Invitrogen) that had been pre-washed twice with wash buffer (100 mM Tris [pH 7.5], 10 mM EDTA, 1 M NaCl, 0.1% Tween 20). Samples were rotated in the dark for 1hr at room temperature, then washed twice with 65°C wash buffer and twice with room temperature wash buffer. Samples were eluted twice with 100uL 5% Beta-mercaptoethanol (BME) in DEPC H20 for 5m then RNA was precipitated with isopropanol and quantified by RT-qPCR.
Viral mutagenesis, propagation and infections
The WT and R443I MHV68 bacterial artificial chromosome (BAC) were previously described (Adler et al. 2000; Richner et al. 2011). MHV68 was produced by first making p0 virus by transfecting NIH 3T3 cells in 6-well plates with 2.5 μg BAC DNA using TransIT-X2 (Mirus Bio) for 24h. Five to seven days later, the cells were split into a 10 cm dish, then harvested and frozen. After 5-7 days the majority of cells showed cytopathic effect (CPE). 30 μL of p0 was then added per confluent 10 cm dish of NIH 3T12 cells, split 2 days later into four 10 cm dishes and harvested 4-6 days later when all cells were infected. Cells were collected by centrifugation (5 min, 1500 rpm) and the pellet was dounced 10 times. The cell pellet and supernatant were then ultracentrifuged for 2 h at 30,000 rpm. The resulting pellet was resuspended and titered by plaque assay. Cells were infected with MHV68 at an MOI of 5 for 24h.
Western blotting
Cells were lysed in RIPA buffer (50 mM Tris-HCl pH7.6, 150 mM NaCl, 3 mM MgCl2, 10% glycerol, 0.5% NP-40, cOmplete EDTA-free Protease Inhibitors [Roche]) and then clarified by centrifugation at 15,000 rpm for 10 min at 4°C. Whole cell lysate was quantified by Bradford assay and resolved by SDS-PAGE. Antibodies for western blot are: Xrn1 (Bethyl A300-443A, 1:1000), and Gapdh (Abcam, ab8245, 1:2000).
RT-qPCR
RNA was reverse transcribed using AMV RT (Promega) with random 9-mer primers. Total RNA was DNase treated with TURBO DNase (ThermoFisher) or DNase treated on column with Zymo Direct-zol RNA MiniPrep Plus DNase. cDNA was quantified using iTaq Universal SYBR Mastermix (BioRad) and transcript-specific primers. All qPCR results are normalized to 18S levels and WT or vector control set to 1.
Immunofluoresence
NIH 3T3 cells were plated on coverslips (7.5 × 10⁴ cells/well of a 12-well), infected the following day for 25-27 h, and then fixed in 4% formaldehyde for 10 min. iSLK-Bac16 cells were plated on coverslips (5 × 10⁴ cells/well of a 12-well), reactivated 24h later with doxycycline and sodium butyrate for 48 hours and then fixed as above. Cells were permeabilized with ice-cold methanol at −20°C for at least 20 min and incubated with anti-Pol II antibody (Biolegend, 8WG16 at 1:200), anti-PABPC antibody (Abcam ab21060 at 1:200 for mouse cells and Santa Cruz sc32318 at 1:25 for human cells) or anti-ORF59 antibody (Advanced Biotechnologies 13-211-100 at 1:200) in 5% BSA overnight at 4 °C. Secondary antibodies were added (1:1000) for 1 h at 37 °C. Coverslips were mounted in DAPI-containing Vectashield (VectorLabs). We identified RCs by DAPI exclusion and Pol II recruitment or ORF59 staining (Rice et al. 1994; Dai-Ju et al. 2006; Li et al. 2018). Images were collected on a Zeiss LSM 710 AxioObserver with a 40x oil objective. Cells with RCs were first identified, then PABPC co-localization was determined by counting cells with at least 2x nuclear pixel intensity relative to non-RC containing cells in the same image (ImageJ).
Chromatin immunoprecipitation (ChIP)
ChIP was performed from 15 cm plates of cells. 3 × 10⁶ MC57G or 293T cells were plated 24 h before infection and then harvested 24 h after infection or transfection(s). Upon harvesting, cells were washed with PBS, crosslinked in 1% formaldehyde at room temperature for 10 min. Cells were quenched in 0.125 M glycine for 5 min and washed twice with cold PBS. Crosslinked cell pellets were mixed with 1 mL fractionation buffer (5mM PIPES pH 8.0, 85mM KCl, 0.5% NP-40 with cOmplete EDTA-free Protease Inhibitors [Roche]) and incubated on ice for 10 min, during which time the lysate was dounce homogenized to release nuclei and spun at 4,000 rpm for 5 min at 4°C to pellet nuclei. Nuclei were then resuspended in 300 ul of nuclei lysis buffer (50mM Tris-HCl pH 8.0, 0.3% SDS, 10mM EDTA, with cOmplete EDTA-free Protease Inhibitors [Roche]) and rotated for 10 min at 4°C followed by sonication using a QSonica Ultrasonicator. Sonicated chromatin was then spun at 13,000 rpm for 10 min at 4°C and the pellet discarded. 40ug of chromatin was brought to 500uL with ChIP dilution buffer (16.7 mM Tris-HCl pH 8.0, 1.1% Triton X-100, 1.2 mM EDTA, 167 mM NaCl and cOmplete EDTA-free Protease Inhibitors [Roche]) and incubated with 10 ug mouse monoclonal anti-RNAPII (BioLegend, 8WG16) or rabbit IgG (Fisher Scientific) overnight, whereupon samples were rotated with 20 ul protein G dynabeads (Thermofisher) for 2 h at 4°C. Beads were washed with low salt immune complex (20 mM Tris pH 8.0, 1% Triton-x-100, 2 mM EDTA, 150 mM NaCl, 0.1% SDS), high salt immune complex (20 mM Tris pH 8.0, 1% Triton-x-100, 2 mM EDTA, 500 mM NaCl, 0.1% SDS), lithium chloride immune complex (10mM Tris pH 8.0, 0.25 M LiCl, 1% NP-40, 1% Deoxycholic acid, 1 mM EDTA), and Tris-EDTA for 5 min each at 4°C with rotation. DNA was eluted from the beads using 100 ul of elution buffer (150 mM NaCl, 50 ug/ml Proteinase K) and incubated at 55°C for 2h, then 65°C for 12h. DNA was purified using a Zymo Oligo Clean & Concentrator kit, and quantified by qPCR using primers to the promoter regions of indicated genes for 50 cycles. qPCR was simultaneously performed on input chromatin and normalized to input.
ChIP-Sequencing and data analysis
Libraries were prepared for sequencing (Kapa Hyper Prep) and sequenced on a HiSeq4000 with 100bp single end reads or 150bp reads (Xrn1kd second replicate only). Sequencing quality was assessed with FastQC and trimmed with Sickle. A custom index was made of the mm10 and MHV68 genomes with Bowtie2 build. Reads were mapped to that index using Bowtie2 (2.3.0).
To visualize reads in the Integrative Genomics Viewer (IGV), tdf files were made from bam files and indexes made from those bam files. To make tdf files for the viral genome, a chrom.size file was created for MHV68 and then the count command was run. Analysis of mapped reads was performed with HOMER (Hypergeometric Optimization of Motif EnRichment) (Heinz et al. 2010). Tag directories were created from the bam files generated from Bowtie with the makeTagDirectory command. This was done separately for the mouse and MHV68 genomes. For mouse genes, the analyzeRepeats command was used to look at tag density in the body of genes and the –c pausing option was used to compare pausing ratios. annotatePeaks was run in both the –hist and –ghist mode to assess composite Pol II occupancy across the mouse genome as well as individual gene occupancy.
Viral analyses were done by first creating a custom genome annotation in HOMER using the loadGenome command. The TSS file was created from data generously shared by Scott Tibbetts. annotatePeaks was run in the –hist mode to assess composite Pol II occupancy across the viral genome as well as individual gene occupancy.
Acknowledgements
We thank all members of the Glaunsinger and Coscoy labs for their helpful suggestions and discussions. We thank David McSwiggen for his microscopy assistance, Jennifer Kugel for her guidance applying HOMER to the viral genome and Scott Tibbetts for sharing MHV68 TSS data. This work used the Vincent J. Coates Genomics Sequencing Laboratory at UC Berkeley, supported by NIH S10 OD018174 Instrumentation Grant. Confocal imaging experiments were conducted at the CRL Molecular Imaging Center on the Zeiss LSM 710, supported by the Gordon and Betty Moore Foundation. We would like to thank Holly Aaron and Feather Ives for their microscopy training and assistance. B.G. is an investigator of the Howard Hughes Medical Institute, and is further supported by NIH R01 CA136367 for this work.
References


