

Abstract
The SIR complex (Silent Information Regulator) is the building block of heterochromatic structures that silence underlying genes. It is well established that the silenced state is epigenetically inherited but it is not known how the SIR complex survives perturbations caused by DNA replication nor how it is maintained when cells are exposed to environmental challenges such as nutrient deprivation. The biological function of heterochromatin located in subtelomeric regions is also unclear since heterochromatin coverage appears to be limited to a few kbps near chromosome ends and the expression of subtelomeric genes is only marginally affected in the absence of the SIR complex. We use a three pronged approach to address these questions. First, nanopore-MetID, an in vivo foot printing technique similar to DamID that uses nanopore sequencing technology, identified hundreds of new transient contacts between Sir3 and euchromatic genes that are not detectable by ChIP-seq and revealed a high and a previously undocumented low-density mode of Sir3 binding to subtelomeric regions. Second, our measurements of genome-wide Sir3 exchange rates after exit from starvation show that heterochromatin is a highly dynamic structure in optimal growth conditions. Third, “spike-in” RNA-seq time course experiments in the same conditions reveal that Sir3 modulates global mRNA levels in correlation with fluctuations in nutrient availability. We now propose that subtelomeric regions serve as Sir3 hubs from which Sir3 diffuses down the chromosome arm and transiently contacts euchromatic genes in its path. We hypothesize that contacts between Sir3 and actively transcribed genes facilitate the removal of stalled transcription complexes and allow for optimal genome-wide transcription.
Introduction
Heterochromatin in budding yeast is a transcriptionally repressive structure located at the silent mating type loci (HMR and HML), telomeres and rDNA repeats. The essential component of this structure is the non-histone protein complex SIR (Silent Information Regulator), which consists mainly of Sir2p, Sir3p and Sir4p. Sir4p scaffolds the complex while Sir2p functions as an NAD-dependent H4K16 deacetylase, providing a high-affinity binding site for Sir3p which then recruits Sir4p (for review see (1)). In the classical polymerization model, SIR components are first recruited to silencer regions by a combination of silencer-binding factors (ORC –Origin Recognition Complex, Rap1p and Abf1p). The SIR complex then spreads from the nucleation site (silencer) through cycles of histone H4 deacetylation and binding to nucleosomes, which continue until the SIR complex reaches boundary elements that prevent unwanted spreading to transcriptionally active regions (for review see (2)).
It is well established that the SIR dependent silent state of heterochromatic loci is epigenetically inherited but the molecular mechanisms responsible for the maintenance and renewal of the SIR complex from one cell generation to the next are not well understood. Indeed, over-expressed Sir3p can be incorporated into existing heterochromatin (3), but beyond this bulk measurement, the locus-specific dynamics of the chromatin bound SIR complex within and from one cell generation to another have not yet been measured. How heterochromatic SIR complexes exchange their components during the cell cycle and how they are distributed to daughter chromatids after replication has important implications for how heterochromatic states are maintained and whether they may be inherited.
Likewise, the function of subtelomeric heterochromatin is still an open question. Classic RNA-seq experiments in SIR mutant backgrounds failed to detect significant changes in the expression of most subtelomeric genes (4) and the long standing hypothesis that the SIR complex prevents deleterious inter-chromosomal homologous recombination between repetitive subtelomeric regions similar to its role at the rDNA locus (5). has not been experimentally corroborated (6). On the contrary the SIR complex stimulates the homologous recombination pathway during double strand break repair by promoting telomere clustering and bringing them close to each other (7).
Another open question is how chromatin bound complexes that epigenetically determine gene expression states, like the SIR complex, respond to environmental challenges such as nutrient depletion. Indeed, under unfavorable conditions, yeast cells stop growing until depleted nutrients are restored. Growth arrest is characterized by transcriptional reprogramming, spatial reorganization of the genome and a 300 fold decrease in protein synthesis rates (8). While the organization of the SIR complex in growth arrest has been described, the dynamics of the SIR complex during and following exit from growth arrest are poorly understood (9). These questions have motivated us to probe SIR function and genome localization in fluctuating nutrient conditions using new genome-wide approaches. We chose to focus on the Sir3p subunit because Sir3p is the limiting factor that determines the extent of SIR complex polymerization and the location of SIR complex boundaries (10–12).
First, we sought to expand the catalogue of known genome-wide Sir3 binding sites by including transient and unstable contacts that are not detectable by ChIP. We reasoned that clues for the function of subtelomeric chromatin may lie beyond known subtelomeric nucleation sites. In order to detect these hitherto “invisible” Sir3 targets we developed Nanopore-MetID, an in-vivo genome-wide foot printing method that combines Sir3 fused to the Dam or the EcoG2 DNA-methyl transferase that marks Sir3 targets by methylating nearby Adenines, with direct detection of methylation by long read nanopore sequencing.
Second, we measured genome wide Sir3p turnover rates after exit from nutrient deprivation with the goal to better understand the mechanisms of subtelomeric heterochromatin maintenance and renewal in variable growth conditions.
Third, in order to better understand how and if Sir3 dynamics at subtelomeric loci and transient Sir3 contacts with euchromatin identified with Nanopore-MetID, influence global gene expression upon release from starvation we performed “spike-in” RNA-seq experiments.
Our three-pronged genome-wide approach provides a comprehensive picture of Sir3 activity before and after nutrient depletion and reveals a new role for Sir3 in the genome-wide control of gene expression.
Results
In vivo foot printing reveals transient Sir3p contacts at hundreds of eukaryotic genes
As mentioned above, we sought to investigate whether transient and unstable Sir3 contacts beyond the known SIR loci that were mapped by ChIP-seq (12) may provide clues for the function of subtelomeric heterochromatin. We have therefore developed a technique that can map transient and/or rare contacts between chromatin proteins and DNA called Nanopore-MetID for Nanopore sequencing and Methyl-adenine IDentification. This method combines nanopore sequencing (13) and in vivo methyl-Adenine foot printing similar to DamID (14). Nanopore sequencing detects different nucleic acid bases by monitoring changes to an electrical current as nucleic acids are passed through a protein nanopore. Moreover, nanopore sequence detection can distinguish modified bases from the canonical A, T, G and C, thus making it possible to monitor DNA methylation of Cytosines or Adenine residues (13, 15).
We fused Sir3 to the Dam or the EcoG2 DNA methyl transferases from E.Coli (Supplementary Figures S1 and S2). While Dam only methylates Adenines in GATC motifs, EcoG2 methylates all accessible Adenines. meA at sites of contact between Sir3Dam or Sir3EcoG2 and DNA can then be directly read with nanopore sequencing. Unlike ChIP-seq, which detects stable long-lived Sir3-DNA/chromatin interactions, Dam and EcoG2 methylation leave a long-lived trace of transient, short lived and/or rare contacts between Sir3 and chromatin if Sir3 residency time on chromatin is long enough to allow for Dam or EcoG2 methylation of nearby GATCs or As, respectively. Also, since nanopore sequencing does not require amplification of the isolated DNA, the fraction of methylated reads in the entire population of sequenced reads reflects the frequency of Sir3 contacts per cell, and given sufficient sequencing depth, allows for the detection of rare contacts that occur only in a small fraction of the cell population and which would be too close to or even below the genome average read count in ChIP-seq datasets to be considered as “true” Sir3 targets.
We first mapped meA in saturated midlog cultures of Sir3Dam cells to minimize the number of cells undergoing replication since replication bubbles interfere with sequencing through nanopores. The meA signal was determined as described in Figure S1B and the Materials and Methods section in the SI Appendix. Since our yeast strains are haploid and isolated DNA fragments are sequenced directly without amplification, the meA count in Sir3Dam cells normalized to read count and GATC content and subtracted from the normalized meA count of the negative control Rpc82Dam gives us the probability that a GATC motif within a given genomic region will be methylated by Sir3Dam in any cell in the population (Fig. S1C-D). Note that this value may be an underestimate of the actual number of transient Sir3 contacts as it can only detect Sir3 contacts close to GATCs that are accessible to methylation and are for example not masked by nucleosomes and whose residency time on DNA is long enough to allow for Dam methylation. Nevertheless, our analysis reveals that at least 24% of gene promoters and at least 14% of gene coding sequences (CDS) have a non-zero probability of GATC methylation in the cell population and are consequently transiently contacted by Sir3 (Figure S1E). The fact that there are more promoters than CDSes that are methylated by Sir3Dam is consistent with the idea that Dam methylation is more efficient in open chromatin because promoters are largely depleted of nucleosomes. Considering that only 3% of yeast genes are located within 30kbps of chromosome ends and subtelomeric heterochromatin, the vast majority of genes that are transiently contacted by Sir3 are actually found in euchromatin.
Note that since there is on average only one GATC per 400bp in each gene promoter or CDS, and Sir3Dam foot printing does not discriminate between stable Sir3 binding within the SIR complex or transient/unstable Sir3 binding to euchromatin that occurs frequently within the cell population, the probability of GATC methylation by Sir3Dam does not reflect the density or the stability of Sir3 molecules that were bound to the methylated site. Consequently, the meA signal at some euchromatic genes may be as high or even higher than at genes located in heterochromatic regions (compare genes around 150kbps and 180kbps and genes around HML on chromosome 3 in Fig. S1D).
We consequently used a Sir3EcoG2 fusion to assess Sir3 density and/or stability at the binding site, which are directly correlated to the density of meA in a given region. We also determined the frequency of specific Sir3 contacts in the cell population, which is calculated from the number of reads (equal to the number of cells for our haploid strains) that contain at least one meA in a given genomic region (Supplementary Figure S2A). Since Adenines comprise ~25% of the yeast genome, the density of meA determined by the normalization of the meA count by the read count and Adenine content in 400bp windows, yields a Sir3EcoG2 methylation profile that is remarkably similar to the Sir3 ChIP-seq profile (Figures 1A and S2B). Note that, as explained above, Nanopore-MetID with Sir3Dam measures the probability of GATC methylation after Sir3Dam binding to the site and since there is on average only one GATC/400bp as opposed to 100 A/400bp, foot printing with Sir3Dam cannot differentiate between GATC containing sites that are populated with a lot of stably bound Sir3 molecules in every cell of the population or sites that are frequently but transiently contacted by only a few Sir3 molecules in most cells of the population. Consequently, the profiles of meA probability at chromosomes ends in the Sir3Dam strain do not show a higher methylation probability at SIR nucleation sites compared to the region located up to 30kbps downstream (Figure 1A).

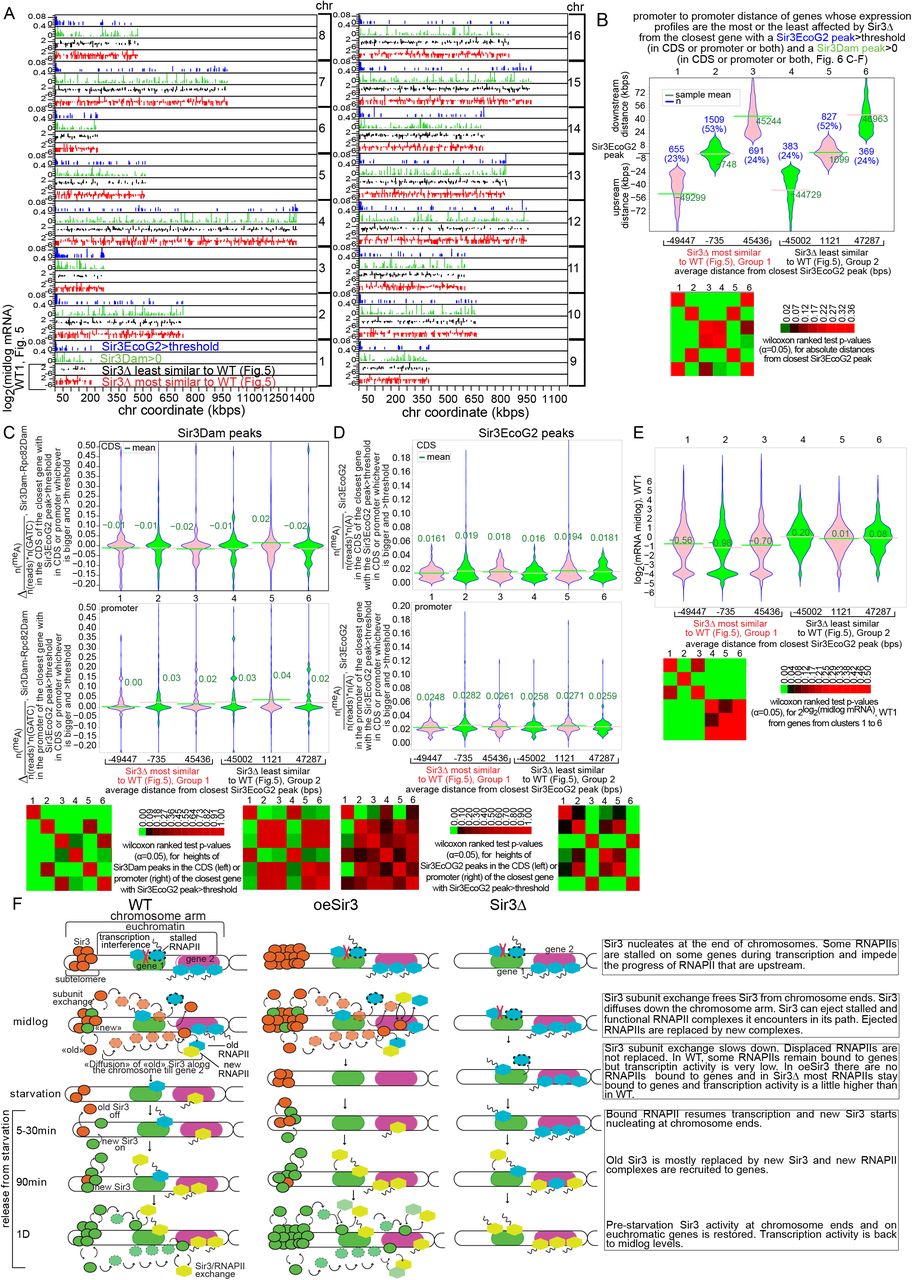
A. Scatter plot of Sir3 contacts 30-40kbps from all 32 chromosome ends measured by Sir3 ChIP-seq (top, from Radman-Livaja et al. (2011)), Sir3EcoG2 foot printing (middle) and Sir3Dam foot printing (bottom). Chromosome ends are aligned by the location of the ACS (ARS Consensus Sequence) motif within the XCS subtelomeric sequence. B. Average Sir3EcoG2 and Sir3 ChIP signals at chromosome ends. The peak at −8kbps from the ACS in the Sir3EcoG2 profile comes from the Yp region in chromosome ends that contain it (see A). Note that Yp regions are highly repetitive and cannot be mapped by ChIP-seq. C. There are 255 genes that are enriched for Sir3Dam methylation:Δ[n(meA) / (n(GATC)*n(reads))]= [[n(meA, Sir3Dam) / (n(GATC)*n(reads))] - [n(meA, Rpc82Dam) / (n(GATC)*n(reads))]]>0, and have a Sir3EcoG2 signal above the threshold determined in Fig. S3C, either in their promoter or CDS or both. Additionally there are 210 genes with a Sir3EcoG2 signal above the threshold that do not have GATC motifs in their promoter, CDS or both that were included in the set of 465 genes that are contacted by Sir3. D. Locations of the 465 genes from C on each chromosome. E. Top: Sir3EcoG2 and Sir3Dam signal distribution in 465 genes from C-D compiled for all chromosome arms. The signal is highest on genes located within the first 4% of the chromosome arm length from the end. Bottom: Density distribution of genes contacted by Sir3EcoG2 and Sir3Dam (from C-D) as a function of distance from chromosome ends. The density of genes contacted by Sir3 is highest within 5 to 20kbps from chromosome ends (the first 15% of the chromosome arm length from the end). F. Bean plot distribution of Sir3Dam signal from 465 genes from C-D after release from starvation.
To differentiate between stable high-density Sir3 association with chromatin from frequent but transient low density Sir3 contacts, we need to use Sir3EcoG2. The density of meA in the Sir3EcoG2 strain, is highest at subtelomeric SIR nucleation sites (XCS) and at the HMR and HML loci. However, not more than 35% of Adenines are methylated (HML and HMR) even in those regions. The meA density around the XCS nucleation site is on average only ~10%, probably because most Adenines are masked by nucleosomes and inaccessible to EcoG2. Thanks to long read nanopore sequencing, Nanopore –MetID with Sir3EcoG2 also revealed a new SIR nucleation site in the repetitive Yp region located 8kbps upstream of the well documented nucleation site in the XCS region (Figure 1A-B). The Yp nucleation site is similar in terms of Sir3 binding to the XCS site with an average meA density of ~10% and SIR spreading of ~2 kbps around the highest meA density peak (Figure 1B). Also, the Yp and XCS nucleation sites seem to be independent of each other as the meA density in the XCS site is not significantly different between chromosome ends that have the Yp site and those that do not (Figure 1A).
The Yp and XCS nucleation sites are methylated in all cells (Figure 1B) and the fraction of cells with at least one meA/400bp gradually decreases down to 80% 30kbps downstream of the XCS nucleation site. The decrease in meA density is more abrupt: it drops from 10% at the XCS sites down to 3% 2kbps downstream of the XCS and then down to 2% 30kbps downstream. Note that the Sir3 ChIP-seq signal reaches background levels by 4kbps downstream of the XCS site, while the meA density in the Sir3EcoG2 strain is still at 3%. This is consistent with our hypothesis that a single-molecule, in vivo foot printing approach would be better at detecting Sir3 contact sites with low Sir3 density. In fact, 0.5% to 1.5% of Adenines in 80% of all 400bps segments in the genome are methylated by Sir3EcoG2 in 80% of cells (Figure S2E). Interestingly, Adenines in the Crick strand are more methylated than As in the Watson strand perhaps reflecting nucleotide accessibility of DNA within nucleosomes. Also as seen for Sir3Dam, promoters are more methylated by Sir3EcoG2 than CDS, with 40% of promoters versus 22% of CDS that have at least one meA in all cells, respectively (Figure S2F).
In summary, our Sir3EcoG2 Adenine methylation profiles of chromosome ends show that Sir3 has two modes of binding to chromatin: high or low density. Sir3 binds at high density ±2kbps around SIR nucleation sites in 100% of cells. Beyond these limits and down to 30kbps downstream, Sir3 still contacts DNA in 95% to 80% of cells but its density drops 3 to 4 fold to levels undetectable by population based ChIP-seq. The two modes of Sir3 association with chromatin can be detected but cannot be differentiated by Sir3Dam foot printing. These three approaches produce complementary maps of genome wide Sir3 association with chromatin: Sir3 ChIP-seq establishes a map of high-density stable Sir3 binding to non-repetitive regions, Sir3Dam Nanopore-MetID produces probabilities of Sir3 contacts with genomic targets, including repetitive regions, but does not discriminate between high density targets and low density binding with high frequency, and finally Sir3EcoG2 Nanopore-MetID provides Sir3 contact maps that delineate regions of high-density Sir3 occupancy and sites of transient low density Sir3 contacts.
To identify low-density gene targets that are specific for Sir3EcoG2 and that are not a product of spurious EcoG2 methylation that is independent of Sir3, we need to define a meA density threshold above which the likelihood of a bona fide Sir3 target is maximized. To do so, we compared Sir3Dam meA probabilities (Figure S1D-E) with Sir3EcoG2 meA densities (Figure S2D and F) in gene promoters and CDS. The strategy was to find a set of Sir3EcoG2 targets with meA densities greater than the critical threshold above which the set becomes enriched for targets that also have a greater than 0 probability of Adenine methylation in the Sir3Dam strain (Supplementary Figure S3). The intersection between Sir3Dam targets with a non-zero meA probability and Sir3EcoG2 targets with a meA density above this threshold should then produce a set of genes that are transiently and specifically contacted by Sir3.
We first sorted all gene promoters (Figure S3A) and CDS-es (Figure S3B) by their Sir3Dam meA enrichment and divided the sorted set into four bins of ~1460 genes, each. We then determined the distribution of Sir3EcoG2 meA density in each bin and observed that the bin with the highest Sir3Dam meA enrichment (bin 4) was also enriched for genes with the highest Sir3EcoG2 meA density. We then compared the distributions of Sir3EcoG2 meA densities in each bin and found the Sir3EcoG2 meA density above which genes from the bin with the highest Sir3Dam meA enrichment (bin 4) become enriched over genes from bins with low Sir3DAM meA enrichments (bins 1-3) (Figure S3C). We thus determined that the meA density threshold for Sir3 dependent Sir3EcoG2 methylation is 0.021 for promoters and 0.017 for CDS-es. We then looked for genes with a Sir3EcoG2 meA density above the threshold either in their promoter or CDS or both that also have a non-zero probability of specific GATC methylation by Sir3Dam in their promoter or CDS or both, and identified 255 genes. We finally added 210 genes with Sir3EcoG2 meA densities above the threshold that do not have GATC sequences in their promoters or CDS and are therefore not marked by Sir3Dam. We thus identified 465 euchromatic genes that are contacted by Sir3 (Figure 1C).
Most of these 465 genes are more or less evenly distributed along each yeast chromosome (Figure 1D). Figure 1E shows the distribution of genes from the set along the chromosome arm and the distribution of their respective Sir3EcoG2 meA density and Sir3Dam meA probability signals. Not surprisingly, considering the proximity to SIR nucleation sites, the first 4% stretch from the end of chromosome arm has the highest density of genes contacted by Sir3 and contains 20% of all genes identified as Sir3 targets. Sir3 levels, measured by Sir3EcoG2 meA density, are also the highest in this area, as expected. The second stretch between 4% and 12% has an intermediate density of Sir3 contacts and contains 7% of the total set of Sir3 targets. The remaining ~70% of the targets are distributed evenly, with perhaps some periodic fluctuation, ranging from 0.1% to 2% of genes from the set per 1% fraction of the chromosome arm length. Sir3 levels are remarkably uniform with a 1% to 6% Sir3EcoG2 meA density at all but the 20% of genes located near chromosome ends. The probability of Sir3 contact, i.e. the Sir3Dam meA probability, is more variable and ranges from slightly above 0 to 20%, but the fluctuations seem independent of the distance from the chromosome end. Overall, the behavior of Sir3 seems to be similar along the nearly entire length of the chromosome arm with the exception of the ~10kbps region at the end that contains the SIR nucleation site(s) and has high Sir3 levels and the ~20kbps region immediately downstream where Sir3 levels are as low as in the rest of the chromosome but the density of gene targets is 2-fold higher.
Sir3EcoG2 and Sir3Dam foot printing revealed that in exponentially growing cells Sir3 makes transient low-level contacts throughout the yeast genome. The number of contacts measured by Sir3Dam Nanopore-MetID drops practically down to zero during starvation and does not recover even 90 minutes after release (Figure 1F). Since nutrient deprivation drastically decreases Sir3 binding, we decided to measure cellular dynamics of Sir3p in these conditions.
Old Sir3p is rapidly degraded upon release from starvation
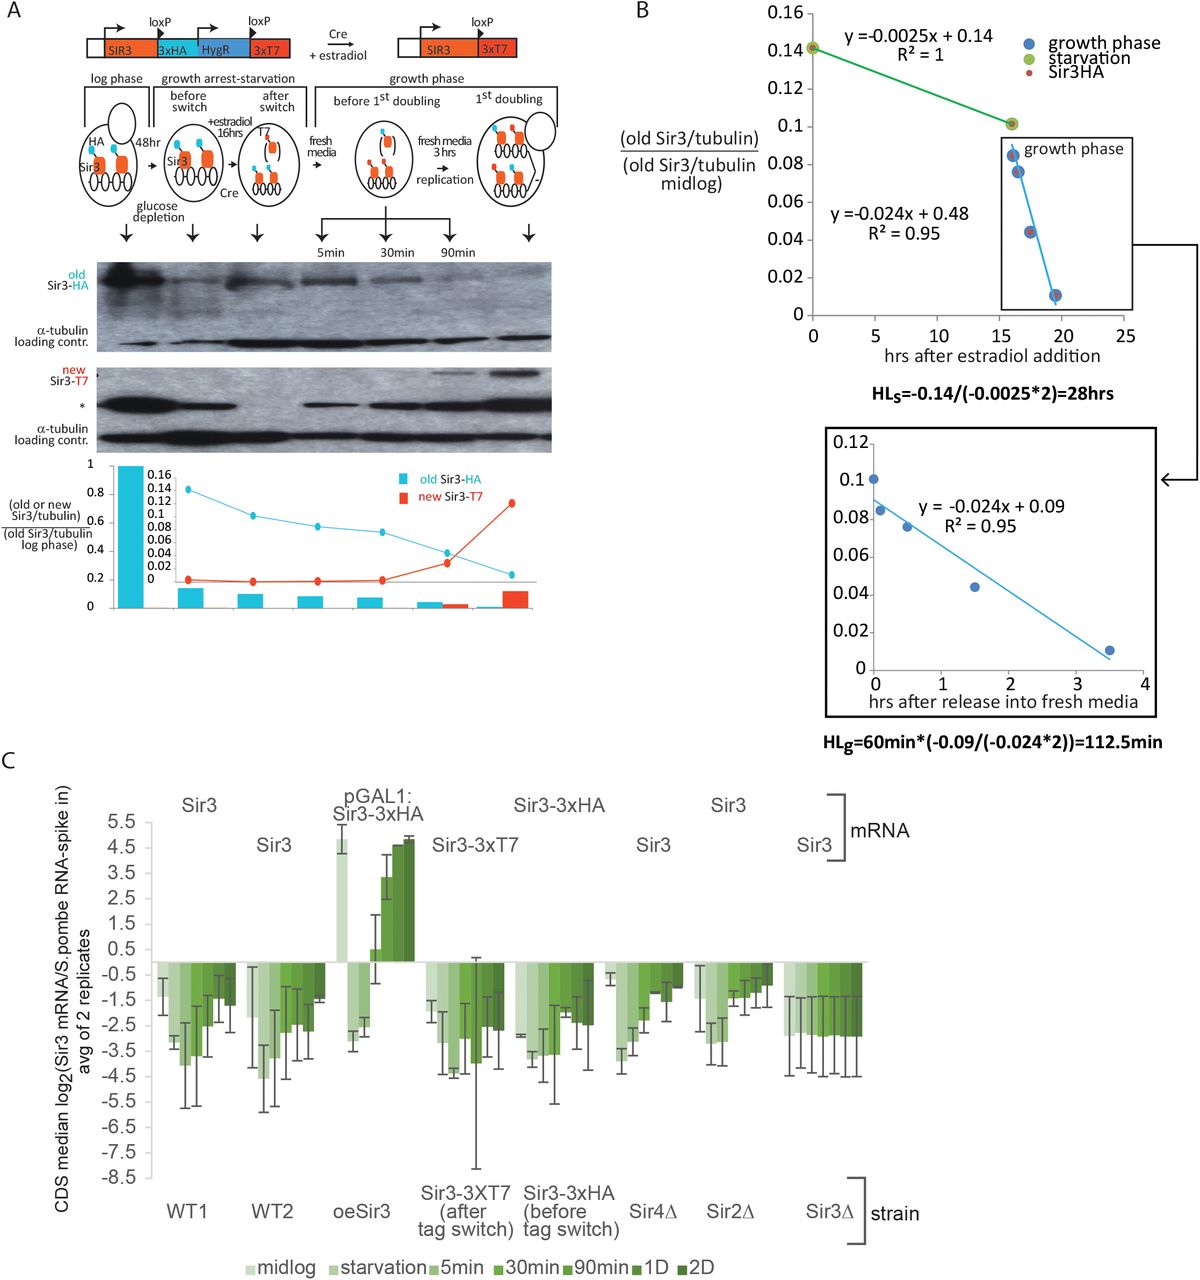
We first wanted to assess bulk Sir3p degradation and synthesis rates during and after release from starvation. We used the RITE system (17) to construct the Sir3p tag switch module. The genomic SIR3 locus was engineered with a C-terminal tag switch cassette containing loxP sites, and the 3xHA and 3xT7 tags separated by a transcription termination signal and the hygromycin resistance gene (Figure 2A). The host strain carries the CreEBD78 recombinase, which is activated upon estradiol addition. After Cre-mediated recombination of LoxP sites, the 3xHA tag on Sir3p is switched to the 3xT7 tag.

A. Western blot of old Sir3p-HA (anti-HA antibody) and new Sir3p-T7 (polyclonal anti T7 antibody) from total cell extracts during and after release from growth arrest. The top panel shows the experimental outline and describes the time points shown in the blot (marked by arrows above the blot). * marks a non-specific band detected with the anti-T7 antibody. The graph below the blot shows the quantification of the bands from the blot. Sir3p band intensities were first normalized to the α-tubulin loading control and then divided by the normalized Sir3p-HA intensity from mid-log cells (bar graph). The line plot inset shows the same normalized Sir3p-HA and Sir3p-T7 band intensities for all time points after midlog. B. Sir3p half-life in growth arrest and after exit from growth arrest. The top plot shows the decrease in Sir3HA band intensity over time from the western blot. Since Sir3 mRNA synthesis is negligible in starved cells, the half-life of Sir3p in growth arrest can be calculated directly from the decrease in Sir3-HA band intensity, according to the equation: HLs=-b/(2*a), where b and a are the y cutoff and slope of the linear fit equation (green line). The half-life of Sir3p after release HLg is calculated with the same equation using the y-cutoff and slope from the linear fit in the bottom plot. C. Sir3 gene expression. Median Sir3 read density enrichment from the RNA-seq dataset from Figure 1 normalized to an external spike-in S. pombe RNA control (from datasets in Figure 6).
A saturated over-night culture was diluted 10 fold in glucose rich media (YPD) and cells were incubated for 48 hrs until they stopped dividing. They were then kept in growth arrest for ~16 hrs after estradiol addition to allow for the tag switch to complete. Whole cell extracts were taken at indicated times during the time course and old (HA tagged) or new Sir3p levels (T7-tagged) were measured by Western blot (Figure 2A).
Old Sir3p levels are reduced down to 14% of their midlog levels after 48hrs of starvation (Figure 2A). The apparent half-life of Sir3p during growth arrest was estimated to be ~28 hrs (Figure 2B), which fully accounts for the 90% decrease in Sir3p levels during the 48 hrs of slowing growth leading to arrest. The drop in Sir3p levels during starvation probably occurs because SIR3 gene expression and Sir3p protein synthesis rates (Figure 2C) decrease more than Sir3p protein decay rates although all three processes are significantly slowed down in starved arrested cells.
Conversely, Sir3p decay rates increase 10 fold immediately after release from starvation and the half-life of old Sir3p drops down to ~110 min from 28hrs during starvation (Figure 2B). Considering that most yeast proteins have a half-life between 60 and 150 min in exponentially growing cells (16), we suspect that old Sir3p is degraded by the usual cellular protein degradation machinery, which probably resumes its activity at pre-starvation rates shortly after release.
The disappearance of old Sir3p proteins below levels detectable by western blot by the time of the first cell doubling is accompanied by a slow and gradual increase in new Sir3p which starts to be detectable around 90 min after release (i.e., 2 hrs before the first doubling) (Figure 2A). Even though SIR3 gene expression of the Sir3p-3xT7 construct (resulting from tag switch recombination) increases gradually after release from arrest, it remains low even by the first division (Figure 2C), which probably explains the delay in new Sir3p appearance on the blot (Figure 2A).
We hypothesize that the rapid decline of Sir3p levels after release from starvation combined with a 90% reduction in Sir3p during starvation could potentially transiently destabilize the SIR complex and impair its silencing function before Sir3p levels are restored at the end of the first cycle after release.
The SIR complex is transiently destabilized upon exit from starvation
Since the dramatic decrease in old Sir3p immediately after release from starvation that is accompanied by slow synthesis of new Sir3p (Figure 2) could compromise heterochromatin formation, we performed the “α-factor assay” to directly test the silencing function of SIR complexes after release from starvation (Figure 3).

A. Amino-acid sequence alignment of the C-terminus of Sir3 with different epitope tags used in this study. The Sir3 strain (WT1) is the parent strain of all the RITE Sir3 tagged strains below. The Sir3-3xHA strain is the RITE strain used throughout the study. The tag switch was not induced in this experiment. All the strains marked with “after tag switch” were selected from their respective RITE strains (the strain listed in the line above the “after the tag switch strain”) after the tag switch was completed. The Sir3-3xHA (-His tag) is another RITE strain with a Sir3-3xHA to 3xT7 switch that does not have a 6xHis linker between the C-terminus and the first LoxP site. The Sir3Dam strain is the strain used in Figures 1 and S1. The linker between the Dam sequence and the C-terminus of Sir3 has 9 Myc tags. B. α-factor heterochromatin stability test. The diagram on top shows the expected response of MATa cells to α-factor added after release from starvation. If the SIR heterochromatic complex is unstable HMLα and HMRa will be transcribed along with MATa, thus creating pseudo-diploid cells that don’t respond to α-factor and consequently do not become shmoo but start budding instead. The images show examples of frames from a live cell imaging experiment that follows Sir3-3xHA, Sir3-3xT7 and Sir3 (WT1) log phase cells or starved cells in the first cell cycle after release in the presence of 0.2 μg/ml α-factor 60 and 420 min after the beginning of the time course. Red arrows: budding cells; White arrows: shmoos. C. The bar graph shows the fraction of budding cells out of the total number of cells (budding and shmoo) for each strain and growth condition from B. and the Sir3Dam strain. The error bars represent the standard deviation from the mean of all the replicates summarized in the table below the graph. P-values for the Wilcoxon ranked sum test (α=0.05) are listed above the corresponding bars in the graph. D. same as C for the remaining set of strains from A that were not shown in B-C. E. α-factor test with the oeSir3p strain which shmoos independently of Sir3p in the presence of α-factor because of the deletion of HML and MAT loci.
MATa (Mating Type a) cells respond to α-factor (mating pheromone α) by arresting in G1 and forming a mating projection termed shmoo. When the HML locus is not fully silenced, cells behave as pseudo-diploids and do not respond to α-factor. These cells therefore keep on budding in the presence of pheromone. Exponentially growing cells predominantly respond to α-factor and shmoo. We thus expected that populations exposed to α-factor upon exit from growth arrest have a higher fraction of cells that do not shmoo. We observed that 52% of cells from the RITE strain used in Figure 2 do not shmoo upon release from growth arrest, which is nearly twice the rate of budding cells in midlog populations (29%) exposed to α-factor.
However, the high proportion of exponentially growing cells that were unresponsive to α-factor was surprising. Suspecting an adverse effect of the 3xHA epitope tag on the stability of the mRNA or the stability or function of the protein, we performed the same experiment using strains with an untagged Sir3 (WT1) and the Sir3 RITE strain isolated after the tag switch (Sir3-3xT7) (Figure 3A-C). Insensitivity to α-factor does increase 20-fold after exit from growth arrest in cells with the untagged Sir3 compared to exponentially growing untagged cells but the overall effect is greatly diminished compared to tagged Sir3p cells since only 3.25% and 0.15% of the cell population released from arrest and midlog cells, respectively, did not shmoo in the presence of α-factor (Figure 3C). Incidentally, the C-terminal Dam fusion in the Sir3Dam strain (Figure 1) has an intermediate effect on SIR function compared to WT and the Sir3-3xHA and Sir3-3xT7 RITE strains, with a 2 fold and 5 fold better response to α-factor than the two RITE strains, respectively (Figure 3C). The degree of insensitivity to α-factor apparently depends on the size and type of the epitope tag and the linker sequence that connects the tag to the C-terminus of Sir3p (Figure 3A). While a triple HA tag substantially reduced HML silencing, the triple T7 tag almost completely obliterated it with 77% and 97% of midlog and starved cells, respectively, insensitive to α-factor. Additionally, the absence of a 6xHis tag in the linker region upstream of the 3xHA and 3xT7 tags impaired Sir3p function even more, while Sir3p with a single HA or T7 tag were both functionally indistinguishable from untagged Sir3p (Figure 3D).
We also confirmed that the increased inability of cells to shmoo upon release from growth arrest was directly linked to the derepression of the HML locus caused by Sir3p instability. Cells that shmoo in log phase in the presence of α-factor irrespective of the presence of Sir3p due to a HMLα/MATa double deletion, also shmoo with 100% efficiency upon release from growth arrest even in the absence of Sir3p (Figure 3E).
Cells resumed budding upon refeeding in the absence of α-factor in the same experimental set up as the α-factor test described above, with an average efficiency of 98% ± 0.9% across all strains tested in Figure 3. This indicates that the triple tags that impair the Sir3 silencing function at silent mating type loci do not otherwise affect the cell’s ability to resume growth after starvation.
Next, we wanted to test if fluctuations in cellular Sir3p levels (Figure 2) and the weakening of the SIR silencing function (Figure 3) after release from starvation correlate with changes in Sir3p levels at silent mating type loci. We consequently used the Sir3-3xHA to 3xT7 and the Sir3 1xT7 to 1xHA RITE strains to measure Sir3p turnover rates at silent mating type loci (Figure S4). Our results show that exchange rates increase dramatically after release from starvation resulting in a complete replacement of old Sir3p with the newly synthesized Sir3p by the end of the first cell cycle after release. Moreover, Sir3p ON and OFF rates are comparable between the triple and single tag strains, suggesting that the dynamics of Sir3p subunit exchange within the SIR complex are not affected by the hypo-morph phenotype of the triple tag. We suspect that the hypo-morph phenotype is a consequence of lower initial SIR occupancy at heterochromatic loci before starvation. The triple tag may either destabilize the mRNA or the protein or interfere with the ability of Sir3p to interact with other SIR complex subunits or with its ability to bind to chromatin. Increased mRNA instability resulting in lower amounts of tagged Sir3p in the cell is however probably not the cause of the increased insensitivity to α-factor in midlog cells since RNA-seq datasets normalized to an external S. pombe RNA spike-in (Figure 6) show that SIR3 mRNA levels are comparable in all three strains during exponential growth (Figure 2C). The decrease in SIR3 mRNA levels during the first cell cycle after exit from starvation is however consistent with the relative increase in α-factor insensitivity during this period compared to midlog cells in all three strains (Figure 2C). On the other hand, Sir3p enrichment at nucleation sites in subtelomeric and silent mating type loci is 6 to 8 fold lower in the 3xHA strain compared to an untagged WT strain (12). The extent of Sir3p spreading from nucleation sites is nevertheless similar between the untagged and tagged strain (Figure S5). This suggests that the triple tag either destabilizes the Sir3 protein and causes an overall decrease in Sir3p levels or impairs its ability to bind to nucleation sites but does not interfere with SIR polymerization.
We conclude that the transient de-repression of the HML locus after release from starvation is directly linked to a decrease in Sir3p occupancy caused by a 10 fold increase in Sir3p OFF and Sir3p decay rates that is not immediately compensated by the recruitment of newly synthesized Sir3p to silent mating type loci.
Sir3p exchange rates in subtelomeric regions increase after release from starvation
Next, we wanted to investigate whether the rapid increase in Sir3p exchange rates upon release from starvation observed at silent mating type loci is a general phenomenon that also affects subtelomeric heterochromatin. We consequently repeated the Sir3p turnover experiment from Figure S4 and processed ChIP-ed DNA for Illumina sequencing. We had to use the triple tag RITE strain for the ChIP-seq experiments as the single tag RITE strain did not yield sufficient amounts of ChIP-ed DNA to produce Illumina sequencing libraries of good quality. However, since the triple tag and the single tag strains had similar Sir3p exchange rates in our ChIP-qPCR experiments, we surmised that the exchange rates obtained from ChIP-seq experiments with the triple tag strain should also be comparable to the Sir3p exchange rates of the untagged Sir3p.
ChIP-seq datasets of old and new Sir3p showed that Sir3p dynamics are similar at all heterochromatic loci, including silent mating type loci and subtelomeric regions (Figure 4 B-D and replicate experiment in Supplementary Figure S6).

A. Diagram of the Sir3p tag switch construct (top left). Bottom: Experiment outline. Cells were arrested by glucose depletion before the tag switch, induced with estradiol addition (recombination efficiency: 98.1%). Cells were then released from arrest with addition of fresh media and allowed to grow for one to five doublings (monitored by OD measurements). Parallel anti-HA and anti-T7 (polyclonal) ChIPs were then performed with cell aliquots that were fixed at times indicated below the diagram. B. Heat map of new Sir3p (T7 tag) enrichment over old Sir3p (HA tag) during and after exit from growth arrest, at all yeast telomeres (30 kbp from chromosomes ends). Time points are aligned by the ARS Consensus Sequence (TEL-ACS) located in telomeric silencer regions of the XCS (SIR complex nucleation sites). White arrows show tRNA genes where new Sir3p binds after exit from growth arrest. New T7 tagged Sir3p appears to be significantly enriched at all but 20 tRNA genes immediately upon release from growth arrest. The biological significance of this binding is not clear as the replicate experiment from Supplementary Figure S6 using a different anti-T7 antibody (a monoclonal one versus the polyclonal used here), while confirming Sir3p-T7 binding to tDNAs, shows enrichment levels that are 8 to 16 fold lower than the ones measured in this experiment. Silent mating type loci HML and HMR, on 3L and 3R, respectively, are framed with a white rectangle. Sir3p is enriched in a small 1kb region upstream of the TEL-ACS at all telomeres. Repetitive and unmapped regions are shown in grey. The HMLα reads have been eliminated as repetitive sequences during alignment to the reference genome which is MATα. C. Old (top left) and new (bottom left) Sir3p enrichment around TEL-ACS averaged for all 32 telomeres at indicated time points during starvation arrest and the renewed growth phase. The right panel shows average enrichment around the TEL-ACS for old and new Sir3p over time with Sir3p on and off rates during growth arrest and during the first cell cycle after release calculated from the slope of the linear fit as shown. D-E. Old and new Sir3p enrichment at HML (D) and HMR (E) at indicated time points (same color code for D and E) during starvation and re-growth after release. The right panel shows average enrichment over the entire silent mating type locus for old and new Sir3p over time with on and off rates as in C. The time points marked replicate 1 and 2 come from two different time-course experiments.
Our measurements of Sir3p ON and OFF rates (see Materials and Methods in the SI Appendix) show that the old Sir3p stays bound to chromatin in arrested cells even after the tag switch because of a slow OFF rate of 4%, 0.6% and 0% decrease in Sir3p-3xHA enrichment per hour and a slow ON rate of 3.5%, 3% and 3.5% increase in Sir3p-3xT7 enrichment per hour for sub telomeres, HML and HMR, respectively (Figure 4 C-E). This results in very slow exchange rates of – 1%/hr, +2.1%/hr and +3.5%/hr for subtelomeres, HML, and HMR respectively. Overall Sir3p enrichment after 64 hrs of starvation relative to the genome average is decreased ~2 to 4-fold compared to the pre-arrest midlog phase as shown in the replicate experiment in Supplementary Figure S6 (B-C). As previously observed in the ChIP-qPCR experiment (Figure S4), old Sir3p completely disappears by the first cell doubling after release into fresh media and is replaced by new Sir3p, due to an increase in ON rates of 45% to 55%, and an increase in OFF rates of 9% to 77% at subtelomeres and silent mating type loci, respectively, compared to Sir3p exchange rates in arrested starved cells (Figure 4C-E). Incidentally, the appearance of new Sir3p on western blots at 90 min after release coincides with the time when new Sir3p occupancy starts exceeding old Sir3p occupancy in subtelomeric regions (Figures 4 and S6). Also of note is that the timing of the appearance of new Sir3p heterochromatic loci is consistent with the absence of transient Sir3p contacts with euchromatic genes for the first 90min after release from starvation (Figure 1F).
The enrichment in new Sir3p reaches steady state after the first division after release resulting in lower Sir3p occupancy relative to values before starvation. New Sir3p enrichment after the 12th doubling is still 3 fold lower than old Sir3p immediately after release and ~7 fold lower than Sir3p in mid-log cells (Figure 4B-C and Supplementary Figure S4B-C).
The observed pattern of Sir3p binding dynamics after exit from starvation suggests that the existing Sir3p is rapidly removed from heterochromatin when cells resume growth before the first cell division and is completely replaced with new Sir3p by the end of the first cycle after release. Sir3p replacement at silent mating type loci is faster than at subtelomeric loci, probably because of the stronger SIR complex nucleation capacity of HML and HMR silencers compared to subtelomeric silencers (Figure 4D-E, Supplementary Figure S6D-E). Subtelomeric heterochromatin is consequently a highly dynamic structure with fast Sir3p exchange rates in optimal growth conditions.
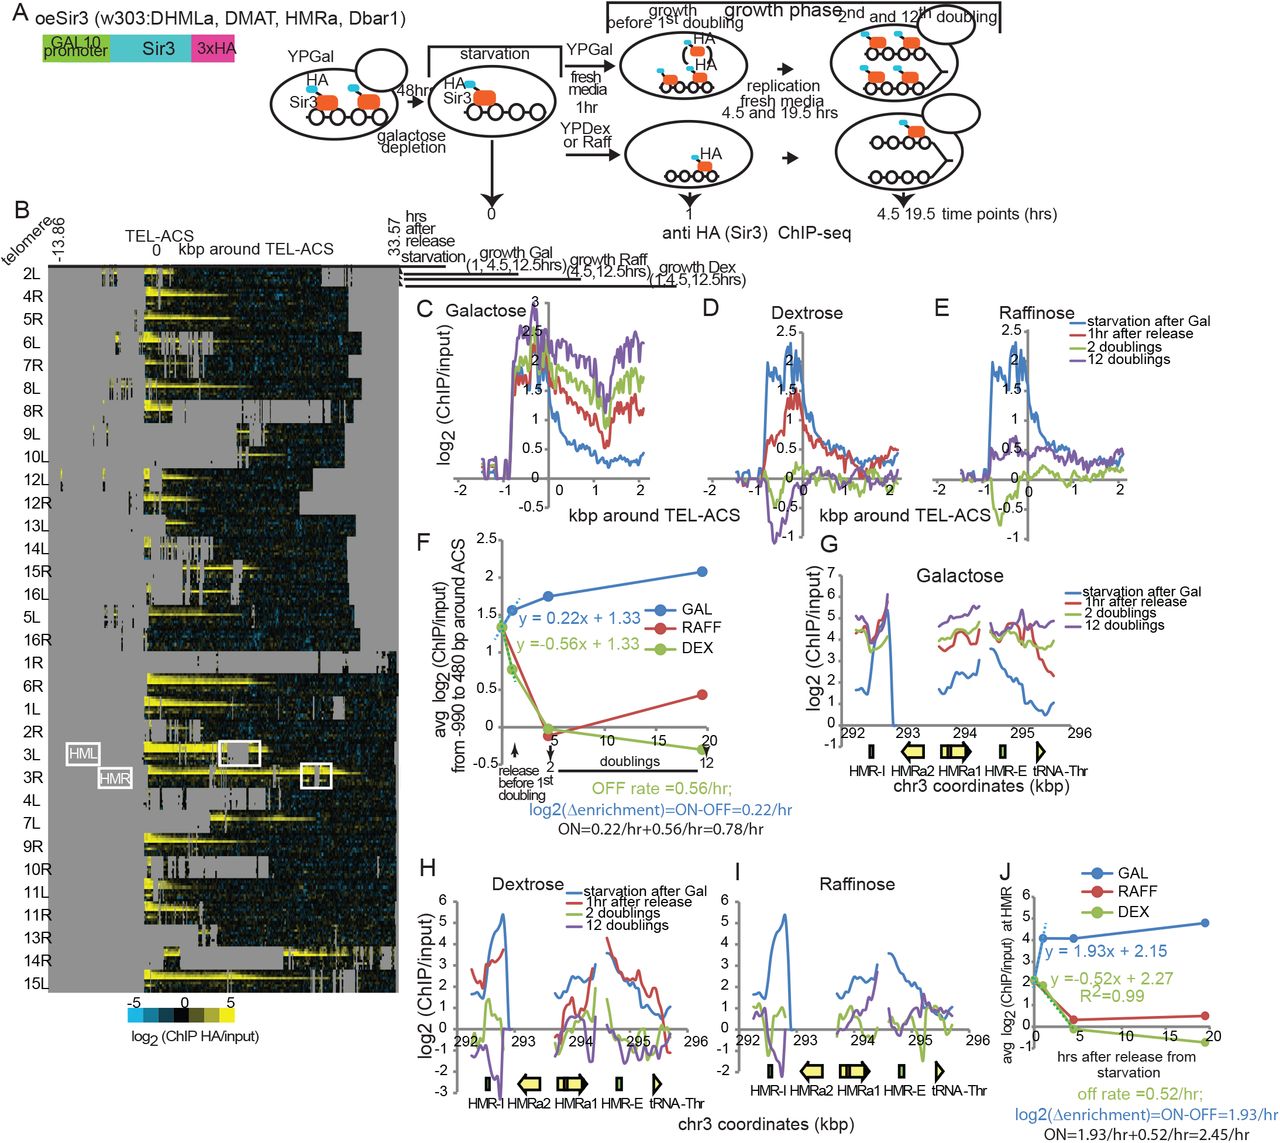
We used the same SIR3 construct with a 3xHA tag under the control of the galactose inducible GAL1 promoter as in (12) to test whether SIR3 dosage has an effect on Sir3p ON or OFF rates (Figure 5A). Cells were first allowed to grow exponentially in galactose to induce high levels of Sir3p synthesis and allow SIR complex formation. Cells were then arrested because of galactose depletion. Since galactose depletion in growth arrest stops Sir3p production and dextrose represses the GAL1 promoter, we can estimate genome-wide Sir3p ON and OFF rates after exit from growth arrest in conditions of SIR3 overexpression simply by performing two parallel ChIP-seq time-courses in cells released from arrest into galactose or dextrose media, respectively. Our results confirm that SIR3 overexpression after exit from growth arrest extends the subtelomeric Sir3p binding domains by as much as 15 kbp, as previously observed for SIR3 overexpression in midlog cells (12) (Figure 5B).

A. Diagram of the Sir3p gene construct controlled by a Galactose inducible promoter in the oeSir3 strain (OverExpression) (top left). Bottom: Experiment outline. Cells were arrested after galactose depletion, released into fresh media with the indicated carbon source (2%), and allowed to grow for 2 and 12 doublings (monitored by OD measurements). Anti-HA ChIPs were then performed with cell aliquots fixed at times indicated below the diagram. B. Heat map of Sir3p (HA tag) enrichment over input during and after exit from starvation, at all yeast telomeres (30 kbp from chromosomes ends). Time points are aligned by the ARS Consensus Sequence (TEL-ACS) in XCS regions as in Figure 4B. Silent mating type loci HML (HML is deleted in this strain) and HMR, on 3L and 3R, respectively, are framed with a white rectangle. Repetitive and unmapped regions are shown in grey. C-E. Sir3p enrichment around TEL-ACS averaged for all 32 telomeres after release into Galactose-over expression of Sir3p (C), Dextrose-inhibition of Sir3p expression (D) or Raffinose-low Sir3p expression (E). F. Average Sir3p enrichment around the TEL-ACS over time in indicated carbon sources. G-I. Sir3p enrichment at HMR after release into Galactose (G), Dextrose (H) or Raffinose (I). J. Average Sir3p enrichment over the entire HMR over time.
Sir3p ON rates at subtelomeres and HMR are respectively 50% and 2-fold higher when SIR3 is overexpressed (Figure 5F and J). Sir3p enrichment has already reached equilibrium 1 hr after release into galactose, suggesting that SIR complex renewal does not directly depend on DNA replication or cell division but is likely driven by the rate of Sir3p synthesis. Sir3p OFF rates on the other hand are comparable between cells with wt Sir3p levels and cells with Sir3p overexpression. It is however important to note that the process of old Sir3p removal occurs independently of Sir3p synthesis as evidenced by the complete disappearance of chromatin bound old Sir3p by the second doubling upon release into dextrose or raffinose in which Sir3p is not produced anymore (Figure 4H, I). In other words, as in starved cells (Figure 2A), the removal of old Sir3p from heterochromatin in growing cells is not “driven” by its replacement with new Sir3p.
Hundreds of genes restart transcription faster in the absence of Sir3 and Sir2
Transitions in and out of stationary phase or starvation induced growth arrest elicit dramatic changes in the cellular transcription program (18, 20, 21). Our results on the effect of Sir3p turnover on SIR complex function (Figure 3) also suggest that heterochromatin is transiently destabilized and heterochromatic genes are temporarily de-repressed immediately after exit from growth arrest. Moreover, Sir3 Nanopore-MetID revealed that Sir3 transiently targets hundreds of euchromatic genes in exponentially growing cells. We consequently decided to investigate how Sir3p dynamics during and after starvation affect genome wide gene expression levels.
In order to be able to directly compare mRNA levels between time points and different yeast strains, we performed duplicate RNA-seq experiments with external “spike in” normalization using RNA from S. pombe as described in Materials and Methods (Figure 6). We decided to take advantage of the Sir3 triple tag hypo-morph phenotype with reduced Sir3p enrichment at heterochromatic loci and measured mRNA dynamics during exit from growth arrest in the following strains: two WT strains with untagged Sir3p (WT1 and WT2), the Sir3-3xHA RITE strain before the tag switch, the Sir3-3xT7 RITE strain after the tag switch, the sir2Δ, sir4Δ and sir3Δ strains, and the SIR3 over expression strain (oeSir3).

A. Heat map of median mRNA enrichment averaged from two biological replicates (normalized to an external spike in control of S. pombe RNA as described in Supplemental Figure S8 and Materials and Methods in the SI Appendix) in indicated strains before and after release from growth arrest for ~5800 yeast genes. Genes were grouped into four clusters based on average mRNA abundance in midlog WT1 cells (bar graph on the left). The Pearson correlation between the time course expression profile in each strain and the WT1 strain was determined for each gene. Genes in each cluster were then ordered by increasing difference between the Sir3Δ correlation to WT1 and the WT2 correlation to WT1 (Δcorrelation(Sir3Δ-WT2)). The gene quartile within each cluster with the most negative Δcorrelation(Sir3Δ-WT2) was considered to contain genes whose expression profiles between Sir3Δ and WT cells were the least similar (marked in black). The gene quartile within each cluster with the Δcorrelation(Sir3Δ-WT2) closest to 0 was considered to contain genes whose expression profiles between Sir3Δ and WT cells were the most similar (marked in red) B. Gene expression profiles were averaged for most and least similar gene quartiles in each cluster. The average profile from two biological replicates of each strain indicated in the strip header on the left (dark blue) is compared to the average expression profile of WT1 (magenta). The shaded blue area around the curve is delimited by average expression values from replicate 1(light blue) and replicate 2 (blue). C. The bar graph shows the rate of increase of global mRNA levels after exit from starvation for all analyzed strains normalized to WT1. It was calculated from the slope of the linear fit of average global mRNA read counts (average of two replicates from Supplementary Figure S5D) versus time (0min, 5min and 30min after release from starvation). D. The bar graphs show the average global mRNA read counts from two biological replicates in Midlog (M) and during Starvation (S) from Supplementary Figure S8D for all analyzed strains normalized as described in Supplementary Figure S8.
In order for “spike-in” normalization to work, we used a constant amount of S. pombe mRNA relative to S. cerevisiae mRNA for each sample, i.e for each time point from each strain. We therefore calibrated pombe mRNA levels relative to cerevisiae mRNA levels by mixing total RNA extracts at a 10:1 weight to weight ratio of cerevisiae to pombe, before the mRNA purification step. We opted for total RNA calibration instead of the alternative method, which consists of mixing cerevisiae and pombe cells at a constant cell count ratio prior to RNA extraction, because we wanted to avoid the variability between samples that could potentially be introduced by mechanical disruption of the cell wall by bead beating. Since starvation conditions change the composition and structure of the cell wall and since seriPAUperin genes, coding for cell wall mannoproteins, are more expressed during starvation and in SIR mutants (23), we reasoned that it would be technically very difficult to control for the variability in the efficiency of cell wall disruption by bead beating between different time points and strains. This could then introduce systematic errors in pombe spikein normalization. We consequently preferred to use total RNA calibration because measurements of the total RNA amount by Qubit fluorescence assays or by Nanodrop spectrometry, and of its composition by BioAnalyzer (Agilent) or LabChIP (Perkin-Elmer) are accurate and reproducible. Since mRNAs represent only ~5% of total RNA and since total RNA is ~80% rRNA, we are essentially using rRNA to calibrate the cerevisiae to pombe total RNA ratio. Figure S7 shows that the rRNA fraction does not vary significantly during the time course in all examined strains. We nevertheless used the information on RNA content obtained from BioAnalyzer/LabChip assays from each total RNA sample to correct for the small differences in rRNA content between different time points and strains by multiplying the measured genome wide average pombe mRNA read density with the correction coefficient calculated as shown in Figure S7 before S. pombe spike-in normalization (see Materials and Methods). We also performed a second normalization to the genome-wide average S.cerevisiae to S.pombe mRNA ratio for the whole time course to account for variability in the total RNA cerevisiae to pombe ratios between replicates and strains (Figure S8).
We identified genes whose gene expression trajectory during the time course is most dependent on the presence of Sir3. First, we divided genes into four clusters according to their average midlog gene expression levels in the WT1 strain. Second, we determined the Pearson correlation between the gene expression time course of WT1 and every other tested strain for each gene. Finally, in order to find the genes whose gene expression profiles in sir3Δ cells were the least similar to WT, we calculated the difference between the sir3Δ|WT1 and WT2|WT1 correlations for each gene (Δcorrelation(sir3Δ-WT2)).We then ordered genes in each cluster by their Δcorrelation(sir3Δ-WT2). Genes in the quartile with the most negative average Δcorrelation(sir3Δ-WT2) in each cluster are the ones whose gene expression across the time course is the least similar between sir3Δ cells and both WT1 and WT2 cells. Conversely, the quartile from each cluster with an average Δcorrelation(sir3Δ-WT2) that is closest to 0 contains genes whose expression in sir3Δ cells is the most similar to either WT strain (Figure 6A).
We found 1584 genes whose gene expression dynamics after exit from growth arrest are the most affected by the absence of Sir3p and Sir2 or by reduced amounts of Sir3p in Sir3-3xHA/T7 RITE strains. The expression profiles of these genes averaged per cluster and per strain show that the main difference between WT and the other strains lies in the speed at which mRNAs return to midlog levels after the drop observed during growth arrest (Figure 6B). It takes on average one whole cell cycle for mRNAs to go back up to midlog levels in both WT strains. This happens much sooner in sir3Δ cells. Typically, mRNA levels are back to pre-starvation amounts only 5 min after release from growth arrest. In Sir3p hypo-morphs - Sir3-3xHA, Sir3-3xT7- and sir2Δ cells, mRNA levels reach a plateau a little later, at the 30 min time point, which is still 4 hrs before mRNAs level off in WT cells. The trajectory of gene expression re-activation in sir4Δ cells appears to by a hybrid between WT cells and SIR3 mutants, with an initial jump in mRNA levels at the 5min time point similar to SIR3 mutants followed by a more gradual rise to midlog levels akin to wt cells. oeSIR3 cells on the other hand follow similar kinetics of reactivation as wt cells despite starting from a ~2 fold lower mRNA baseline during starvation. Moreover, mRNAs are leveling off faster in SIR complex mutants and Sir3p hypo-morphs than in wt cells, even in the quartiles with genes whose expression is the most similar between Sir3Δ and WT cells.
In fact, the genome-wide average rate of gene expression re-activation is 60% higher in sir3Δ, sir3 hypo-morphs and sir2Δ cells compared to WT, oeSIR3 and sir4Δ cells (Figure 6C). Sir3p and Sir2p also participate in global gene expression regulation in starved and midlog cells as evidenced by 30% higher or 40% lower genome-wide average mRNA levels during starvation and exponential growth, respectively, in Sir3 and Sir2 mutants compared to WT and Sir4 deletes (Figures 6D and S8D). Consistent with these observations, overexpression of Sir3p causes a 2-fold decrease and a 14% increase in global mRNA levels, during starvation and midlog growth, respectively. Consequently, it appears that wt amounts of Sir3p and Sir2p are not only needed to delay the resumption of full transcriptional activity till the end of the first cell cycle after release from growth arrest, but are also necessary for global transcription regulation during exponential growth and during growth arrest.
GO annotation analysis shows that genes that are the most affected by suboptimal SIR complex levels are involved in protein transport and localization, nucleotide/nucleoside binding, and Golgi apparatus function. The least affected genes are mostly involved in transcription, RNA processing, ribosome function, and mitochondrial function and respiration (Table S1).
We also looked at subtelomeric genes whose expression is more likely to be directly affected by changing Sir3p levels. Consistent with previous reports (4), the wt levels of the SIR complex do not control the expression of most subtelomeric genes because we found only 16 genes out of 132 in our RNA-seq datasets that were located within 15 kbp of subtelomeric SIR nucleation sites, whose gene expression profiles in SIR mutants and Sir3p hypo-morphs were significantly different from WT cells (Δcorrelation(Sir3Δ-WT2) ≤ −0.35, Figure S9). We observed that midlog expression of some of these genes is somewhat higher in Sir3 mutants, but is overall not significantly different as observed before (4). All 16 genes are however more expressed in the SIR3 mutant strains than in either WT strain during starvation and immediately after release from growth arrest. The increase in expression observed in SIR3 mutants is only temporary and mRNA levels fall back to low midlog levels by the 1st division after release. It consequently seems that the proximity of the SIR complex is not a determining factor for the low expression of subtelomeric genes in optimal growth conditions. The SIR complex is instead needed to slow down transcription reactivation after release from starvation. We speculate that controlled transcription reactivation is needed to delay “full-blown” genome-wide transcription until the cell is ready for a complete reestablishment of its transcription program.
SIR dependent attenuation of transcription of at least some subtelomeric genes in growth arrest and after exit from growth arrest might have been expected because of their proximity to SIR bound loci. The fact that thousands of euchromatic genes located far away from “canonical” SIR loci exhibit a similar SIR dependent delay in transcription re-activation, is however more puzzling.
One possible explanation for the faster reactivation of transcription in the absence of the SIR complex that is consistent with higher mRNA levels during starvation in Sir2 and Sir3 mutants (Figure 6D), is that transcriptional activity does not fully shut down during starvation in these mutants and might therefore be able to restart faster upon release from arrest. If there was still some lingering low-level genome-wide transcription during growth arrest, we reasoned that the apparent mRNA half-lives in SIR mutants and hypo-morphs would be longer than in WT cells. Conversely, Sir3 overexpression would cause a more efficient shutdown of transcription during starvation, resulting in lower global mRNA amounts as observed in Figure 6D and shorter apparent mRNA half-lives than in wt cells. For simplicity sake, we assumed that the decay pattern for most mRNAs is exponential, even though it is most likely more complex for a number of mRNAs (24). Of course, our prediction would only hold if the true mRNA decay rates are the same in all tested strains, which we hypothesized should be the case because they are for the most part determined by mRNA sequence and secondary structure, which are identical in all strains (25). We consequently determined apparent mRNA half-lives during growth arrest using the datasets from Figure 6.
We detect a genome-wide drop in mRNA abundance during growth arrest in all tested strains, as would be expected if global transcription activity has largely stopped during that period (Figures 6D and S10). We calculated apparent mRNA decay rates and half-lives directly from the decrease in mRNA levels from midlog to growth arrest, as shown in Figure S10. Somewhat surprisingly and as opposed to decay rates in midlog cells (25), mRNA decay rates during starvation are directly correlated with midlog mRNA levels: the more an mRNA was abundant before growth arrest the shorter its half-life during growth arrest (Figure S10). As predicted above, apparent mRNA half-lives are globally ~60 to 70% longer in Sir3Δ and Sir3p hypo-morphs compared to wt, and they are two times shorter in the Sir3 over expression strain but they are only marginally affected in Sir2 and Sir4 deletes (Figure S10B).
In conclusion, transcription dynamics in SIR complex mutants before, during and after exit from starvation is consistent with the idea that Sir3 and possibly Sir2 globally stimulate transcription in exponentially growing populations (Figures 6C and S8D) and are involved in the global downregulation of transcription during nutrient deprivation (Figures 6D, S8D and S10B). Higher background transcription during starvation in Sir3 mutants suggests that the transcription machinery remains bound to genes at higher levels in the absence of Sir3, which facilitates a more rapid transcription reactivation when nutrients are restored upon release.
A model for Sir3 mediated global modulation of transcription efficiency
Our RNA-seq results suggest that Sir3 regulates the dynamics of global reactivation of transcription after exit from growth arrest caused by nutrient starvation. Remarkably, more than 99% of genes whose reactivation is delayed in the presence of Sir3 are located in euchromatin far away from previously known Sir3 binding sites and the vast majority of affected genes are not known to be directly or indirectly controlled by the SIR complex. This raises the intriguing possibility that Sir3 regulates gene expression through transient direct contacts with euchromatic genes that were revealed by Sir3 Nanopore-MetID (Figure 1).
The absence of genome wide Sir3 contacts after release from starvation (Figure 1F) suggests that the slower reactivation of transcription after release from starvation in WT compared to Sir3 and Sir2 mutants may be due to Sir3 and possibly Sir2 genome-wide binding activity before the starvation induced growth arrest.
Our results are consistent with the hypothesis that a so far unknown Sir3 activity resulting from its genome-wide contacts with euchromatic genes during exponential growth prior to nutrient starvation influences transcription activity during and after release from starvation. We consequently wanted to see if the Sir3 activity itself was different between genes whose transcription after exit from starvation is the most or the least affected by Sir3 and Sir2 mutations, or if the same Sir3 activity had a different effect on transcription dynamics of these two groups of genes. We consequently looked for differences in the density and/or probability of Sir3 contacts with euchromatic genes identified in Figure 1, depending on whether these contacts are found in proximity of genes whose transcription after exit from starvation is the most or the least affected by Sir3 and Sir2 mutations, i.e., whose transcription dynamics in Sir3Δ are least or most similar to WT, respectively (see Figure 6).
The set of 465 Sir3 targets identified in Figure 1 is 3 to 6 times smaller than the sets of genes whose transcription is the most (1579 genes, Group 2) or the least (2855 genes, Group 1) affected by Sir3 mutations, respectively. As mentioned previously, the criteria that we used to identify Sir3 targets in euchromatin in Figures 1 and S3, were quite stringent because we wanted to minimize the selection of false positives. We, consequently, probably missed a number of Sir3 targets with a shorter Sir3 residency time. Considering that the transcription dynamics of practically all yeast genes appear to be affected by Sir3 mutations albeit to different degrees, the number of identified Sir3 targets is probably an underestimate of the actual number of transient Sir3 contacts with euchromatic genes.
Similar to what we saw for the localization of Sir3 targets along the chromosome, genes from Groups 1 and 2 are distributed homogenously on each chromosome (Figure 7A). Genes from Group 1 are interspersed with genes from Group 2 and do not appear to cluster away from each other in specific location on the chromosome. To further characterize the relationship between Sir3 contact sites and genes from Groups 1 and 2 (least and most affected by Sir3Δ, respectively), we sorted genes from Groups 1 and 2 by their promoter-to-promoter distance from the closest gene contacted by Sir3 from the set identified in Figures 1 and S3 (Figure 7B). Slightly more than half of the genes from the least affected (cluster 2 in Group 1) or the most affected group (cluster 5 in Group 2) are found within 16kbps of the closest gene contacted by Sir3, with an average distance of ~1kbps. There are also no statistically significant differences between clusters that contain genes that are more than 16kbps away from Sir3 targets (compare clusters 1 and 3 in Group 1 with clusters 4 and 6 in Group 2) nor between clusters 2 and 5 that contain genes that are the closest to Sir3 contacts in Group 1 and 2, respectively. This analysis shows that genes from either group are equally likely to be found within or close to regions contacted by Sir3. Likewise, there are no significant differences in Sir3 contact probability or density between Sir3 targets that are close to Group 1 genes (least affected by Sir3Δ) or Group 2 genes (most affected by Sir3Δ) (Figure 7C-D). Sir3 contacts tend to be more frequent (the peaks are higher on average) in regions close to genes from clusters 2 and 5 but this is expected since these clusters include Sir3 targets that are close to chromosome ends, which are more densely packed and have high Sir3 contact probabilities and densities. There is however no statistically significant difference in Sir3 contact probability or density between clusters 2 and 5, again suggesting that Sir3 activity is the same on genes in Groups 1 or 2.
A. Chromosome maps of: 1. WT1 midlog mRNA levels of genes least affected by a Sir3 deletion (most similar to WT, red) 2. WT1 midlog mRNA levels of genes most affected by a Sir3 deletion (least similar to WT, black) 3. Sir3Dam peak height (Δ(n(meA) /(n(reads)*n(GATC)), Sir3Dam-Rpc82Dam) of genes with Sir3Dam>0 in its CDS or promoter, whichever is higher (green).4. Sir3EcoG2 peak height (n(meA) /(n(reads)*n(A)) of genes with Sir3EcoG2_promoter>0.02075 or Sir3EcoG2_CDS>0.018608 (thresholds defined in Fig. S3C), whichever is higher (blue). B. Density plots of distances between promoters of genes that are least (clusters 1-3) or most (clusters 4-6) affected by Sir3Δ and the 465 genes contacted by Sir3 as defined in Figure 6C. Clusters 2 and 5 contain genes that are found within half a Standard Deviation from the mean upstream or downstream of the closest gene contacted by Sir3. C. Density plots of Sir3Dam peak heights (GmeATC probability) in the CDS (top) or the promoter (bottom) of the gene from the 465 gene set contacted by Sir3 that is closest to each gene from clusters 1-6 from B. Since the Wilcoxon ranked sum test excludes negative values, the minimum value in each cluster was subtracted from each value in the cluster to convert all values to positive values. D. As C but for Sir3EcoG2 peak heights, i.e. meA density. E. density plots of WT1 midlog mRNA levels (Figure 6 and A) of genes in clusters 1 to 6 from the top panel. F. A model of the effect of Sir3 contacts on the transcription of underlying genes in midlog and after exit from starvation.
Why does then, a Sir3 mutation have a quantitatively different effect on genes in Group 1 compared to genes in Group 2? A comparison of midlog mRNA levels between the two groups provides a clue (Figure 7E). Genes that appear least affected by a Sir3 deletion (clusters 1-3, Group 1) are enriched for genes with either very low (log2(mRNA)<-3) or very high (log2(mRNA)>3) expression, while genes that appear more affected by Sir3Δ (clusters 4-6, Group 2) are mostly moderately transcribed (−2<log2(mRNA)<2). Taken together, results from Figure 7 show that all genes are equally likely to be contacted by Sir3 but the effect of a Sir3 contact is more pronounced and therefore more “visible” on moderately transcribed genes.
We now propose a model for the genome-wide Sir3 activity that takes into account all the results presented in this study (Figure 7F). We propose that Sir3 (and possibly Sir2) acts as a genome-wide “sweeper” of transcription machinery components and facilitates the turnover of transcription complexes at actively transcribed genes. In our model, subtelomeric regions are reservoirs of Sir3 from which Sir3 molecules diffuse along the chromosome thanks to a steady turnover of Sir3 subunits at chromosome ends. As they diffuse from the end of the chromosome, Sir3 molecules come randomly and transiently into contact with genes along the chromosome arm. Every now and then, Sir3 will “hit” a transcription complex and displace it from chromatin. Note that we use RNAPII as proxy for any transcription associated factor or complex in the illustration in Figure 7F and in the text below. Our current working hypothesis is that Sir3 can evict any transcription associated protein, including transcription factors at promoters. While the displacement of a stalled RNAPII is more likely, because Sir3 is more likely to come into contact with a non-moving target, Sir3 should also be able to displace an actively transcribing RNAPII during its «travels».
In exponentially growing midlog cells the displaced RNAPII can readily be replaced by new RNAPII complexes with minimal disruptions to global transcription. The «sweeping» of stalled RNAPIIs by Sir3 (and Sir2) would even be beneficial because it would allow for the RNAPIIs that are backed up upstream of the stalled complex to resume transcription, which would explain why global midlog mRNA levels are on average ~40% lower in Sir2 and Sir3 mutants compared to wt, oeSir3 and Sir4Δ strains (Figures 6D and S8D). Since Sir3 can potentially sweep away any RNAPII it contacts, indiscriminately, moderately transcribed genes in wt cells will be mostly cleared of RNAPII after a period of starvation when the displaced RNAPIIs cannot be replaced. Cells will therefore require some time after release from starvation to repopulate their RNAPII levels and return to pre-starvation levels of activity. On highly transcribed genes with a high density of bound RNAPII, Sir3 clears up a smaller fraction of bound RNAPII complexes than on moderately transcribed genes. Some of these complexes will stay bound to highly transcribed genes during starvation (and some of them will still be active) and allow for a more rapid reactivation after release from starvation. Consequently, Sir3 mediated sweeping of bound RNAPIIs will have a bigger effect on moderately transcribed genes than on highly transcribed genes. High levels of Sir3 in the oeSir3 strain will result in a more thorough sweeping of bound RNAPII, resulting in genes mostly depleted of RNAPII, thus explaining a 2 fold lower residual transcription during starvation, and a ~14% higher transcription in midlog compared to WT, due to more efficient displacement of stalled RNAPIIs.
In contrast, in the absence of Sir3 in the Sir3Δ strain, all genes will have more bound RNAPII during starvation and transcription reactivation after release will be faster, as observed. Our results suggest that unlike Sir2, Sir4 does not seem to participate directly in the proposed sweeper activity of Sir3. Transcription in Sir4Δ is higher 5 min after release from starvation than in WT, but it subsequently evens out with WT at the 30min time point. Considering that Sir4 facilitates the spreading and improves the stability of the SIR complex in subtelomeric regions but does not prevent the recruitment of Sir3 and Sir2 to nucleation sites(26), it is conceivable that Sir2 and Sir3 would still be able to diffuse from subtelomeric regions to the rest of the chromosome and sweep away, albeit less efficiently, transcription complexes along the way even in the absence of Sir4.
Discussion
Our study sheds light on two long standing questions in yeast heterochromatin biology: 1. How are heterochromatic structures maintained in response to changes in growth conditions and 2. what is the cellular function of subtelomeric heterochromatin.
Our measurements of Sir3p dynamics within heterochromatin after exit from growth arrest show a dramatic increase in Sir3p exchange rates immediately after release from arrest (Figures S4, 4 and S6). We show that Sir3p subunits exchange very slowly during growth arrest and heterochromatin is gradually depleted of Sir3p due to protein degradation, which is also slowed down relative to exponentially growing cells (Figure 2). The supply of fresh nutrients triggers the reactivation of all cellular processes including faster Sir3p protein degradation and faster Sir3p turnover within the SIR complex. Consequently, all Sir3p proteins bound to subtelomeric and silent mating type loci are eventually replaced with newly synthesized Sir3p by the end of the first cell cycle after release. We demonstrate for the first time that budding yeast heterochromatin is a highly dynamic structure that is continuously renewed throughout the cell cycle. Sir3p is therefore probably not epigenetically inherited and does not facilitate the reconstitution of the SIR complex after replication, at least not in the first cell cycle after release from growth arrest. The RITE tag switch system cannot be used to differentiate between replication dependent and replication independent Sir3p dynamics in exponentially growing cells because Cre mediated recombination of epitope tags in at least 95% of cells takes 16 hrs i.e. the duration of 8 to 11 cell doublings. A different strategy that relies on fast and temporally controlled labelling of Sir3p should therefore be used to asses Sir3p dynamics in exponentially growing cells.
Even though the RITE strain with a Sir3-3xHA to Sir3-3xT7 tag switch that we used to measure genome-wide Sir3p exchange rates is a hypo-morph with lower Sir3p enrichment at heterochromatic loci than in WT cells, we show in Figure S4 that the genome-wide Sir3p exchange rates measured in this strain are not significantly different from Sir3p exchange rates measured in a strain that does not exhibit the “hypo-morph” phenotype. Sir3p turnover rates are therefore not dependent on the quantity of Sir3p bound to chromatin. We consequently conclude that the Sir3p dynamics we observe in the Sir3-3xHA to 3xT7 RITE strain are a true reflection of Sir3p dynamics in WT cells in these growth conditions.
The α-factor test for the gene silencing function of the SIR complex revealed that the sudden increase in Sir3p turnover upon exit from growth arrest that follows Sir3p depletion during starvation compromises SIR function at silent mating type loci in a small but significant fraction of the cell population. Rapid Sir3p turnover compounded with the depletion of Sir3p that happened during growth arrest appears to make the SIR complex relatively more permissive to transcription of silent mating type loci. If the supply of new Sir3p is not optimal as in the Sir3p hypo-morphs, SIR dependent silencing of silent mating type loci is 15 to 30 fold less efficient after exit from growth arrest and 200 to 500 fold less efficient in midlog cells compared to WT cells in the same conditions (Figure 3).
We found that the SIR complex directly represses only a small subset of subtelomeric genes and that its silencing activity is mostly apparent in growth arrest and shortly after exit from growth arrest (Figure S9). SIR complex spreading from subtelomeric nucleation sites does not however explain the repression of all documented genes as most of them are located beyond documented heterochromatin boundaries that are positioned ~2kbps beyond nucleation sites (Figure S9). We propose instead that the enhanced repression of these genes immediately after release from starvation is the consequence of a thorough removal of transcription complexes by a Sir3 sweeping activity that is made more efficient by the proximity of SIR nucleation sites from which according to our model in Figure 7F, Sir3 diffuses to the rest of the chromosome.
The currently generally accepted view is that the principal function of heterochromatin is to repress underlying genes whose expression would be potentially deleterious to cellular function and viability. The function of the SIR complex at silent mating type loci in haploid cells aligns itself with that canonical function of heterochromatin: it prevents the simultaneous expression of genes for both mating types and thus enables mating between cells of opposite type. The biological function of the SIR complex in subtelomeric regions has on the other hand long been somewhat of a mystery. Results from this study and others argue against a primary role in the silencing of subtelomeric genes through position effect variegation (4) in exponentially growing cells where the absence of Sir3 has a marginal effect on the expression of most subtelomeric genes (Figures 6 and S9).
Our analysis of gene expression dynamics using RNA-seq with S. pombe RNA “spike in” normalization now reveals wide-spread faster reactivation of transcription of almost all euchromatic genes, immediately after exit from growth arrest in SIR mutants and “hypomorphs” (Figure 6). This result is all the more unexpected, since the vast majority of affected genes are not known to be directly or indirectly controlled by the SIR complex. Our in-vivo foot printing technique Nanopore-MetID did in fact detect transient contacts between hundreds of euchromatic genes located throughout the genome (Figure 1), which led us to hypothesize that transient and sporadic Sir3 contacts with euchromatic genes, which cannot be detected by ChIP-seq, are involved in the global control of gene expression before and after exit from starvation. Sir3 localization to euchromatin is not unprecedented. ChIP-seq experiments have detected Sir3 at highly transcribed genes and euchromatic replication origins (12, 27, 28). While some of the Sir3 signal at highly transcribed genes may be attributed to a ChIP artefact (29), our Nanopore-MetID results suggest that a good number of these genes represent bona fide Sir3 targets.
How would Sir3 be “dispatched” throughout the genome? We propose that SIR nucleation sites at chromosome ends serve as Sir3 hubs where continuous Sir3 subunit exchange during exponential growth provides a steady stream of Sir3 molecules that then diffuse along the chromosome arm and make contact with genes in their path. The Sir3 diffusion model is consistent with our Nanopore-MetID results, which show a gradual decrease in the density of Sir3 contacts that is proportional to the distance from the SIR nucleation site. Considering an average gene density of 1 gene per 2kbp, it follows from the results shown in Figure 1E that ~100% of genes are contacted by Sir3 in the zone up to 20kbps downstream from the nucleation site. Sir3 target density drops to 40% in the following 20kbps and then beyond that point it fluctuates somewhat periodically from 12% to 25% all the way up to the centromere. This distribution of Sir3 targets along chromosome arms would be consistent with a Sir3 diffusion model that would originate at subtelomeric nucleation sites and would be the predominant mode of Sir3 “delivery” up to 40kbps downstream of chromosome ends. The fairly constant density of Sir3 targets beyond that limit, suggests that Sir3 might be brought over to more distal sites through loop formation that bring subtelomeric regions in proximity of regions further away from chromosome ends. These loops may however be difficult to detect if they are short lived. Nevertheless, a few of these bridges have recently been identified by Hi-C in midlog cells when Sir3p was overexpressed (30). It would therefore be interesting to explore this possibility with a more sensitive method than Hi-C, like DamC (31).
The next question is: what does Sir3 do once it contacts euchromatic genes? Our RNA-seq and Sir3Dam/EcoG2 Nanopore-MetID results suggest that the rate of transcription reactivation after release from starvation is influenced by genome-wide Sir3 binding during exponential growth before the onset of starvation. Indeed, Sir3 contacts with euchromatin are reduced below the detection threshold for at least 90min after release from arrest or practically for the entire time it takes for the transcription program to get back to midlog levels (Figure 1F). Consequently, it is while nutrients are still available and cells are still dividing that the Sir3 activity in euchromatin determines how fast genes will be reactivated after global transcription has been shut down because of nutrient shortage. So, Sir3 is doing something to transcribing genes that generally improves the efficiency of transcription genome-wide in exponentially growing cells (Figure 6D), but decreases residual transcription during starvation (Figures 6D and S8B) and finally slows down reactivation of transcription after release from starvation (Figure 6C). These processes respond to Sir3 dosage since mRNA levels are respectively higher or lower in midlog or during starvation, and transcription reactivation is slightly slower after release in oeSir3 cells relative to wt. Our hypothesis that Sir3 acts as a general purpose “sweeper” of transcription complexes would be consistent with all these observations. Sir3 possibly in conjunction with Sir2 would periodically and randomly clear out all or a fraction of bound proteins, depending on the expression level of the underlying gene. Since this kind of indiscriminate sweeping would also remove stalled transcription complexes it would generally improve transcription efficiency in conditions of optimal growth when new complexes are readily available to restart transcription. The complexes that were cleared out by Sir3 towards the end of the growth phase should not be replaced during starvation, which explains lower residual transcription in starved wt cells compared to Sir3Δ. It would then take some time for new transcription complexes to rebind after nutrients are replenished, resulting in generally slower transcription reactivation. In the absence of Sir3 on the other hand transcription complexes should not be cleared out as efficiently and would still stay bound to genes during starvation, causing transcription to jumpstart as soon as nutrients become available again.
The molecular mechanisms underlying the “sweeper” activity of Sir3 are not known at this stage. Sir3 has both a histone and a DNA binding activity and while H4K16Ac, H3K4me and H3K79me have a negative effect on Sir3 binding affinity (26), the presence of these modifications in transcribing genes doesn’t not exclude the possibility of a transient Sir3 contact. Whether Sir3 can displace transcription complexes on its own or whether it requires additional factors for its “sweeper” activity is obviously an open question that requires further study.
Whether the “sweeper” activity of Sir3 improves transcription efficiency enough to give wt cells a competitive advantage over Sir3 mutants and increase fitness during exponential growth or whether this activity is more or equally important for the controlled slow reactivation of transcription after starvation is not known. While the need for a mechanism that facilitates the elimination of non-functioning stalled transcription complexes from chromatin seems obvious for optimal growth, the necessity to control the speed at which transcription is reactivated after growth arrest may seem less evident. One could nevertheless imagine that a controlled and gradual restart of cellular processes is preferable to an uncoordinated “every gene for itself” approach. Since, according to our model, Sir3 removes only a portion of gene bound transcription complexes, genes that were highly transcribed in midlog such as ribosomal protein genes or genes involved in cellular metabolism, will be reactivated faster than genes that were moderately transcribed because they would have kept more transcription complexes during starvation than moderately expressed genes. Consequently, the expression of moderately transcribed genes that are mostly not essential for restarting cell growth after starvation would be naturally delayed, which would allow highly transcribed genes involved in transcription, translation and metabolism to have sufficient quantities of newly available nutrients to jump-start cell growth. Radonjic et al. (18) have identified 769 transcripts that were induced more than 2 fold within 3 min after exit from stationary phase and that are mostly involved in transcription and protein synthesis. We find 41% and 25% of those transcripts in the group least and the group most affected by Sir3 mutations, respectively, which is consistent with the idea that the Sir3 “sweeper” activity disproportionally affects the reactivation of genes that are not immediately needed to restart growth.
Thanks to our three-pronged approach of measuring Sir3 exchange rates using ChIP-seq and Sir3 dependent changes in mRNA levels using spike-in RNA-seq, and mapping genome-wide transient Sir3 binding using Nanopore-Metd ID, we were able to uncover a new role for Sir3 in the regulation of gene expression and demonstrate that yeast heterochromatin is a highly dynamic structure whose activity influences transcription on a global scale. The future challenge of chromatin biology research will be to expand our understanding of the dynamics of chromatin structure maintenance and renewal that goes beyond the information typically afforded by classical single-point ChIP-seq experiments. In light of our study, we now need to start including transient/unstable associations between proteins and DNA into our catalogue of protein-DNA interactions with a biological function, if we want to fully understand how chromatin shapes transcription programs and cellular phenotypes in response to environmental or developmental cues.
Materials and Methods
Detailed Experimental Procedures are listed in the SI Appendix.
Yeast Strains
Genotypes and strain construction are described in the SI Appendix.
Sir3 Nanopore MetID cell cultures and genomic DNA preparation for nanopore sequencing
For midlog cultures, cell were grown overnight until they reached saturation (OD>1). For the release from starvation time course (Figure 1F), cells were grown for 72hrs, an aliquot was taken for the starvation time point. Cells were then pelleted and resuspended in fresh YPD and aliquots were then taken at indicated times and pellets were kept on ice until spheroplasting.
Pelleted cells w counted and divided into aliquots of 109 cells, the amount needed for one sequencing run. Pellets were then spheroplasted with Zymolyase and genomic DNA was extracted with the MagAttract HMW DNA Kit (Qiagen) according to the manufacturer’s protocol. Nanopre sequencing libraries were prepared with the Rapid Barcoding Kit (Oxford Nanopore), according to the manufacturer protocol. The library mix was loaded on the R9.4.1 Flow cell (Oxford Nanopore) and sequenced with the Minion device (Oxford Nanopre).
Cell culture for release from starvation
Cells were kept at 30°C in rich media for 48 hrs after a 10 fold dilution with fresh YPD media of a saturated overnight culture, until carbon source depletion caused growth arrest, as described in the SI Appendix. For the tag switch experiments estradiol was added and cells were incubated for another 16 hrs before release. For the experiments without tag switch cells were released into fresh media after 72 hrs and fixed with formaldehyde at indicated time points.
Microscopy and image analysis
Cells were injected under a 0.8% agarose/growth media layer in 8-well glass bottom microscopy plates (BioValley) and visualized with a Nikon Ti2 Eclipse widefield inverted microscope in the triple channel LED DIC mode.
Chromatin Sonication and ChIP
Cell walls were mechanically disrupted and the entire cell lysate was sonicated. ChIPs were done as described in the SI Appendix using anti-HA (Abcam, ab9110 (lot# GR3245707-3) and polyclonal anti-T7 (Bethyl A190-117A (lot# A190-117A-7) (Figure 4) or monoclonal anti-T7 (Cell Signaling Technology, DSE1X (lot#1)) (Supplementary Figure S6). Purified DNA was treated with RNAse A and used for NGS library construction.
RNA isolation and RNA-seq library construction
Cells were flash frozen in liquid N2 and total RNA was isolated from frozen cell pellets with Trizol and treated with DNAseI. RNA samples were then used for NGS library preparation with the Illumina TruSeq Stranded mRNA kit or the Illumina Stranded mRNA Prep Ligation kit according to the manufacturer’s protocol. Libraries were sequenced on the Illumina NextSeq550 (2×75bp) (Plateforme Transcriptome, IRMB, Montpellier, France) or NovaSeq 6000 (2×75bp) (Illumina) at the CNAG, Barcelona.
NGS Input and ChIP library construction and Illumina sequencing
DNA fragments were blunt ended and phosphorylated with the Epicentre End-it-Repair kit. Adenosine nucleotide overhangs were added using Epicentre exo-Klenow. Illumina Genome sequencing adaptors with in line barcodes were then ligated using the Epicentre Fast-Link ligation kit. Ligated fragments were amplified using the Phusion enzyme Library pools were sequenced on the HiSeq 2000 (2×75bp) (Illumina) at the CNAG, Barcelona, Spain or the NextSeq 550 (2×75bp) (Plateforme Transcriptome, IRMB, Montpellier, France).
ChIP-seq and RNA-seq data analysis
Sequences were aligned to the S. Cerevisiae genome with BLAT (Kent Informatics, http://hgdownload.soe.ucsc.edu/admin/). Read count distribution was determined in 1bp windows and then normalized to 1 by dividing each base pair count with the genome-wide average base-pair count.
RNA-seq normalized read densities for each gene were aligned by the transcription start site and divided into sense and antisense transcripts. The median read density was determined for each transcript as above and normalized to the genome average read count of the S.pombe spike-in, as described in the SI Appendix and Figure S8. Intron regions were excluded from the calculation.
Sir3 Nanopore-MetID nanopore sequencing data analysis
Basecalling, demultiplexing and aligning to the S.cerevisiae genome was performed with the guppy software from Oxford Nanopre. Fastq files and Modification probability tables were extracted from basecalled fast5 files using the ont-fast5-api package. Adenines with a methylation probability higher or equal to 0.75 were considered as positive signals.
Data availability
NGS and ONT (Oxford Nanopore Technology) datasets were submitted to the NCBI GEO database. GEO accession numbers for ChIP-seq and RNA-seq datasets are
Author Contributions
PB and AH performed experiments in Figures 3 and 6, PB performed the experiments in Figure S7, and HG performed experiments in Figures 2, 4, 5, S4 and S6. AC and LD performed the experiments from Figures 1, S1 and S2 and PV performed the microscopy in Fig 3E. MRL, PB, AH, HG and AC designed the experiments, MRL analyzed the data and wrote the manuscript.
Acknowledgments
We thank Fred van Leeuwen, Kevin Struhl and Laure Crabbe for yeast strains and plasmids. Thank you to Marta Gut and Julie Blanc from CNAG (Barcelona, Spain) and Véronique Pantesco (IRMB, Montpellier, France) for deep-sequencing services. We thank Virginie Georget and Leslie Bancel-Vallée (MRI, Biocampus, Montpellier) for their assistance with the microscope set-up. Thanks to Sylvie Fromont and Christelle Anguille (MGC platform, IGMM-CRBM, Montpellier) for the LabChip experiments. Thank you to Fabrice Caudron for critical reading of the manuscript. Two previous versions of this article are part of the doctoral theses “Heterochromatin dynamics upon release from growth arrest in budding yeast” by Hrvoje Galiċ and “Functional analysis of heterochromatin dynamics after exit from growth arrest in budding yeast” by Ana Hrgovčić. This work was supported by the ERC-Consolidator (NChIP 647618) (MRL) and Canceropole GSO_Emergence 2020 (NanoRep-MetAID; n°2020-E11; MRL) grants.
Footnotes
We added Sir3 in-vivo foot printing results.
References


