

Abstract
In all cells, progression through the cell cycle occurs only when sufficient growth has occurred. This fundamental linkage shows that cells can measure growth, but the underlying mechanisms are poorly understood. Here, we investigate how budding yeast cells measure growth. Cells that lack the related kinases Gin4 and Hsl1 show excessive bud growth during a prolonged cell cycle delay, which suggests that they fail to detect bud growth. Moreover, Gin4 and Hsl1 undergo hyperphosphorylation that is proportional to bud growth and dependent upon binding to anionic phospholipids that are delivered to the growing bud. Gin4 and Hsl1 have previously been shown to relay signals that control both cell growth and cell cycle progression. Together, the data suggest that addition of phospholipids to the plasma membrane generates a gradually increasing signal that triggers cell cycle progression when sufficient growth has occurred. The data further suggest that control of cell size and cell growth are mechanistically linked.
Introduction
Key cell cycle transitions occur only when sufficient growth has occurred. To enforce this linkage, cells must convert growth into a proportional signal that triggers cell cycle progression when it reaches a threshold. The molecular mechanisms by which cells generate proportional signals that are used to measure and limit growth have remained deeply mysterious.
In budding yeast, growth occurs in three distinct intervals that are characterized by different rates and patterns of growth (Johnston et al., 1977; McCusker et al., 2007; Goranov et al., 2009; Ferrezuelo et al., 2012; Leitao and Kellogg, 2017). The first interval occurs during G1 phase and is characterized by uniform growth over the cell surface. The second interval is initiated at the end of G1 phase as a new daughter cell emerges and undergoes polar growth. The third interval is initiated at entry into mitosis and is marked by a switch from polar bud growth to isotropic growth that occurs more widely over the bud surface. Bud growth continues throughout mitosis. The distinct size and shape of a yeast cell is ultimately defined by how much growth occurs during each of these intervals.
Several observations suggest that the two intervals of bud growth are tightly controlled (Leitao and Kellogg, 2017). First, a newborn daughter cell that is initiating bud emergence at the end of G1 phase typically has gained 80% of its volume during bud growth in the previous cell cycle. Little growth occurs during G1 phase. Furthermore, most bud growth occurs during mitosis, and the rate of growth in mitosis is approximately 3-fold faster than the rate of growth during the other intervals. Together, these observations suggest that maintenance of a specific cell size requires tight control over the duration and extent of bud growth.
Additional evidence that bud growth is tightly controlled comes from analysis of the effects of nutrients on cell growth and size. Shifting cells from rich to poor nutrients causes a reduced growth rate, as well as a large reduction in cell size (Johnston et al., 1977; 1979). This proportional relationship between growth rate and cell size appears to hold across all orders of life. In budding yeast, a shift to poor nutrients has little effect on cell size at completion of G1 phase (Bean et al., 2006; Leitao and Kellogg, 2017). Furthermore, mutant cells that lack all known regulators of cell size in G1 phase show robust nutrient modulation of cell size (Jorgensen and Tyers, 2004a). In contrast, poor nutrients cause a large decrease in the extent of growth in both metaphase and anaphase, which causes daughter cells to complete cytokinesis at a substantially reduced cell size (Hartwell and Unger, 1977; Leitao and Kellogg, 2017). Furthermore, the duration of the metaphase and anaphase growth intervals is increased in poor nutrients, which suggests that cells compensate for slow bud growth by increasing the duration of growth (Leitao and Kellogg, 2017). These observations point to the existence of mechanisms that measure and modulate both the duration and extent of bud growth during mitosis.
A model in which the extent of bud growth is tightly controlled requires a molecular mechanism for measuring growth. In previous work, we found evidence that polar growth of the bud before mitosis is measured via growth-dependent hyperphosphorylation and activation of the protein kinase Pkc1 (Anastasia et al., 2012). The data suggest a model in which the vesicles that drive polar growth of the plasma membrane carry signaling molecules that drive activation of Pkc1 at the site of membrane growth, thereby generating a signal that is proportional to the extent of growth. Here, we searched for proteins that could play a similar role in measuring growth during mitosis. A candidate search identified 3 related kinases: Gin4, Hsl1 and Kcc4. We refer to these as Gin4-related kinases. Similar kinases are found in all eukaryotes. Observations reaching back over 30 years have suggested that Gin4-related kinases play critical roles in control of cell growth and size (Young and Fantes, 1987; Altman and Kellogg, 1997; Ma et al., 1996a; Okuzaki et al., 1997; Barral et al., 1999). For example, loss of Gin4-related kinases in budding yeast causes a prolonged metaphase delay (Altman and Kellogg, 1997; Ma et al., 1996a; Barral et al., 1999). Growth continues during the delay, resulting in aberrant growth of very large cells (Altman and Kellogg, 1997; Okuzaki et al., 1997; Barral et al., 1999). Thus, cells that lack Gin4-related kinases behave as though they cannot detect that growth has occurred during mitosis. Gin4-related kinases are localized to the bud neck throughout bud growth, so they are well-positioned to control growth (Barral et al., 1999; Longtine et al., 2000; Okuzaki et al., 1997). Moreover, we previously found that Gin4 undergoes gradual hyperphosphorylation and activation during bud growth that reaches a peak in late mitosis as growth ends (Altman and Kellogg, 1997). This discovery suggests that hyperphosphorylation and activation of Gin4 could provide a proportional readout of the extent of bud growth. To test this hypothesis, we investigated the relationship between Gin4-related kinases and bud growth.
Results
Hyperphosphorylation of Gin4 and Hsl1 is proportional to the extent of bud growth
Gin4 and Hsl1 are the most important Gin4-related kinases in budding yeast. Loss of either kinase alone causes defects in control of bud growth, whereas loss of both causes severe defects (Barral et al., 1999; Longtine et al., 2000). Loss of Kcc4 has little effect. We therefore focused on Gin4 and Hsl1. In previous work we discovered that Gin4 undergoes gradual hyperphosphorylation and activation during bud growth, which suggested that it could be responding to growth-dependent signals (Altman and Kellogg, 1997). To investigate further, we first tested whether hyperphosphorylation of Gin4 and Hsl1 is proportional to bud growth. To do this, we took advantage of the fact that the duration of bud growth in mitosis is increased when cells are growing slowly on a poor carbon source, even as the extent of growth is reduced (Leitao et al., 2017). Thus, cells growing in poor carbon spend more time growing in mitosis, but complete mitosis at a reduced daughter bud size. Therefore, if hyperphosphorylation of Gin4 and Hsl1 is proportional to bud growth, the time required to reach full hyperphosphorylation should be increased in cells growing in poor carbon.
Wildtype cells growing in rich carbon (2% glucose) or poor carbon (2% glycerol, 2% ethanol) were released from a G1 arrest and phosphorylation of Gin4 and Hsl1 was assayed by western blot to detect phosphorylation events that cause electrophoretic mobility shifts. The same samples were also probed for the mitotic cyclin Clb2 as a marker for mitotic duration. Cells growing in poor carbon showed delayed mitotic entry and a prolonged mitosis compared to cells growing in rich carbon, as previously described (Fig. 1, A and B) (Leitao and Kellogg, 2017). Previous work has shown that Gin4 is present throughout the cell cycle, while Hsl1 is synthesized anew before mitosis and destroyed at the end of mitosis (Altman and Kellogg, 1997; Barral et al., 1999). In both carbon sources, hyperphosphorylation of Gin4 and Hsl1 increased gradually during mitosis, with peak phosphorylation occurring near peak Clb2 levels. In addition, the interval during which hyperphosphorylation occurred was prolonged in poor carbon, consistent with the hypothesis that hyperphosphorylation of Gin4 and Hsl1 provides a readout of the extent of bud growth.

Wild type cells grown overnight in YPD (A) or YPG/E (B) were arrested with α factor. The cells were then released from the arrest at 25°C and samples were taken at 10 min intervals. The behavior of Gin4, Hsl1-6XHA and Clb2 was assayed by western blot. (C) A direct comparison of the maximal extent of Gin4 phosphorylation in rich or poor carbon was made by comparing samples taken at peak Clb2 expression in each condition (90 min in rich carbon and 140 min in poor carbon). An anti-Nap1 antibody was used as a loading control.
We also noticed that the maximal extent of phosphorylation of Gin4 and Hsl1 was reduced in poor carbon (Fig. 1, A, B and C). Thus, cells in poor carbon progress through mitosis with less hyperphosphorylation of Gin4 and Hsl1 than cells in rich carbon, which suggests that the maximal extent of hyperphosphorylation of Gin4 and Hsl1 reached during mitosis is proportional to the growth rate set by the carbon source. One interpretation of this observation is that the extent of hyperphosphorylation of Gin4 and Hsl1 required for mitotic exit is reduced in poor carbon, which allows cells to complete mitosis at a smaller bud size.
Hyperphosphorylation of Gin4 is dependent upon bud growth
We next tested whether hyperphosphorylation of Gin4 is dependent upon bud growth. To do this, we used a temperature-sensitive allele of SEC6 (sec6-4) to block bud growth. Sec6 is a component of the exocyst complex, which is required at the plasma membrane for docking and fusion of vesicles that drive bud growth. In previous work, we showed that inactivation of Sec6 blocks bud growth and triggers an arrest in early mitosis (Anastasia et al., 2012). The arrest is enforced by Swe1, the budding yeast homolog of the Wee1 kinase that phosphorylates and inhibits mitotic Cdk1. Thus, sec6-4 swe1Δ cells fail to undergo bud growth yet enter mitosis and complete chromosome segregation before arresting in late mitosis. We therefore analyzed Gin4 phosphorylation in sec6-4 swe1Δ cells, which allowed us to distinguish whether effects of sec6-4 were a consequence of a failure to undergo bud growth, or a failure to enter mitosis. As controls, we also analyzed Gin4 hyperphosphorylation in wild type and swe1Δ cells.
Cells were released from a G1 arrest and shifted to the restrictive temperature for the sec6-4 allele before bud emergence. Gin4 phosphorylation was assayed by western blot (Fig. 2 A). The same samples were probed for Clb2 as a marker for mitotic progression (Fig. 2 B). The sec6-4 swe1Δ cells entered mitosis but arrested in late mitosis with high levels of mitotic cyclin, as previously reported (Anastasia et al., 2012). Hyperphosphorylation of Gin4 failed to occur in the sec6-4 swe1Δ cells (Fig. 2, A and C). Direct comparison of the extent of Gin4 hyperphosphorylation in mitosis showed a complete loss of Gin4 phosphorylation (Fig. 2 C). Thus, hyperphosphorylation of Gin4 is dependent upon membrane trafficking events that drive bud growth.
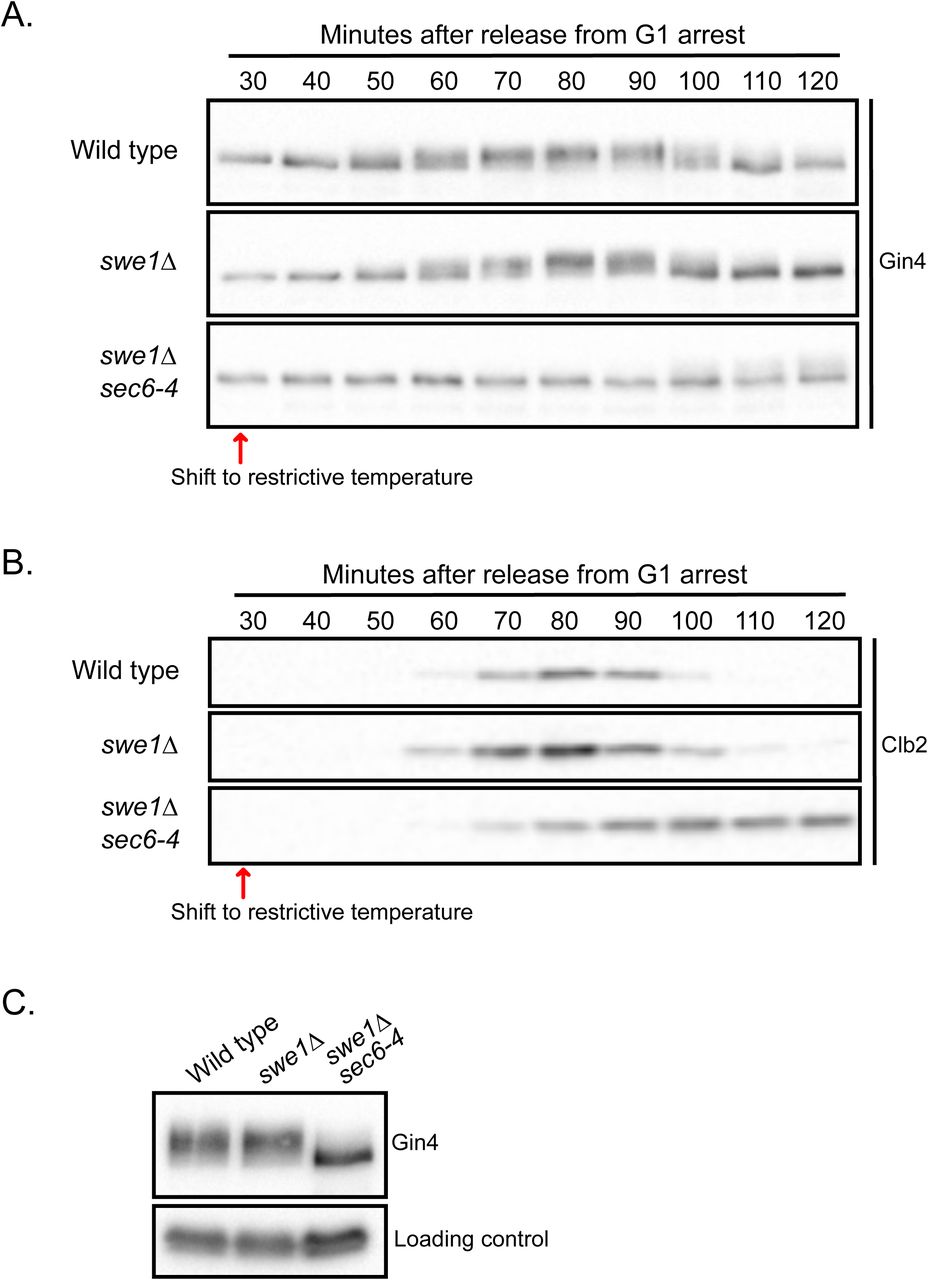
Wild type, swe1Δ and swe1Δ sec6-4 cells were released from a G1 arrest in YPD at room temperature and shifted to the restrictive temperature (34°C) 30 min after release from arrest. Samples were taken at the indicated intervals and the behavior of Gin4 (A) and Clb2 (B) was analyzed by western blot. (C) A direct comparison of the extent of Gin4 phosphorylation was made by loading samples from all three strains taken at 90 min (wild type), 80 min (swe1Δ) and 100 min (sec6-4 swe1Δ).
Gin4 and Hsl1 are required for normal control of bud growth during mitosis
We next investigated whether Gin4 and Hsl1 are required for normal control of daughter cell growth in mitosis. Previous studies found that loss of Gin4 and/or Hsl1 causes prolonged bud growth during a mitotic delay, consistent with the hypothesis that Gin4 and Hsl1 play a role in growth sensing (Ma et al., 1996b; Altman and Kellogg, 1997; Barral et al., 1999). However, previous studies were carried out with gene deletions, which made it difficult to discern whether loss of growth control was an immediate and direct consequence of loss of Gin4 or Hsl1. We therefore created auxin-inducible degron (AID) versions of Gin4 and Hsl1, which allowed us to analyze the immediate effects of conditional inactivation (Nishimura et al., 2009). A strain carrying AID-tagged versions of both GIN4 and HSL1 had no size defects in the absence of auxin (Fig. S1 A). Addition of auxin before mitosis in synchronized cells caused a large reduction in levels of Gin4-AID protein within 30 minutes (Fig. S1 B), as well as a delay in mitotic progression (Fig. S1 C).
Gin4 and Hsl1 control Swe1, which undergoes complex regulation in mitosis (Harvey et al., 2011; 2005). In early mitosis, Cdk1 phosphorylates Swe1 on Cdk1 consensus sites, which activates Swe1 to bind and inhibit Cdk1. This form of Swe1, which we refer to as partially hyperphosphorylated Swe1, works in a systems-level mechanism that maintains a low level of Cdk1 during metaphase. Further phosphorylation events drive full hyperphosphorylation of Swe1, leading to release of Cdk1 and inactivation of Swe1. Swe1 is proteolytically destroyed at the end of mitosis; however, mutants that block Swe1 destruction have no effect on mitotic progression, so the function of Swe1 destruction remains unknown (Thornton and Toczyski, 2003; Raspelli et al., 2011).
A previous study suggested that hsl1Δ causes defects in phosphorylation of Swe1 (Shulewitz et al., 1999). Here, we found that conditional inactivation of gin4-AID and hsl1-AID before mitosis in synchronized cells caused a failure in full hyperphosphorylation of Swe1 (Fig. 3 A). Similarly, addition of auxin to asynchronous gin4-AID hsl1-AID cells caused loss of fully hyperphosphorylated Swe1 within 30 minutes (Fig. S1 D). These data provide further evidence that Gin4 and Hsl1 control mitotic progression via regulation of Swe1.

Control cells and gin4-AID hsl1-AID cells growing in YPD were released from a G1 arrest at 25°C and 0.5 mM auxin was added to both strains 20 min after release. Both strains included 2 copies of the TIR1 gene. Samples were taken at the indicated intervals and the behavior of Swe1 and Clb2 was analyzed by western blot. (B) Control cells and gin4-AID hsl1-AID cells were differentially marked with fluorescently-tagged mitotic spindle poles. Thus, control cells express SPC42-mRuby2. while the gin4-AID hsl1-AID cells express SPC42-GFP. Both strains include 2 copies of the TIR1 gene. Cells growing in CSM were arrested with α factor and then mixed together before releasing from the arrest. Auxin was added to 0.5 mM at 20 minutes after release from arrest, which corresponds to approximately 30 minutes before bud emergence. Cells were then imaged at 3-minute intervals by confocal microscopy at 27°C. Bud emergence was used to set the zero timepoint. Key mitotic transitions are highlighted for each strain.
We next tested how conditional inactivation of Gin4 and Hsl1 influences bud growth and mitotic progression in single cells. We included a fluorescently tagged spindle pole protein to monitor the duration of metaphase and anaphase (Leitao and Kellogg, 2017). The spindle poles in wild type and gin4-AID hsl1-AID cells were marked with different fluorescent tags, which allowed simultaneous imaging of both strains under identical conditions.
We analyzed the effects of gin4-AID or hsl1-AID alone, as well as the effects of gin4-AID hsl1-AID. Cells were released from a G1 arrest and auxin was added before initiation of bud emergence, which ensured that Gin4 and Hsl1 were depleted by the time of mitotic entry. Bud size and mitotic spindle dynamics were then analyzed at 3-minute intervals to determine how loss of Gin4 and Hsl1 influenced bud growth and the duration of mitosis. Examples of wild type and gin4-AID hsl1-AID cells are shown in Fig. 3 B and Video 1. Both cells undergo bud emergence at nearly the same time, but the wild type cell completes bud growth and exits mitosis while the gin4-AID hsl1-AID cell remains delayed in metaphase as the bud continues to grow. The gin4-AID hsl1-AID cell eventually completes mitosis, but at a substantially larger bud size than the wild type control cell. The daughter bud is more elongated in the gin4-AID hsl1-AID cell, which indicates a defect in control of polar growth.
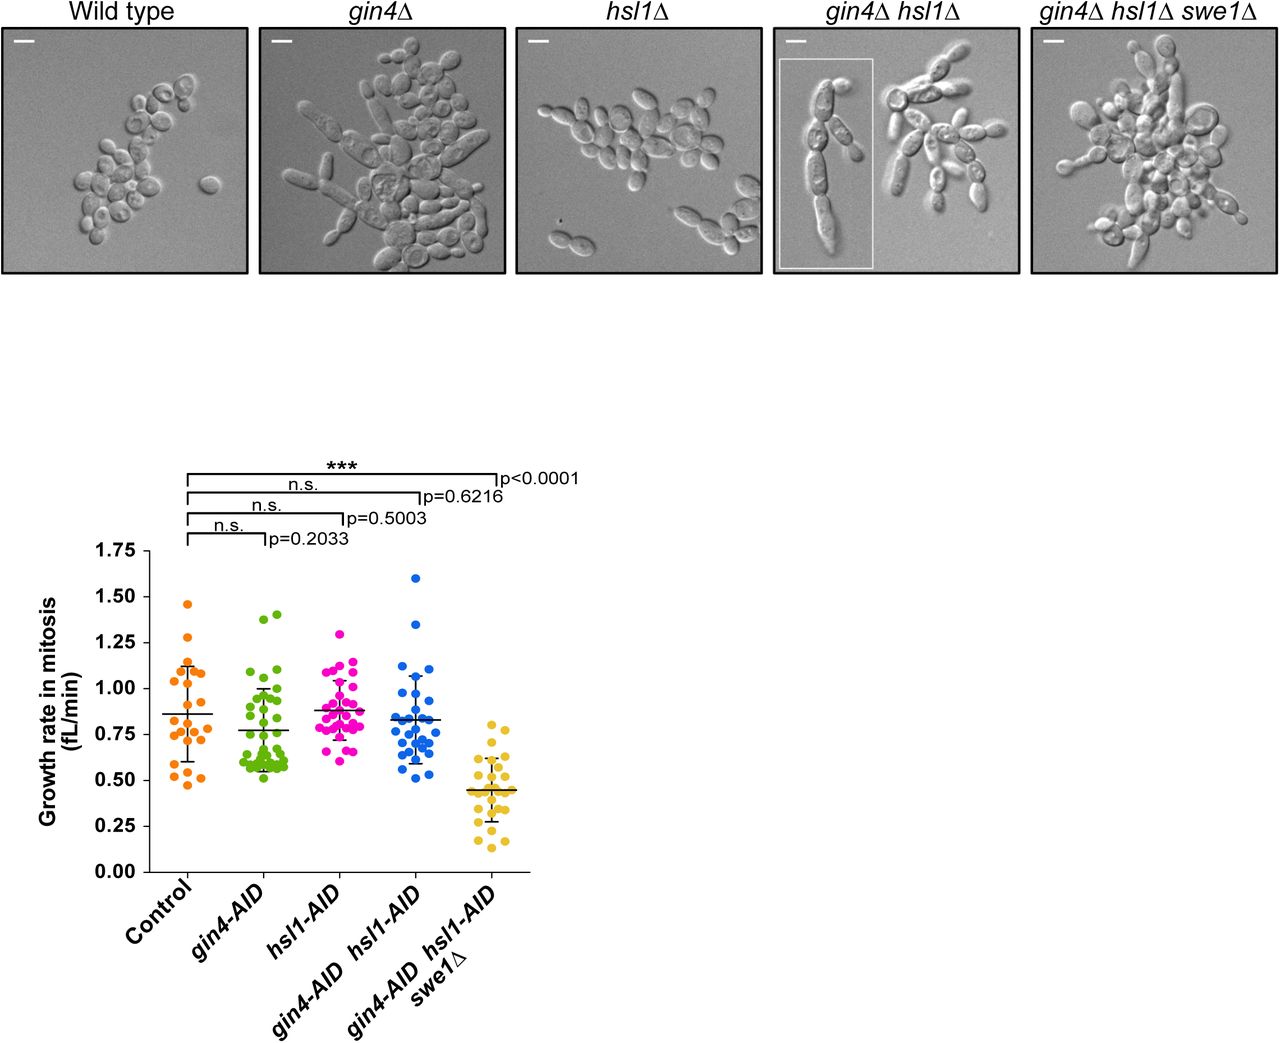
Quantitative analysis of multiple cells showed that destruction of Gin4 and/or Hsl1 caused an increase in the duration of metaphase but had no effect on the duration of anaphase (Fig. 4 A). Destruction of Gin4 and Hsl1 also caused an increase in bud size at completion of each mitotic interval (Fig. 4 B). The effects of gin4-AID and hsl1-AID were not additive (Fig. 4, A and B), which was surprising because hsl1Δ and gin4Δ have strong additive effects on cell size and shape (Fig. S2 A and (Barral et al., 1999)). This issue is addressed below.

Cells of the indicated genotypes were released from a G1 arrest and analyzed by confocal microscopy as described for Fig. 3 B. All strains included 2 copies of the TIR1 gene. (A) Scatter plots showing the duration of metaphase and anaphase. (B) Scatter plots showing bud size at completion of metaphase and anaphase. (C) Plots showing cell size at completion of mitosis versus growth rate in mitosis for control cells and gin4-AID hsl1-AID cells. (D) Scatter plots showing the ratio of major axis to minor axis of the bud at completion of anaphase. For panels A,B,D, the mean and standard deviation for each strain are shown.
In wild type cells, the bud volume reached at completion of mitosis is proportional to growth rate during mitosis (Leitao and Kellogg, 2017). gin4-AID hsl1-AID appeared to cause a partial loss of the proportional relationship between growth rate and cell size at completion of mitosis (Fig. 4 C). gin4-AID hsl1-AID did not cause significant effects on the growth rate of the daughter cell (Fig. S2 B).
Inactivation of gin4-AID caused polar bud growth to continue in mitosis, whereas inactivation of hsl1-AID did not. This effect was quantified by measuring axial ratios of daughter buds at completion of anaphase (Fig. 4 D).
Previous studies found that gin4Δ and hsl1Δ cause defects in cytokinesis that lead to formation of clumps of interconnected cells (Okuzaki et al., 1997; Ma et al., 1996b; Altman and Kellogg, 1997; Barral et al., 1999). Consistent with this, we observed that gin4-AID hsl1-AID caused a failure in cell separation in nearly all cells following the first cell cycle after addition of auxin (Video 2). Previous studies also found that gin4Δ and hsl1Δ cause defects in spindle positioning (Fraschini et al., 2006; Grava et al., 2006). We observed few defects in spindle positioning during the first cell division after addition of auxin to gin4-AID hsl1-AID cells. However, in the second cell division many cells showed aberrant movement of the metaphase spindle into the daughter cell before anaphase (Video 2).
Gin4 and Hsl1 are required for normal control of mother cell growth
In wild type cells, little growth of the mother cell occurs after bud emergence (Ferrezuelo et al., 2012; McCusker et al., 2007). In gin4-AID hsl1-AID cells, however, mother cell growth often continued throughout the interval of daughter cell growth. Example plots of mother and daughter cell size as a function of time for wild type and gin4-AID hsl1-AID cells are shown in Fig. 5 A. Quantitative analysis revealed that gin4-AID and hsl1-AID had additive effects upon mother cell growth so that most gin4-AID hsl1-AID cells underwent abnormal mother cell growth (Fig. 5 B).

Cells of the indicated genotypes were released from a G1 arrest and analyzed by confocal microscopy as described for Fig. 3 B. (A) A representative plot of mother and daughter cell size as a function of time. In each case, the daughter cell is the daughter of the mother cell shown in the same plot. (B) Scatter plots showing the net increase in mother cell volume from the time of bud emergence to completion of anaphase. The plot shows the mean and standard deviation for each strain.
Previous work has shown that large mother cells drive a faster rate of daughter cell growth (Schmoller et al., 2015; Leitao and Kellogg, 2017). As a result, the increased size of mothers in gin4-AID hsl1-AID cells would be expected to drive faster growth of daughter cells in subsequent cell divisions, leading to increased defects in cell growth and size in subsequent cell divisions. Thus, the role of Gin4 and Hsl1 in control of mother cell growth could help explain why prolonged loss of Gin4 and Hsl1 causes strong additive effects on cell growth and size. Defects in spindle positioning and cell separation could also cause increased defects in subsequent cell divisions. We found that the effects caused by gin4-AID hsl1-AID increased substantially with prolonged incubation in the presence of auxin, consistent with a model in which the terminal phenotype caused by gin4Δ hsl1Δ is the result of defects that accumulate over multiple cell cycles (Fig. S3).
Gin4-related kinases influence the duration of growth in metaphase via inhibitory phosphorylation of Cdk1
Genetic analysis has shown that Gin4 and Hsl1 are negative regulators of Swe1, and that Swe1 influences the timing of mitotic entry as well as the duration of metaphase (Fig. 3 A) (Ma et al., 1996b; Longtine et al., 2000; Harvey and Kellogg, 2003; Lianga et al., 2013; (Leitao et al., 2018). We therefore tested whether Gin4 and Hsl1 influence metaphase duration via Swe1. To do this, we analyzed the effects of swe1Δ on bud growth and mitotic duration in gin4-AID hsl1-AID cells. This revealed that swe1Δ eliminated the prolonged metaphase delay caused by loss of Gin4 and Hsl1 (Fig. 4 A). Furthermore, swe1Δ caused daughter buds in gin4-AID hsl1-AID cells to complete metaphase and anaphase at sizes smaller than the wild type control cells (Fig. 4 B), and it eliminated the bud elongation caused by gin4-AID (Fig. 4 D). As reported previously, swe1Δ caused reduced growth rate, which is thought to be due to the decreased size of mother cells (Fig. S2 B) (Leitao et al., 2018).
Several observations demonstrated that Gin4 and Hsl1 do not influence growth solely via Swe1. Previous studies found that swe1Δ cells have a shorter metaphase than wild type cells (Lianga et al., 2013; Leitao et al., 2018). Here, we found that swe1Δ reduced the duration of metaphase in gin4-AID hsl1-AID cells, but it did not make the duration of metaphase in these cells shorter than metaphase in wild type cells. In addition, swe1Δ did not fully rescue growth defects caused by gin4Δ hsl1Δ (Fig. S2 A). Finally, swe1Δ did not eliminate inappropriate growth of mother cells in gin4-AID hsl1-AID cells (Fig. 5 B). Together, these observations demonstrate that Gin4 and Hsl1 control bud growth during mitosis through Swe1-dependent and Swe1-independent mechanisms.
Proportional phosphorylation of Gin4 during bud growth requires binding to anionic phospholipids
We next searched for a mechanism that could explain how hyperphosphorylation of Gin4 and Hsl1 is linked to bud growth. Both Gin4 and Hsl1 have well-defined C-terminal kinase associated 1 (KA1) domains, which bind phosphatidylserine and other anionic phospholipids (Moravcevic et al., 2010). In vivo analysis suggests that phosphatidylserine is the most important effector for KA1 domains (Moravcevic et al., 2010). Phosphatidylserine is a low abundance phospholipid that is preferentially localized to the growing bud (Fairn et al., 2011; Ejsing et al., 2009; Klose et al., 2012). Furthermore, binding of phosphatidylserine to kinases that contain KA1 domains can promote an open and active conformation of the kinase that could potentially drive autophosphorylation or phosphorylation by another kinase (Wu et al., 2015; Emptage et al., 2017; 2018). Together, these observations led us to hypothesize that phosphatidylserine delivered to the plasma membrane during bud growth drives hyperphosphorylation of Gin4-related kinases, thereby generating a signal that is proportional to the extent of growth.
To test the hypothesis, we focused on Gin4. A version of Gin4 that lacks the KA1 domain (gin4-ΔKA1) failed to undergo hyperphosphorylation during bud growth (Fig. 6 A). Analysis of Clb2 levels in synchronized cells showed that gin4-ΔKA1 cells exhibited normal timing of mitotic entry, but increased duration of mitosis (Fig. 6 B). The gin4-ΔKA1 cells also showed increased cell size and an elongated bud phenotype similar to gin4Δ cells (Fig. 6, C and D). gin4-ΔKA1 in an hsl1Δ background caused a phenotype similar to gin4Δ hsl1Δ (Fig. 6 D). Finally, Gin4-ΔKA1- GFP failed to localize to the bud neck normally and was observed primarily in the cytoplasm (Fig. 6 E), although weak localization to the bud neck could be detected in a fraction of cells, indicating that determinants outside the KA1 domain contribute to Gin4 localization to the bud neck (arrowheads, Fig. 6 E).

Cells of the indicated genotypes were released from a G1 arrest in YPD at 30°C. The behavior of Gin4 (A) and Clb2 (B) was analyzed by western blot. In each strain, Gin4 constructs were marked with a 3xHA tag and detected with anti-HA antibody. The signal for gin4-ΔKA1 and the LactC2 constructs was weaker, so these blots were exposed longer. Gin4-ΔKA1-3xHA was about 16 KDa smaller than the other proteins. (C) Cells of the indicated genotypes were grown in YPD overnight, diluted in fresh YPD, and then incubated for 5h at 30°C. The size distribution for each strain was analyzed using a Coulter counter. (D) Cells of the indicated genotypes were grown to log phase in YPD at 25°C and imaged by DIC optics. (E) Cellular localization of Gin4, Gin4-ΔKA1, Gin4-ΔKA1-LactC2 and Gin4-ΔKA1-LactC2AAA fused to GFP at the C-terminus. All four strains were excited by the GFP-laser with identical settings at 100x magnification and displayed with the same brightness levels to compare relative levels of Gin4 localized to the bud neck. Gin4-ΔKA1- GFP shows mostly cytoplasmic localization with a small level of bud neck localization (white arrowheads). The brightfield images for each field are shown below. Scale bar represents 5 μm.
The KA1 domain could carry out functions required for Gin4 hyperphosphorylation that are independent of binding to anionic phospholipids. We reasoned that if binding to anionic phospholipids is the sole function of the KA1 domain, then replacing the KA1 domain with a heterologous phosphatidylserine binding domain should restore normal Gin4 activity. To test this, we replaced the KA1 domain with the bovine LactC2 domain, which shows no structural similarity to the KA1 domain (Shao et al., 2008; Moravcevic et al., 2010). The LactC2 domain was sufficient to restore proportional hyperphosphorylation of Gin4 during bud growth in gin4-ΔKA1-LactC2 cells (Fig. 6 A). In addition, gin4-ΔKA1-LactC2 cells showed normal mitotic timing, as well as normal cell size (Fig. 6, B, C and D). Finally, the LactC2 domain restored normal bud neck localization to gin4-ΔKA1 (Fig. 6 E). A previous study showed that deletion of the KA1 domain of Hsl1 causes reduced localization of Hsl1 to the bud neck, which can be rescued by addition of the LactC2 domain (Finnigan et al., 2016).
Mutation of three amino acids in the LactC2 domain required for efficient binding to phosphatidylserine (gin4-ΔKA1-LactC2AAA) (Yeung et al., 2008) caused a failure in proportional phosphorylation of Gin4 (Fig. 6 A), as well as a phenotype similar to gin4Δ and gin4-ΔKA1 (Fig. 6, B, C and D). The LactC2AAA domain partially restored Gin4 localization to the bud neck, however, the amount of gin4-ΔKA1-LactC2AAA-GFP at the bud neck was reduced relative to GIN4- GFP and gin4-ΔKA1-LactC2-GFP (Figs. 6 E and S4).
Discussion
Growth-dependent signals are required for control of cell growth and size
Gin4 undergoes gradual hyperphosphorylation that is dependent upon and proportional to bud growth. In addition, the kinase activity of Gin4 is dependent upon and proportional to Gin4 hyperphosphorylation (Altman and Kellogg, 1997; Mortensen et al., 2002). Together, these observations suggest that the events of bud growth generate growth-dependent signals that are proportional to the extent of growth. We hypothesize that these growth-dependent signals are used to measure the extent of bud growth. They could also be used to ensure that growth rate scales with cell size. For example, the Gin4-related kinases are required for normal levels of signaling in the TORC2 network, which plays a central role in control of cell growth (Alcaide-Gavilan et al., 2018). Thus, growth-dependent activation of Gin4-related kinases could drive a gradual increase in TORC2 activity that drives a gradual increase in growth rate as cells increase in size.
Growth in poor nutrient conditions that reduce both growth rate and cell size caused a reduction in the maximal extent of hyperphosphorylation of Gin4 and Hsl1. Poor nutrient conditions also cause a reduction in TORC2 signaling (Lucena et al., 2018). These observations are consistent with the idea that signals from the Gin4-related kinases play a role in setting the level of TORC2 signaling to achieve an appropriate growth rate. They also suggest that the reduction in cell size at completion of metaphase in poor nutrients (Leitao and Kellogg, 2017) could be driven by a mechanism that reduces the threshold activity of the Gin4-related kinases required for mitotic progression.
Growth-dependent hyperphosphorylation of Gin4 requires binding to anionic phospholipids
Growth-dependent hyperphosphorylation of Gin4 and normal control of cell growth are both dependent upon the KA1 domain, which binds anionic phospholipids (Moravcevic et al., 2010). The KA1 domain can be functionally replaced by a heterologous LactC2 domain that binds phosphatidylserine, and mutations in the LactC2 domain that reduce binding to phosphatidylserine also block growth-dependent phosphorylation of Gin4 and cause a failure in control of cell growth. Hyperphosphorylation of both Gin4 and Hsl1 is dependent upon their kinase activity, which suggests that growth-dependent phosphorylation is due to autophosphorylation (Altman and Kellogg, 1997; Barral et al., 1999). Moreover, previous studies have suggested that binding of anionic phospholipids to KA1 domains can drive formation of an open, active conformation (Wu et al., 2015; Emptage et al., 2017; 2018). Together, these observations suggest that anionic phospholipids delivered to the growing bud could generate a growth-dependent signal by binding and activating Gin4-related kinases. In this model, the Gin4-related kinases would be direct sensors of a critical event that drives cell growth (i.e. delivery of anionic phospholipids to the plasma membrane).
Although there is compelling evidence that binding of phosphatidylserine is the key event that drives proportional phosphorylation of Gin4-related kinases, alternative models remain possible. For example, binding to anionic phospholipids could help bring Gin4-related kinases to the bud neck where they receive growth-dependent signals from other kinases. However, several observations argue against this kind of model. First, extensive data suggest that proportional phosphorylation of Gin4-related kinases is due to autophosphorylation (Altman and Kellogg, 1997; Barral et al., 1999; Mortensen et al., 2002). Second, gin4-ΔKA1-LactC2AAA localizes to the bud neck but fails to undergo phosphorylation, which suggests that localization to the bud neck is not sufficient for hyperphosphorylation of Gin4. Further testing of models will require biochemical reconstitution and in vivo analysis to learn more about the signals that drive growth-dependent phosphorylation of Gin4-related kinases.
The KA1 domain binds preferentially to phosphatidylserine but can also bind other anionic phospholipids, such as phosphatidylinositol (Moravcevic et al., 2010; Wu et al., 2015). In contrast, the LactC2 domain appears to bind only to phosphatidylserine (Shao et al., 2008). The fact that the KA1 domain can be functionally replaced by the LactC2 domain therefore suggests that binding to phosphatidylserine is sufficient to generate a growth-dependent signal. Phosphatidylserine is a low abundance lipid that is preferentially localized to the growing bud (Moravcevic et al., 2010; Fairn et al., 2011). Phosphatidylserine is also preferentially localized to sites of membrane growth in fission yeast (Haupt and Minc, 2017).
Cells that completely lack phosphatidylserine can be made by deleting the CHO1 gene, which encodes the enzyme that catalyzes the last step in synthesis of phosphatidylserine. However, interpretation of the phenotype caused by loss of phosphatidylserine is complicated by several factors. First, loss of phosphatidylserine causes increased synthesis of phosphatidylinositol, an anionic phospholipid that could compensate for some functions of phosphatidylserine, including binding to KA1 domains (Matsuo et al., 2007; Hikiji et al., 1988). In addition, phosphatidylserine is a precursor in one of the major pathways used to synthesize phosphatidylethanolamine (Klug and Daum, 2014). In both budding yeast and fission yeast, cells that lack phosphatidylserine are barely viable (Matsuo et al., 2007; Hikiji et al., 1988). In fission yeast, the slow growth caused by loss of phosphatidylserine can be rescued by inclusion of ethanolamine in the growth media (Matsuo et al., 2007). Cells grown under these conditions are abnormally large, consistent with the idea that growth-dependent signals generated by phosphatidylserine are used to determine when sufficient growth has occurred (Haupt and Minc, 2017).
Gin4-related kinases control the duration of growth in metaphase partly via Cdk1 inhibitory phosphorylation
Early work suggested that Wee1 family members work solely at mitotic entry. More recent work in both vertebrates and yeast has shown that Wee1 also controls events that occur after mitotic entry (Deibler and Kirschner, 2010; Harvey et al., 2011; Lianga et al., 2013; Vassilopoulos et al., 2014; Toledo et al., 2015; Leitao and Kellogg, 2017). In budding yeast, several studies suggested that the activity of Swe1 in metaphase could be controlled by the Gin4-related kinases (Altman and Kellogg, 1997; Sreenivasan and Kellogg, 1999; Carroll et al., 1998; Sreenivasan et al., 2003; Barral et al., 1999). Here, we used conditional inactivation of Gin4 and Hsl1 to provide definitive evidence that Gin4-related kinases control the duration of metaphase via Cdk1 inhibitory phosphorylation. We also showed that loss of Gin4-related kinases causes a failure in full hyperphosphorylation of Swe1 (Sreenivasan and Kellogg, 1999). Previous studies have suggested that Gin4-related kinases directly phosphorylate Wee1 (Kanoh and Russell, 1998; Coleman et al., 1993).
Gin4-related kinases influence the location of growth
The effects of conditional inactivation of Gin4 and Hsl1 on the duration of growth in metaphase were not additive, which was surprising because gin4Δ and hsl1Δ show strong additive effects (Barral et al., 1999). A potential explanation came from the discovery that loss of Gin4-related kinases causes inappropriate mother cell growth during mitosis. In this case, the effects of inactivating Gin4 and Hsl1 were additive. Previous work found that large mother cells drive an increased growth rate in daughter cells (Schmoller et al., 2015; Leitao and Kellogg, 2017). Thus, we hypothesize that the increased size of mother cells caused by loss of Gin4 and Hsl1 drives an increased rate of growth that leads to even greater aberrant growth in subsequent divisions. However, other factors likely contribute to the additive effects of gin4Δ and hsl1Δ. For example, we observed severe spindle positioning defects in the second cell division after inactivation of Gin4 and Hsl1, which could cause prolonged mitotic delays that could cause aberrant growth. Defects in growth control could also be amplified by failures in cytokinesis that create chains of conjoined cells in which the signals that control cell growth and size are no longer effectively compartmentalized.
Destruction of Gin4 caused prolonged polar growth, which suggests that Gin4 plays a role in terminating polar growth. In normal cells, the interval of polar growth is terminated by low level activation of Cdk1 at mitotic entry (Lew and Reed, 1993). Low level activation of Cdk1 appears to occur normally in gin4Δ cells, albeit with a delay (Altman and Kellogg, 1997). Moreover, the elongated buds and cell separation defects caused by gin4Δ are not fully rescued by swe1Δ. Together, these observations suggest that Gin4 influences polar growth at least partly via a mechanism that works downstream of or independently of Cdk1. Previous work has suggested that Gin4 binds and regulates Bnr1, a formin protein that controls the location of actin cables that deliver vesicles to sites of membrane growth (Buttery et al., 2012). Bnr1 is localized to the bud neck, and loss of Bnr1 is thought to cause inappropriate polar growth because the actin cables that direct isotropic growth are lost (Pruyne et al., 2004; Gao and bretscher, 2010). Thus, inappropriate polar growth caused by loss of Gin4 could be due at least partly to misregulation of Bnr1. The fission yeast homolog of Gin4 also executes functions that are independent of Cdk1 inhibitory phosphorylation (Breeding et al., 1998).
Growth-dependent signaling suggests a broadly relevant mechanism for control of cell growth and size
Theoretical analysis has shown that cell size control can be achieved by a mechanism in a constant increment of growth is added during each cell cycle that is independent of initial size (Campos et al., 2014). This “adder” model for cell size control suggests that cells measure how much growth has occurred, rather than the absolute size of a cell. Adder behavior has been reported in cells ranging from bacteria to vertebrates, although the underlying molecular mechanisms have remained unknown (Campos et al., 2014; Cadart et al., 2018). Growth-dependent signaling suggests a mechanistic basis for adder behavior. Thus, delivery of anionic phospholipids could generate a signal that is proportional to the amount of phospholipid delivered to the growing membrane, which could be used to measure how much growth has occurred.
A previous study found evidence that growth-dependent signaling is also used to link mitotic entry to completion of the interval of polar bud growth (Anastasia et al., 2012). In this case it was found that a member of the atypical protein kinase C family (Pkc1) undergoes gradual hyperphosphorylation that is dependent upon and proportional to polar bud growth. Once activated, Pkc1 relays signals that drive mitotic entry. Key signaling proteins in the Pkc1 axis are localized to the site of polar growth and physically interact (Drees et al., 2001; Yamochi et al., 1994; Andrews and Stark, 2000; Anastasia et al., 2012; Gentry and Hallberg, 2002; Rossio and Yoshida, 2011). Moreover, Pkc1 appears to play important functions in TORC2 signaling networks that control cell growth (Roelants et al., 2017). Thus, growth-dependent control of Pkc1 shows strong similarities to the Gin4-related kinases but appears to influence the interval of polar growth that occurs before mitotic entry. There is some evidence that Pkc1 may also be responding to phosphatidylserine; however, a phosphatidylserine-binding domain in Pkc1 has not yet been rigorously defined (Nomura et al., 2017; Kamada et al., 1996).
Signals associated with plasma membrane growth also control ribosome biogenesis (Nanduri and Tartakoff, 2001; Mizuta and Warner, 1994). Thus, both of the core processes of growth – ribosome biogenesis and membrane growth – could be monitored and controlled via growth-dependent signals generated at the plasma membrane.
Is cell size an outcome of mechanisms that control cell growth?
In contrast to the adder model for size control, “sizer” models postulate that cells measure their size and delay cell cycle progression until a critical size has been reached (Jorgensen and Tyers, 2004b; Turner et al., 2012; Ginzberg et al., 2015). In sizer models, cells measure an outcome of growth (cell size) but otherwise have no mechanistic connection to the events of growth or to the signals that control cell growth. Yet there is increasing evidence for close mechanistic connections between cell growth and size. The discovery of growth-dependent signals that influence key cell cycle regulators suggests that the events of growth are translated into a proportional signal that is used to measure growth (Anastasia et al., 2012). Furthermore, Gin4-related kinases and Pkc1, the key kinases known to be involved in growth-dependent signaling, also appear to play roles in controlling cell growth. For example, Gin4-related kinases control the pattern of growth and are also linked to the TORC2 network, which is thought to play a central role in control of cell growth. Thus, loss of Gin4-related kinases causes reduced TORC2 signaling, as well as defects in nutrient modulation of TORC2 signaling (Alcaide-Gavilan et al., 2018). Conversely, mutants that are thought to cause increased TORC2-dependent signaling also cause increased phosphorylation of Gin4-related kinases (Zapata et al., 2014; Lucena et al., 2018). Similarly, Pkc1 has been linked to ribosome biogenesis, membrane trafficking, and organization of actin filaments (Roelants et al., 2017).
Further evidence for a close relationship between control of cell growth and size has come from analysis of the relationship between growth rate and cell size. Studies in diverse cell types have found that growth rate is proportional to nutrient availability, cell size is proportional to growth rate, and growth rate is proportional to cell size (Leitao and Kellogg, 2017; Schmoller et al., 2015; Schaechter et al., 1958; Tzur et al., 2009; Sung et al., 2013; Cadart et al., 2018). In yeast, these proportional relationships are dependent upon the TORC2 signaling network (Lucena et al., 2018). Analysis of the network suggests that TORC2-dependent signals that set growth rate also set the critical amount of growth required for cell cycle progression, which would point to a close relationship between cell size and the signals that control cell growth. There is also evidence that signals arising from ribosome biogenesis pathways influence cell size (Jorgensen and Tyers, 2004a; Jorgensen et al., 2002). It seems likely that the signals that control cell growth must ensure that the rates of membrane synthesis and ribosome biogenesis are matched to each other and to the growth rate set by nutrient availability. Thus, decreased rates of ribosome biogenesis or membrane growth might be expected to trigger a global decrease in growth rate as well as an associated decrease in cell size.
A general model that could explain these observations is that growth-dependent signals ensure that TORC2 signaling and growth rate scale with cell size, and that cell size scales with growth rate. Signals from the TORC2 network could influence cell size by setting the threshold level of Gin4 hyperphosphorylation required for cell cycle progression, which would effectively match cell size to growth rate. Gin4-related kinases at the bud neck could function to define the boundaries of a domain of growth within the daughter bud, where they would be ideally positioned to report on the extent of bud growth, while also coordinating the events of growth.
From an evolutionary perspective, it would perhaps make sense that mechanisms that limit the extent of growth evolved in close association with the actual events of growth. In this view, cell size is an outcome of mechanisms that control cell growth, rather than the outcome of a mechanism that measures cell size independently of the molecular events that drive and control growth.
Materials and Methods
Yeast strain construction, media, and reagents
All strains are in the W303 background (leu2-3,112 ura3-1 can1-100 ade2-1 his3-11,15 trp1-1 GAL+ ssd1-d2). The additional genetic features of strains are listed in Table S1. Cells were grown in YP medium (1% yeast extract, 2% peptone, 40 mg/liter adenine) supplemented with 2% dextrose (YPD), or 2% glycerol and 2% ethanol (YPG/E). For live cell imaging, cells were grown in complete synthetic medium (CSM) supplemented with 2% dextrose and 40 mg/ml adenine.
Gene deletions and C-terminal epitope tagging was performed by standard PCR amplification and homologous recombination (Longtine et al., 1998; Janke et al., 2004; Lee et al., 2013). gin4-ΔKA1-LactC2 constructs integrated at the GIN4 locus were created by gene splicing with overlap extension (Horton et al., 1990). Briefly, LactC2 fragments were PCR amplified from the plasmids pKT2100 or pKT1995 (Takeda et al., 2014) with 40bp of flanking sequence at the 5’ end that was homologous to the GIN4 ORF just upstream of the KA1 domain (amino acids 1007- 1142) using oligos Gin4-39 and Gin4-40 (Table 2). The 3xHA::His3MX6 fragment was amplified from pFA6a-3HA-His3MX6 (Longtine et al., 1998) with 5’ homology to the terminal sequence of LactC2 and 3’ homology to the DNA sequence just downstream of the Gin4 ORF using primers Gin4-38 and Gin4-41. The two fragments were then gel purified, annealed to each other and elongated for 15 PCR cycles in the absence of primers, followed by PCR amplification using primers Gin4-38 and Gin4-39. The resulting fragments were then transformed into wild type cells and correct integrants were identified by western blotting with anti-HA antibody. To create the GFP-tagged versions of the gin4-ΔKA1-LactC2 constructs, GFP-His3MX6 was amplified from pFA6a-GFP-His3MX6 (Longtine et al., 1998) and spliced to LactC2 as described above.
To generate strains with an AID tag on GIN4 and/or HSL1, the HSL1 gene was tagged at the C-terminus with an AID tag marked with KanMX6 in a parent strain that has two copies of the TIR1 gene. The KanMX6 marker was then replaced by a TRP1 marker. Next, a second AID tag marked with KanMX6 was incorporated at the GIN4 locus. The SPC42 gene in all four AID-tagged strains was fused to GFP at the C-terminus using standard PCR and homologous recombination. The parent strain that contains 2xTIR1 was used as the control strain and was modified to express endogenous SPC42 fused with yeast-optimized mRuby2 (yomRuby2). Auxin was dissolved in 100% ethanol to make a 50 mM stock solution.
Cell cycle time courses and Western blotting
Cell cycle time courses were carried out as previously described (Harvey et al., 2011). Briefly, cells were grown to log phase at room temperature overnight in YPD or YPG/E to an optical density (OD600) of 0.5 - 0.7. Cultures were adjusted to the same optical density and were then arrested in G1 phase by incubation in the presence of 0.5 μg/mL α factor at room temperature for 3 hours. Cells were released from the arrest by washing 3 times with fresh YPD or YPG/E. All time courses were carried out at 25°C unless otherwise noted, and α factor was added back at 70 minutes to prevent initiation of a second cell cycle. For experiments involving auxin-mediated destruction of proteins, a single culture synchronized in G1 phase was split into two culture flasks and 0.5 mM auxin was added to one flask at 20 minutes after release from the G1 phase arrest. An equivalent volume of ethanol was added to the control flask.
For western blotting, 1.6 mL sample volumes were collected in screw cap tubes and centrifuged at 13,000 rpm for 30 sec. After discarding the supernatant, 200 μL acid washed glass beads were added to the tubes and the samples were frozen in liquid nitrogen. Cells were lysed in 140 μL sample buffer (65 mM Tris HCl, pH-6.8, 3% SDS, 10% glycerol, 50 mM sodium fluoride, 100 mM ß-glycerophosphate, 5% ß-mercaptoethanol, and bromophenol blue) supplemented with 2 mM PMSF immediately before use. For experiments involving immunoblotting for Gin4-AID proteins, the sample buffer also included the protease cocktail LPC (1 mg/mL leupeptin, 1 mg/mL pepstatin, 1 mg/mL chymostatin dissolved in dimethylsulfoxide; used at 1/500 dilution). Sample buffer was added to cells immediately after they were removed from liquid nitrogen and the cells were then lysed in a Mini-beadbeater 16 (BioSpec) at top speed for 2 min. After a brief centrifugation, the samples were placed in a boiling water bath for 5 min and were then centrifuged again at 13,000 rpm for 3 min before loading onto SDS-PAGE gels. SDS PAGE was carried out as previously described (Harvey et al., 2011). 10% polyacrylamide gels with 0.13% bis-acrylamide were used for analysis of Gin4, Clb2, and Nap1 (loading control). 9% polyacrylamide gels with 0.14% bis-acrylamide were used for Hsl1 and Swe1 blots. Proteins were immobilized onto nitrocellulose membranes using wet transfers for 1h 45 min. Blots were probed with the primary antibody at 1-2 μg/mL at room temperature overnight in 5% milk in PBST (1x phosphate buffered saline, 250 mM NaCl, 0.1% Tween-20) with 0.02% sodium azide. All the primary antibodies used in this study are rabbit polyclonal antibodies generated as described previously (Sreenivasan and Kellogg, 1999; Kellogg and Murray, 1995; Altman and Kellogg, 1997; Mortensen et al., 2002). Primary antibodies were detected by an HRP-conjugated donkey anti-rabbit secondary antibody (GE Healthcare; # NA934V) incubated in PBST for 1h at room temperature. Blots were rinsed in PBS before detection via chemiluminescence using ECL reagents (Advansta; #K-12045-D50) with a Bio-Rad ChemiDoc imaging system.
Coulter counter analysis
Cell cultures were grown in 10 mL YPD medium to an OD600 between 0.4 - 0.6. Cells were fixed by addition of 1/10 volume of 37% formaldehyde to the culture medium followed by incubation at room temperature for 1h. Cells were then pelleted and resuspended in 0.5 mL PBS containing 0.02% sodium azide and 0.1% Tween-20 and analyzed on the same day. Cell size was measured using a Coulter counter (Channelizer Z2; Beckman Coulter) as previously described (Jorgensen et al., 2002; Artiles et al., 2009). Briefly, 40 μL of fixed cells were diluted in 10 mL diluent (Isoton II; Beckman Coulter) and sonicated for 5 pulses of approximately 0.5 second each at low power. The Coulter Counter data shown in the figures represents the average of 3 biological replicates that is each the average of 3 technical replicates. For Fig. 6 C the strains were grown to log phase overnight at room temperature, diluted to OD600 - 0.1 in 5 mL fresh YPD, and then incubated for 4-5 h at 30°C to observe temperature-dependent phenotypes of the mutants.
Microscopy
For DIC imaging, cells were grown to log phase in YPD and fixed in 3.7% formaldehyde for 30 min and then resuspended in PBS with 0.1% Tween-20 and 0.02% sodium azide. Images were obtained using a Zeiss-Axioskop 2 Plus microscope fitted with a 63x Plan-Apochromat 1.4 n.a. objective and an AxioCam HR camera (Carl Zeiss, Thornwood, NY). Images were acquired using AxioVision software and processed on Fiji (Schindelin et al., 2012).
For live cell time-lapse imaging, the control strain (DK3510) and AID-tagged strains (DK3307, DK3308, DK3327 or DK3330) were grown in CSM overnight to an OD600 of 0.1 - 0.2 and then arrested in G1 phase with α factor. The control and the AID-tagged strains were mixed in a 1.6 mL tube and then washed 3X in CSM prewarmed to 30°C to release the cells from the G1 phase arrest. After resuspending the cells in CSM, approximately 200 μL cells were immobilized onto a concanavalin A-treated chambered #1.5 Coverglass system (Labtek-II; Nunc™#155409) for 5 min. Unbound cells were washed away by repeated washes with CSM. The cells were then incubated in 500 μL CSM at 27°C for the duration of the imaging. Auxin was added to the cells to a final concentration of 0.5 mM 20 minutes after the first wash used to release the cells from the α factor arrest.
Scanning confocal images were acquired on a Zeiss 880 confocal microscope running ZEN Black software using a 63x/1.4 n.a. Plan Apo objective. The microscope was equipped with a heat block stage insert with a closed lid and exterior chamber for temperature control. The microscope was allowed to equilibrate at the set temperature of 27°C for at least 1h to ensure temperature stability prior to imaging. Definite Focus was used to keep the sample in focus during the duration of the experiment. 1×2 tiled z-stack images were acquired every 3 min. Zoom and frame size were set to 0.8x magnification to achieve a consistent pixel area of 1024×1024 pixels in XY and pixel dwell time was 0.5 μs. Optical sections were taken for a total of 14 z-planes every 0.37 μm with frame averaging set to 2, to reduce noise. 488 nm laser power was set to 0.2% and the 561 nm laser power was set to 1% to minimize cell damage. The gain for GFP, RFP and bright field was set to 550, 750 and 325, respectively. The same gain settings were used for each experiment. GFP signal was acquired on a GaAsP detector and collected between 498 nm - 548 nm. Brightfield images were collected simultaneously. RFP signal was acquired on a GaAsP detector and collected between 577 nm - 629 nm.
To visualize the localization of Gin4 constructs fused to GFP, cells were grown in CSM overnight, fixed in 3.7% formaldehyde for 15 min, and then resuspended in 500 μL 1x PBST. Images were acquired on a spinning disk confocal microscope with a Solamere system running MicroManager* (Edelstein et al., 2014). The microscope was based on a Nikon TE2000 stand and Coherent OBIS lasers. We used a 100x/1.4 n.a. Plan Apo objective for Fig. 6 E and a 63x/1.4 Plan Apo objective for data collection in Fig. S4. Pixel sizes were 0.11 μm in X,Y and z-stack spacing was set to 0.5 μm with a total of 17 z-slices. GFP was excited at 488 nm and collected through a 525/50nm band pass filter (Chroma) onto a Hamamatsu ImageEMX2 EMCCD camera. Gain levels were set to 200 to maximize signal without hitting saturation. GFP and brightfield images were collected sequentially.
Image analysis
All images were analyzed on Fiji (Schindelin et al., 2012). For visualization of GFP-tagged Gin4 constructs, a sum projection of z-slices was used. Movies for the time-lapse were processed as previously described (Leitao et al., 2018). The bright field images were processed using the “Find Focused Slices” plugin available on Fiji to create a stack with the focused slice +/- one slice for each timepoint. A z-projection with sum of slices was performed on this stack and then bud volumes were determined using the plugin BudJ (Ferrezuelo et al., 2012).
The timings of cell cycle events were determined as previously reported (Leitao and Kellogg, 2017). Briefly, bud initiation was manually determined by the appearance of a protrusion on the surface of the mother cell. The initiation of metaphase was marked by the appearance of separation of spindle poles to 2-3 microns apart. Initiation of anaphase was marked by further separation of the spindle poles and segregation of one of the poles into the daughter cell. We defined completion of anaphase as the point at which the spindle poles reached their maximal distance apart.
For a quantitative comparison of the localization of GFP-tagged Gin4 constructs in Fig. S4, a z-projection with sum of slices was performed on the images and an elliptical ROI was drawn around the bud neck. The maximum pixel intensity was determined for each cell after subtracting the background pixel intensity.
Statistical analysis
Data acquired from the image analysis were plotted as scatter dot plots using GraphPad Prism. The scatter plots show the data distribution along with the mean and standard deviation for each strain. For all scatter dot plots, the unpaired t-test was calculated using the Mann-Whitney test for non-Gaussian distributions and the two-tailed p-values have been mentioned.
Online supplemental material
Fig. S1 relates to Fig. 3 and provides a characterization of the gin4-AID and hsl1-AID alleles. Fig. S2 relates to Fig. 4 and shows further evidence for the role of Gin4 and Hsl1 in the control of bud growth. Fig. S3 relates to Fig. 5 and shows a time-dependent increase in the gin4-AID hsl1-AID phenotype. Fig. S4 relates to Fig. 6 and shows peak pixel intensity of the various Gin4-GFP constructs localized to the bud neck. Video 1 and Video 2 show time-lapse videos of 2xTIR1 and gin4-AID hsl1-AID cells as they progress through the cell cycle. The tables show yeast strains (Table 1), primers (Table 2), and plasmids (Table 3) used in this study.

(A) Wild type, 2xTIR1 control cells, gin4-AID hsl1-AID 2xTIR1 cells and gin4-AID hsl1-AID swe1Δ 2xTIR1 cells were grown overnight at room temperature in YPD and cell size distributions were analyzed with a Coulter counter. (B) Control cells and gin4-AID hsl1-AID cells growing in YPD were released from a G1 phase arrest. After release, the gin4-AID hsl1-AID cells were split into two aliquots and 0.5 mM auxin was added to one aliquot and an equivalent amount of the solvent for auxin was added to the other. Auxin was also added to the control strain. Samples were taken at the indicated intervals and the behavior of Gin4 was analyzed by western blot. All strains contain 2 copies of the TIR1 gene (2xTIR1). (C) gin4-AID hsl1-AID 2xTIR1 cells growing in YPD were released from a G1 phase arrest. After release, the cells were split into two aliquots and 0.5 mM auxin was added to one aliquot and an equivalent amount of the solvent for auxin was added to the other. Samples were taken at the indicated intervals and the behavior of Clb2 was analyzed by western blot. (D) gin4-AID hsl1-AID 2xTIR1 cells were grown to log phase in YPD and were then split into two aliquots. 0.5 mM auxin was added to one aliquot and an equivalent amount of the solvent for auxin was added to the other. Samples were taken at the indicated intervals and the behavior of Swe1 was analyzed by western blot. Anti-Nap1 was used as loading control.

(A) gin4Δ, hsl1Δ, gin4Δ hsl1Δ, and gin4Δ hsl1Δ swe1Δ cells were grown to log phase in YPD media at 25°C and images were obtained using DIC optics. (B) A scatter plot showing the growth rate of the daughter buds during mitosis for the indicated genotypes. The growth rate (fL/min) was determined as the increase in bud volume from initiation of metaphase to the completion of anaphase, divided by the total time spent in metaphase and anaphase.

Control cells and gin4-AID hsl1-AID cells were grown to log phase at room temperature in YPD medium and auxin was added to both strains. Both strains included 2 copies of the TIR1 gene. DIC images of the cells were taken at the indicated times. Scale bar represents 5 μm.

Cells of the indicated genotypes were analyzed to determine the maximum pixel intensity for GFP fluorescence at the bud neck. The Y-axis on the scatter plot shows the maximum pixel intensity in arbitrary units after subtracting background signal.
Video 1: Time-lapse imaging of 2xTIR1 and gin4-AID hsl1-AID cells.
The two strains were mixed together prior to imaging as described in Materials and methods. The spindle pole bodies were differentially tagged in the two strains. The cells in top right corner show 2xTIR1 cells with mRuby2-tagged SPC42 and the cells in the bottom left corner show gin4-AID hsl1-AID with GFP-tagged SPC42. The gin4-AID hsl1-AID cells undergo a prolonged metaphase delay with polarized bud growth while the 2xTIR1 cells begin the next cell cycle. The cells were imaged using time-lapse confocal microscopy with image acquisition every 3 min. The movie was converted to AVI format using Fiji and shows the time-lapse at a speed of 5 frames per second (fps). Scale bar represents 5 μm.
Video 2: gin4-AID hsl1-AID cells show spindle pole and cytokinesis defects.
A tile showing 2xTIR1 cells with mRuby2-tagged SPC42 and gin4-AID hsl1-AID cells with GFP-tagged SPC42 imaged together. Cells were imaged using time-lapse confocal microscopy with image acquisition every 3 min. The gin4-AID hsl1-AID cells exhibit defects in bud separation and results in the formation of cell chains. These defects are also accompanied by spindle defects (magenta arrows) in the second cell cycle. The movie was converted to AVI format using Fiji and shows the time-lapse at a speed of 5 fps.
Acknowledgements
We thank Ben Abrams and the UCSC Life Microscopy Facility for assistance with microscopy, Kazuma Tanaka, Thomas Eng and Doug Koshland for plasmids, and members of the laboratory for support and helpful advice. The authors declare no competing financial interests.
References


