

ABSTRACT
The chromosome 3q29 deletion is associated with a range of neurodevelopmental disorders. Here, we used quantitative methods to assay Drosophila melanogaster and Xenopus laevis models with tissue-specific knockdown of individual homologs of genes within the 3q29 region. We identified developmental, cellular and neuronal phenotypes for multiple homologs, potentially due to altered apoptosis and cell cycle mechanisms. We screened for 314 pairwise knockdowns of fly homologs of 3q29 genes, and identified 44 interactions between pairs of homologs and 34 interactions with other neurodevelopmental genes. NCBP2 homologs in Drosophila (Cbp20) and X. laevis (ncbp2) enhanced the phenotypes of the other homologs, leading to significant increases in apoptosis that disrupted cellular organization and brain morphology. These cellular and neuronal defects were rescued with overexpression of the apoptosis inhibitors Diap1 and xiap in both models. Our study suggests that NCBP2-mediated genetic interactions contribute to the neurodevelopmental features of the 3q29 deletion.
IMPACT STATEMENT NCBP2 homologs in Drosophila and X. laevis enhance the neurodevelopmental phenotypes of other homologs of genes within the 3q29 deletion region, leading to disruptions in several cellular mechanisms.
INTRODUCTION
Rare copy number variants (CNVs), including deletions and duplications in the human genome, significantly contribute to complex neurodevelopmental disorders such as schizophrenia, intellectual disability/developmental delay, autism, and epilepsy (Girirajan et al., 2011; Malhotra and Sebat, 2012). Despite extensive phenotypic heterogeneity associated with recently described CNVs (Girirajan and Eichler, 2010), certain rare CNVs have been linked to specific neuropsychiatric diagnoses. For example, the 22q11.2 deletion (DiGeorge/velocardiofacial syndrome), the most frequently occurring pathogenic CNV, is found in about 1-2% of individuals with schizophrenia (Karayiorgou et al., 2010, 1995), and animal models of several genes within the region show neuronal and behavioral phenotypes on their own (Fenelon et al., 2011; Mukai et al., 2015). Similarly, the 1.6 Mbp recurrent deletion on chromosome 3q29, encompassing 21 genes, was initially identified in individuals with a range of neurodevelopmental features, including intellectual disability, microcephaly, craniofacial features, and speech delay (Ballif et al., 2008; Mulle et al., 2010). Further studies implicated this deletion as a major risk factor for multiple disorders (Glassford et al., 2016). In fact, the deletion confers a >40-fold increase in risk for schizophrenia (Kirov et al., 2012; Mulle, 2015) as well as a >20-fold increase in risk for autism (Pollak et al., 2019). More recently, two studies have reported decreases in body and brain sizes as well as a range of behavioral and social defects in mouse models of the entire deletion, mimicking the human developmental phenotypes associated with the deletion (Baba et al., 2019; Rutkowski et al., 2019).
Identifying the biological underpinnings of the 3q29 deletion is contingent upon uncovering the molecular mechanisms linking individual genes or combinations of genes within the 3q29 region to the neurodevelopmental phenotypes observed in individuals with the entire deletion. Recent studies have suggested a subset of genes in the 3q29 region as potential candidates for these phenotypes based on their established roles in neuronal development (Quintero-Rivera et al., 2010; Rutkowski et al., 2017). For example, DLG1 is a scaffolding protein that organizes the synaptic structure at neuromuscular junctions (Budnik et al., 1996), affecting both synaptic density and plasticity during development (Walch, 2013). However, mouse models of Dlg1+/- did not recapitulate the behavioral and developmental phenotypes observed in mice with the entire deletion (Rutkowski et al., 2019), suggesting that haploinsufficiency of DLG1 by itself does not account for the wide range of phenotypes associated with the deletion. Given that genes within rare pathogenic CNV regions tend to share similar biological functions (Andrews et al., 2015) and interact with each other to contribute towards developmental phenotypes (Iyer et al., 2018; Jensen and Girirajan, 2019), it is likely that multiple genes within the 3q29 region jointly contribute to these phenotypes through shared cellular pathways. Therefore, an approach that integrates functional analysis of individual genes within the 3q29 deletion and their combinatorial effects on neuronal and cellular phenotypes is necessary to understand the pathways and mechanisms underlying the deletion.
Systematic testing of genes in the 3q29 region towards developmental and cellular phenotypes requires model systems that are amenable for rapid phenotypic evaluation and allow for testing interactions between multiple dosage-imbalanced genes without affecting the viability of the organism. Drosophila melanogaster and Xenopus laevis provide such powerful genetic models for studying conserved mechanisms that are altered in neurodevelopmental disorders, with the ability to manipulate gene expression in a tissue-specific manner in Drosophila (Wangler et al., 2015) and examine developmental defects in X. laevis (Pratt and Khakhalin, 2013). Both model systems contain homologs for a large majority of disease-causing genes in humans, and show a high degree of conservation in key developmental pathways (Gatto and Broadie, 2011; Harland and Grainger, 2011; Reiter et al., 2001; Wangler et al., 2015). For example, Drosophila knockdown models of the candidate schizophrenia gene DTNBP1 showed dysregulation of synaptic homeostasis and altered glutamatergic and dopaminergic neuron function (Dickman and Davis, 2009; Shao et al., 2011), and fly models for UBE3A, the gene associated with Angelman syndrome, showed sleep, memory and locomotor defects (Wu et al., 2008). Furthermore, X. laevis models have been widely used to identify morphological and neuronal defects associated with developmental disorders (Pratt and Khakhalin, 2013), such as dendritic connectivity defects with overexpression of MECP2, the causative gene for Rett syndrome (Marshak et al., 2012). Thus, Drosophila and X. laevis models of individual CNV homologs and their interactions will allow for a deeper dissection of the molecular mechanisms disrupted by the deletion, complementing the phenotypes documented in mouse models of the entire deletion (Baba et al., 2019; Rutkowski et al., 2019).
Here, we used a mechanistic approach to understand the role of individual homologs of 3q29 genes and their interactions towards pathogenicity of the deletion. We systematically characterized developmental, cellular, and nervous system phenotypes for 14 conserved homologs of human 3q29 genes and 314 pairwise interactions using Drosophila, and validated these phenotypes using X. laevis. We found that multiple homologs of genes within the 3q29 region, including NCBP2, DLG1, FBXO45, PIGZ, and BDH1, contribute to disruptions in apoptosis and cell cycle pathways, leading to neuronal and developmental defects in both model systems. These defects were further enhanced when each of the homologs were concomitantly knocked down with homologs of NCBP2 in Drosophila (Cbp20) and X. laevis (ncbp2), resulting in increased apoptosis and dysregulation of cell cycle genes. Our results support an oligogenic model for the pathogenicity of the 3q29 deletion, and implicate specific cellular mechanisms for the observed developmental phenotypes.
RESULTS
Reduced expression of individual homologs of 3q29 genes causes global developmental defects
We used reciprocal BLAST and orthology prediction tools (see Methods) to identify fly homologs for 15 of the 21 genes within the 3q29 deletion region (Figure 1, Figure 1—Figure Supplement 1). We note that the genes and crosses tested in this study are represented with fly gene names along with the human counterparts at first mention in the text, i.e. Cbp20 (NCBP2), and fly genes with allele names in the figures, i.e. Cbp20KK109448. The biological functions of these 15 genes are also conserved between Drosophila and humans, as 61 of the 69 Gene Ontology terms (88.4%) annotations for the human genes are also annotated in their respective fly homologs (Supplementary File 1). For example, dlg1 (DLG1) and Cbp20 (NCBP2) share the same roles in both flies and vertebrates, respectively, as a scaffolding protein at the synaptic junction (Muller et al., 1995) and a member of the RNA cap binding complex (Sabin et al., 2009). We used RNA interference (RNAi) and the UAS-GAL4 system to knockdown expression levels of fly homologs of genes within the 3q29 region ubiquitously and in neuronal, wing and eye tissues (Brand and Perrimon, 1993) (Figure 1). A stock list of the fly lines used in this study and full genotypes for all experiments are provided in Supplementary File 2. Quantitative PCR (qPCR) confirmed partial knockdown of gene expression for each of the tested homologs (Figure 1—Figure Supplement 2); fly lines for CG5359 (TCTEX1D2) were excluded from further analysis after additional quality control assessment (see Methods). To identify genes essential for organism survival and neurodevelopment, we first assessed the effect of ubiquitous knockdown of fly homologs of 3q29 genes using the da-GAL4 driver (Figure 2A). Seven of the 14 homologs, including dlg1, Cbp20, and Tsf2 (MFI2), showed lethality or severe developmental defects with ubiquitous knockdown, suggesting that multiple homologs of 3q29 genes are essential for viability during early development. Similarly, wing-specific beadexMS1096-GAL4 knockdown of Tsf2, Cbp20, CG8888 (BDH1), and Pak (PAK2) showed severe wing defects and knockdown of dlg1 showed larval lethality (Figure 2—Figure Supplement 1A).

Drosophila homologs of human 3q29 genes and expression of Drosophila homologs during development. DIOPT version 7.1 (Hu et al., 2011) and reciprocal BLAST were used to identify fly homologs of genes within the 3q29 region; six genes did not have fly homologs. Expression levels of fly homologs of 3q29 genes were assessed using high-throughput expression data from FlyAtlas Anatomy microarray expression data (Chintapalli et al., 2007) and modENCODE Anatomy RNA-Seq data (Graveley et al., 2011) from FlyBase.

qPCR primers and expression values for RNAi knockdown of fly homologs of 3q29 genes. Elav-GAL4 flies were crossed with RNAi lines of fly homologs of 3q29 genes at 25°C, and 3-4 day old adult Drosophila heads were used to quantify the level of expression compared with Elav-GAL4 controls. Elav-GAL4;;Dicer2 flies crossed with CG5359 flies showed overexpression of tiptop (Green et al., 2014) and were therefore excluded from further experiments. A list of full genotypes for fly crosses used in these experiments is provided in Supplementary File 2, and statistics for these data are provided in Supplementary File 5.

Strategy for identifying cellular phenotypes and genetic interactions of homologs of 3q29 genes. We first knocked down individual or pairs of 14 Drosophila homologs of human genes in the 3q29 region using tissue-specific RNAi. After screening for global phenotypes of RNAi lines for individual homologs of 3q29 genes, we tested 314 pairwise interactions using the fly eye system, and found that Cbp20 (NCBP2) enhanced the phenotypes of other homologs of 3q29 genes and also interacted with homologs of known neurodevelopmental genes outside of the 3q29 region. Next, we assayed for deeper cellular and neuronal phenotypes of flies with individual and pairwise knockdown of homologs of 3q29 genes, and observed cellular defects that identified apoptosis and cell cycle as underlying mechanisms associated with the deletion. We confirmed our results by rescuing cellular phenotypes with overexpression of the apoptosis inhibitor Diap1 as well as by analyzing genes differentially expressed with knockdown of fly homologs of 3q29 genes. Finally, we tested a subset of three homologs of 3q29 genes in the X. laevis vertebrate model system by injecting two- or four-cell stage embryos with GFP and morpholinos (MOs) for X. laevis homologs of 3q29 genes to observe abnormal eye morphology, as well as injecting one cell with GFP and MOs at the two-cell stage to observe abnormal brain morphology. We found similar developmental defects to those observed in Drosophila, including increased apoptosis that was enhanced with pairwise knockdown of X. laevis homologs of 3q29 genes and rescued with overexpression of the apoptosis inhibitor xiap. X. laevis embryo diagrams were produced by Nieuwkoop and Faber (Nieuwkoop and Faber, 1994) and provided by Xenbase (Karimi et al., 2018).

Neurodevelopmental defects in flies with knockdown of individual homologs of 3q29 genes. (A) Percentage of flies with tissue-specific RNAi knockdown of homologs of 3q29 genes (listed with their human counterparts) that manifest lethality or developmental phenotypes. (B) Eight homologs of 3q29 genes with pan-neuronal RNAi knockdown showed defects in climbing ability over ten days (two-way repeated measures ANOVA, p<1×10⁻⁴, df = 8, F = 21.097). Data represented show mean ± standard deviation of 10 independent groups of 10 flies for each homolog. (C) Representative brightfield adult eye images of flies with eye-specific GMR-GAL4;UAS-Dicer2 (scale bar = 100 µm) RNAi knockdown of individual homologs of 3q29 genes show rough eye phenotypes. The boxplot shows Flynotyper-derived phenotypic scores for eyes with knockdown of homologs of 3q29 genes (n = 10–14, *p < 0.05, one-tailed Mann–Whitney test with Benjamini-Hochberg correction). (D) Boxplot of adult eye area in flies with GMR-GAL4 RNAi knockdown of fly homologs of 3q29 genes (n = 13–16, *p < 0.05, two-tailed Mann–Whitney test with Benjamini-Hochberg correction). (E) Confocal images of pupal eyes (scale bar = 5 µm) stained with anti-DLG (top) and larval eye discs (scale bar = 30 µm) stained with anti-pH3 (middle) and anti-dcp1 (bottom) illustrate cellular defects posterior to the morphogenetic furrow (white box) upon knockdown of select fly homologs of 3q29 genes. Yellow circles in DLG images indicate cone cell defects, white circles indicate bristle cell defects, yellow arrows indicate rotation defects, and yellow arrowheads indicate secondary cell defects. To account for reduced DLG expression in pupal eyes with knockdown of dlg1, images were taken at a higher intensity than control images (see Methods). (F) Boxplot of pH3-positive cells in larval eye discs of flies with knockdown of homologs of 3q29 genes (n = 9–12, *p < 0.05, two-tailed Mann–Whitney test with Benjamini-Hochberg correction). (G) Boxplot of dcp1-positive cells in larval eye discs of flies with knockdown of homologs of 3q29 genes (n = 11–12, *p < 0.05, two-tailed Mann–Whitney test with Benjamini-Hochberg correction). All boxplots indicate median (center line), 25th and 75th percentiles (bounds of box), and minimum and maximum (whiskers), with red dotted lines representing the control median. Results for a subset of climbing ability, adult eye area, and pH3 staining experiments were replicated in independent experimental batches (Figure 2—Figure Supplement 9). A list of full genotypes for fly crosses used in these experiments is provided in Supplementary File 2.
Several fly homologs for genes within the 3q29 region have previously been associated with a range of neuronal defects during fly development (Figure 1—Figure Supplement 3). For example, loss of dlg1 contributes to morphological and physiological defects at the neuromuscular junction, as well as increased brain size, abnormal courtship behavior, and loss of gravitaxis response (Armstrong et al., 2006; Mendoza-Topaz et al., 2008; Thomas et al., 1997). Similarly, Pak mutant flies exhibited extensive defects in the axonal targeting of sensory and motor neurons (Hing et al., 1999; Kim et al., 2003), in addition to abnormal NMJ and mushroom body development (Ng and Luo, 2004; Parnas et al., 2001). We sought to determine whether fly homologs for other genes in the 3q29 region also contribute to defects in neuronal function, and therefore performed climbing assays for motor defects and staining of larval brains for axonal targeting with pan-neuronal knockdown of the fly homologs. Interestingly, Elav-GAL4 mediated pan-neuronal knockdown caused partial larval or pupal lethality in dlg, Tsf2, and CG5543 (WDR53) flies (Figure 2A), and about 30% of adult flies with knockdown of dlg1 did not survive beyond day 5 (Figure 2—Figure Supplement 1B), indicating an essential role for these genes in neuronal development. Furthermore, we found that flies with pan-neuronal knockdown of several homologs of 3q29 genes, including dlg1 and Cbp20, exhibited a strong reduction in climbing ability over ten days (Figure 2B, Video 1), suggesting that these genes could contribute to abnormalities in synaptic and motor functions (Sherwood et al., 2004). We next examined the axonal projections of photoreceptor cells into the optic lobe by staining third instar larval brains with anti-chaoptin. We found that GMR-GAL4 mediated eye-specific knockdown of Cbp20, dlg1, Pak and Fsn (FBXO45) showed several axonal targeting defects (Figure 2—Figure Supplement 1C, Figure 2—Figure Supplement 2). Our results recapitulated the previous findings in Pak mutant flies (Hing et al., 1999), and were similar to targeting defects observed in models of other candidate neurodevelopmental genes, including the Drosophila homologs for human DISC1 and FMR1 (Chen et al., 2011; Morales et al., 2002). Overall, our data show that multiple conserved homologs of genes in the 3q29 region beyond just dlg1 or Pak are important for Drosophila neurodevelopment, suggesting an oligogenic model for pathogenicity of the deletion as opposed to a single causative gene.

Comparison of animal model phenotypes with knockdown or knockout of homologs of 3q29 genes. Blue shaded boxes indicate previously identified phenotypes for individual homologs of 3q29 genes, while “X” marks indicate recapitulated and novel phenotypes identified in our study. Gray-shaded boxes indicate that a homolog was not present in the model organism. Fly phenotypes were obtained from FlyBase (Thurmond et al., 2019), X. laevis phenotypes were obtained from Xenbase (Karimi et al., 2018), and mouse knockout model phenotypes were obtained from the Mouse Genome Informatics database (Bult et al., 2019).

Developmental defects in flies with tissue-specific knockdown of individual homologs of 3q29 genes. (A) Images of adult fly wings (scale bar = 500um) show a range of phenotypic defects due to wing-specific beadexMS1096-GAL4 RNAi knockdown of fly homologs of 3q29 genes. (B) Adult flies with pan-neuronal RNAi knockdown of dlg1 showed approximately 30% lethality between days 1-4 (one-way repeated measures ANOVA, p<1×10⁻⁴, df = 1, F = 54.230), which was not observed in control Elav-GAL4 or Cbp20 knockdown flies. Data represented shows mean ± standard deviation of 10 independent groups of 10 flies for each homolog. (C) Representative confocal images of larval eye discs stained with anti-chaoptin (scale bar = 30 µm) illustrate defects in axonal targeting (highlighted by white arrows) from the retina to the optic lobes of the brain upon eye-specific knockdown of fly homologs of 3q29 genes. Note that n=8-20 larval eye disc preparations were assessed for each RNAi line tested. A list of full genotypes for fly crosses used in these experiments is provided in Supplementary File 2.

Summary of scoring for phenotypic severity of axon guidance defects upon individual and pairwise knockdown of homologs of 3q29 genes. Individual larval eye disc images were assigned mild, moderate or severe scores based on the severity of axon projection loss observed in each eye disc. We found that the mild to moderate defects observed with knockdown of Cbp20 were enhanced with concomitant knockdown of dlg1 or Fsn, while Diap1 overexpression partially rescued the defects observed with knockdown of Cbp20 or dlg1. A list of full genotypes for fly crosses used in these experiments is provided in Supplementary File 2.
Drosophila eye models for genes within the 3q29 region show cellular defects
The Drosophila compound eye has been classically used for performing high-throughput genetic screens and quantitative assays of cellular and neurodevelopmental defects (Thomas and Wassarman, 1999). In fact, about two-thirds of all vital genes in the fly genome are predicted to be involved in fly eye development (Thaker and Kankel, 1992). For instance, the Drosophila eye model was recently used to screen a large set of intellectual disability genes (Oortveld et al., 2013), and genetic interaction studies using the fly eye have identified modifier genes for Rett syndrome, spinocerebellar ataxia type 3, and other conserved developmental processes (Bilen and Bonini, 2007; Cukier et al., 2008; Neufeld et al., 1998). We used the developing fly eye as an in vivo system to quantify the effect of gene knockdown on adult eye morphology, cellular organization in the pupal eye, and cell proliferation and death in the larval imaginal eye disc (Figure 2—Figure Supplement 3). The wild-type adult Drosophila eye consists of about 750 ommatidia containing different cell types arranged in a regular hexagonal structure, which can be easily perturbed by genetic modifications (Cagan and Ready, 1989; Kumar, 2012). Because of this, we first performed eye-specific RNAi knockdown of fly homologs of genes in the 3q29 region using GMR-GAL4, and measured the rough eye phenotype of each knockdown line using Flynotyper, a quantitative tool that calculates a phenotypic score based on defects in ommatidial arrangement (Iyer et al., 2016). We found that eye-specific knockdown of 8 out of 13 homologs of 3q29 genes showed significant external eye phenotypes compared with control GMR-GAL4 flies, while knockdown of Tsf2 caused lethality (Figure 2C, Figure 2—Figure Supplement 4). For example, knockdown of Cbp20 resulted in a severe rough eye phenotype that was comparable to knockdown of other neurodevelopmental genes (Iyer et al., 2016), such as Prosap (SHANK3) and kis (CHD8) (Figure 2—Figure Supplement 5).

Examination of cellular phenotypes in the Drosophila eye. We tested individual and pairwise knockdown of fly homologs of 3q29 genes for cellular phenotypes in the adult, pupal and larval eyes. (A) We first used the Flynotyper software (Iyer et al., 2016) to quantify the degree of ommatidial disorganization leading to rough eye phenotypes in adult flies, as represented by the distance and angles between adjacent ommatidia (yellow arrows). (B) We next stained pupal eyes with anti-DLG to observe changes in the number and arrangement of ommatidial cells, including cone cells (c), bristle cells (b), and primary, secondary and tertiary cells (1,2,3). We also examined the organization of the photoreceptor cells (R1-R7, with R8 not visible) in each ommatidium by staining the pupal eyes with Phalloidin. (C) We finally stained larval eye discs with markers for cellular processes, such as pH3 for proliferating cells and dcp1 for apoptosis. As the progression of the morphogenetic furrow (MF) across the larval eye discs leads to proliferation and differentiation of photoreceptor neurons (Greenwood and Struhl, 1999), we examined changes in the number of stained cells posterior or adjacent to the MF. (D) Scatter plot of dcp1, pH3, TUNEL, and BrdU-positive cell counts in larval eye discs with knockdown of homologs of 3q29 genes quantified using two ImageJ plugins, AnalyzeParticles and Image-based Tool for Counting Nuclei (ITCN). As the two methods showed a strong correlation with each other (Pearson correlation, n=285, r=0.736, p<2.2×10⁻¹⁶), we used ITCN counts to display cell count data in the manuscript.

Phenotypic screening for flies with eye-specific knockdown of individual fly homologs of 3q29 genes. (A) Representative brightfield adult eye images of flies with GMR-GAL4;UAS-Dicer2 RNAi knockdown of fly homologs of 3q29 genes (scale bar = 100 µm) show a wide range of phenotypic severity. (B) Box plot of average ommatidial diameter in flies with GMR-GAL4 knockdown of select fly homologs of 3q29 genes (n = 15, *p < 0.05, two-tailed Mann–Whitney test with Benjamini-Hochberg correction). (C) Box plot of phenotypic scores derived from Flynotyper for eye-specific GMR-GAL4 RNAi knockdown of 13 fly homologs of 3q29 genes (n = 5–20, *p < 0.05, one-tailed Mann–Whitney test with Benjamini-Hochberg correction). (D) Box plot of phenotypic scores derived from Flynotyper for eye-specific GMR-GAL4;UAS-Dicer2 (left) and GMR-GAL4 (right) RNAi knockdown of nine validation lines for fly homologs of 3q29 genes (n = 5–14, *p < 0.05, one-tailed Mann–Whitney test with Benjamini-Hochberg correction). All boxplots indicate median (center line), 25th and 75th percentiles (bounds of box), and minimum and maximum (whiskers), with red dotted lines representing the control median. A list of full genotypes for fly crosses used in these experiments is provided in Supplementary File 2.

Table comparing Flynotyper scores for flies with GMR-GAL4;UAS-Dicer2 RNAi knockdown of homologs of 3q29 genes (shaded in grey) with previously published scores for flies with GAL4;UAS-Dicer2 RNAi knockdown of homologs of candidate neurodevelopmental genes (Iyer et al., 2016).
To examine the cellular mechanisms underlying the rough eye phenotypes observed with knockdown of fly homologs of 3q29 genes, we first measured changes in area and ommatidial size of the adult eyes. We found a significant reduction in eye size with knockdown of CG8888 and Cbp20, while the eyes of flies with knockdown of dlg1 were significantly larger than GMR-GAL4 controls (Figure 2D). Similarly, we observed decreases in ommatidial diameter with knockdown of Cbp20 and CG8888, suggesting that these genes also contribute to abnormal cell growth phenotypes (Figure 2—Figure Supplement 4B). We also assessed the cellular structure of 44 hour-old pupal eyes by staining the ommatidial and photoreceptor cells with anti-DLG, a septate junction marker, and Phalloidin, a marker for F-actin at cell boundaries (Figure 2—Figure Supplement 3B). We found that knockdown of 11 out of 12 tested fly homologs of 3q29 genes caused disorganization or loss of the photoreceptor neurons and ommatidial cells (Figure 2E, Figure 2—Figure Supplement 6A-B, Figure 2—Figure Supplement 7). For example, pupal eyes with knockdown of CG8888, dlg1, Cbp20 and CG5543 all showed defects in cone cell orientation and ommatidial rotation compared with control GMR-GAL4 flies. Furthermore, Cbp20 and dlg1 knockdown flies showed hexagonal defects and severe disorganization of photoreceptor neurons, while Cbp20 knockdown flies also showed fused secondary cells and dlg1 knockdown flies showed a complete loss of bristle cells.

Cellular phenotypes of flies with eye-specific knockdown of individual fly homologs of 3q29 genes. (A) Confocal images of pupal eyes (scale bar = 5 µm) stained with anti-DLG illustrate a range of defects in ommatidial organization upon GMR-GAL4 RNAi knockdown of fly homologs of 3q29 genes. Yellow circles indicate cone cell defects, white circles indicate bristle cell defects, yellow arrows indicate rotation defects, and yellow arrowheads indicate secondary cell defects. (B) Confocal images of pupal eyes (scale bar = 5 µm) stained with Phalloidin illustrate defects in photoreceptor cell count and organization upon knockdown of fly homologs of 3q29 genes. (C) Confocal images of larval eye discs (scale bar = 30 µm) stained with anti-pH3 illustrate changes in cell proliferation upon knockdown of select fly homologs of 3q29 genes. (D) Larval eye discs (scale bar = 30 µm) stained with BrdU (top) and TUNEL (bottom) illustrate abnormal cell cycle and apoptosis defects, respectively, due to eye-specific knockdown of Cbp20 and dlg1. (E) Box plot of BrdU-positive cells in the larval eye discs of flies with knockdown of dlg1 and Cbp20 (n = 7–12, *p < 0.05, two-tailed Mann–Whitney test with Benjamini-Hochberg correction). (F) Box plot of TUNEL-positive cells in the larval eye discs of flies with knockdown of dlg1 and Cbp20 (n = 8, *p < 0.05, two-tailed Mann–Whitney test with Benjamini-Hochberg correction). Results for the TUNEL staining experiments were replicated in an independent experimental batch (Figure 2—Figure Supplement 9). All boxplots indicate median (center line), 25th and 75th percentiles (bounds of box), and minimum and maximum (whiskers), with red dotted lines representing the control median. A list of full genotypes for fly crosses used in these experiments is provided in Supplementary File 2.

Analysis of defects in ommatidial cells with GMR-GAL4 RNAi knockdown of fly homologs of 3q29 genes. The number of “+” symbols displayed in the table indicate the severity of the observed cellular defects. Note that n=4-16 pupal eye preparations were assessed for each RNAi line tested. A list of full genotypes for fly crosses used in these experiments is provided in Supplementary File 2.
We next hypothesized that abnormal proliferation and apoptosis may contribute to the cellular defects observed with knockdown of fly homologs of 3q29 genes. To test this, we stained the third instar larval eye discs for select knockdowns of individual homologs of 3q29 genes with anti-pH3 (phospho-Histone H3 (Ser10)) and Drosophila caspase-1 (dcp1), markers for proliferating and apoptotic cells, and quantified the number of cells posterior and adjacent to the morphogenetic furrow (Figure 2—Figure Supplement 3C). We observed a significant decrease in pH3-positive cells for CG8888 knockdown flies and trends towards increased pH3-positive cells for PIG-Z (PIGZ) and dlg1 knockdown flies (Figure 2E-F, Figure 2—Figure Supplement 6C), while knockdown of dlg1 also led to significant increases in cells stained with bromodeoxyuridine (BrdU), a marker for replicating cells (Figure 2—Figure Supplement 6D-E). Flies with knockdown of Cbp20 or dlg1 also showed a significant increase in apoptotic dcp1-positive cells compared with GMR-GAL4 controls (Figure 2G), which we validated using TUNEL assays for these lines (Figure 2—Figure Supplement 6F). We further tested for proliferation and apoptosis in the third instar larval wing discs of flies with knockdown of homologs of 3q29 genes using the beadexMS1096-GAL4 driver, and observed changes in both processes with knockdown of dlg1, CG8888 and Cbp20 (Figure 2—Figure Supplement 8). Knockdown of Cbp20 in particular showed dcp1-positive staining across the entire wing pouch in the larval wing disc. These data suggest that knockdown of multiple fly homologs of genes in the 3q29 region contribute to defects in apoptosis and proliferation during early development, leading to the observed defects in cell count and organization (Table 1).
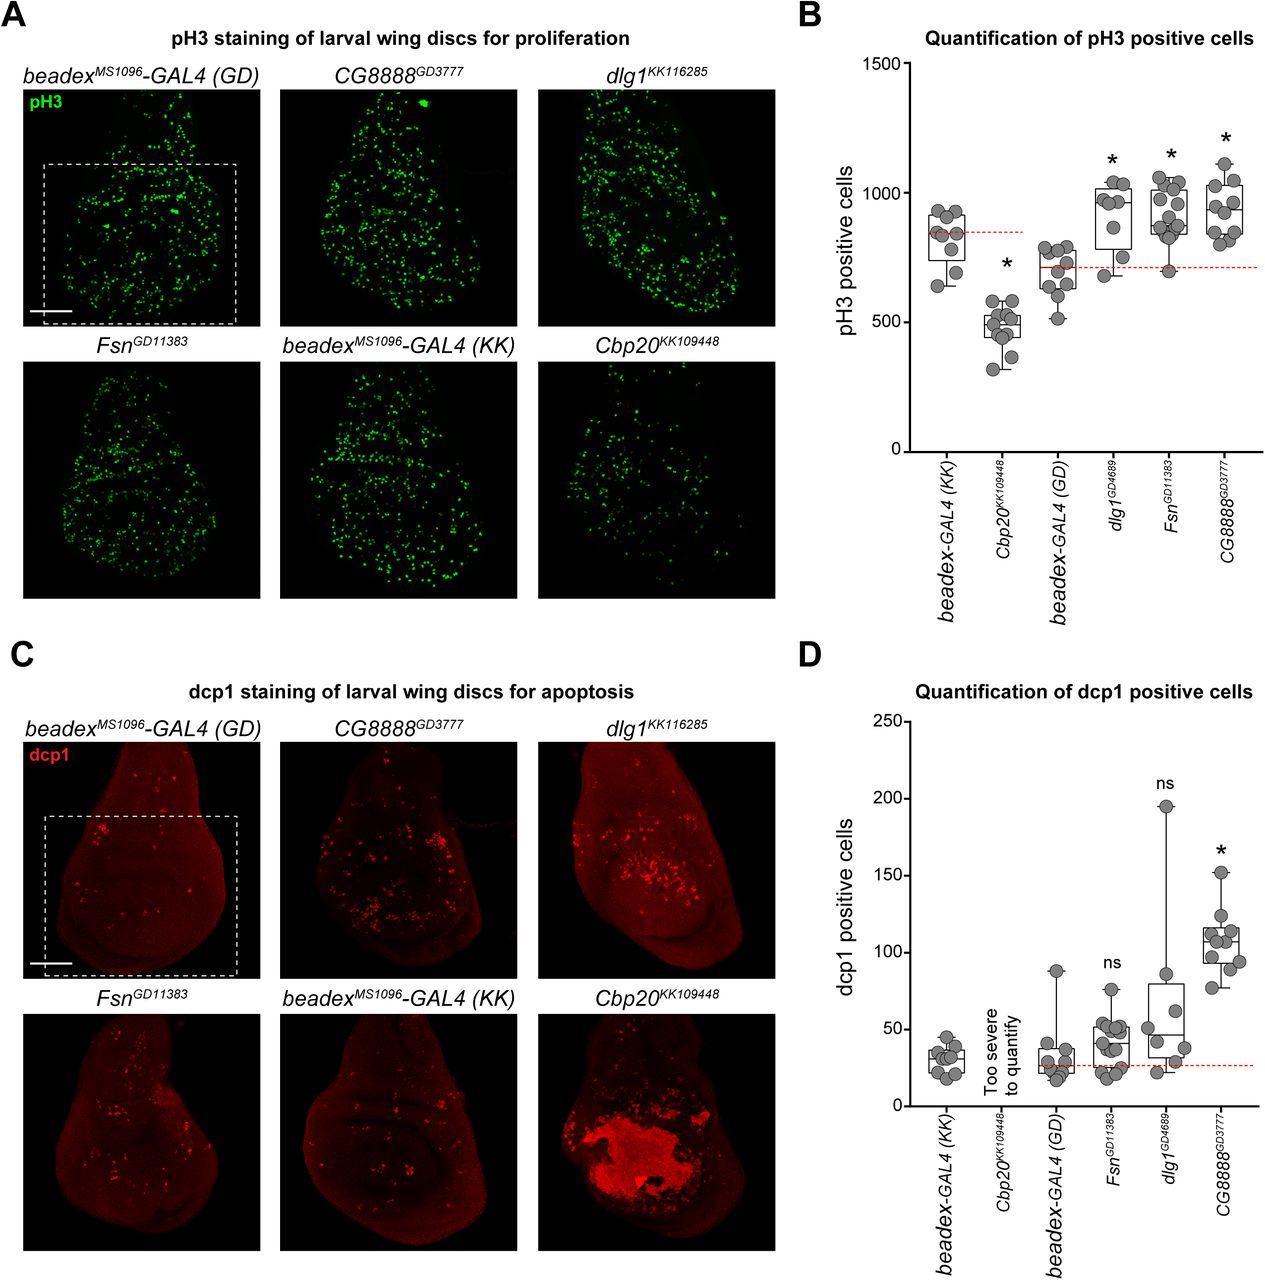
Cellular phenotypes of flies with wing-specific knockdown of individual fly homologs of 3q29 genes. (A) Larval wing discs (scale bar = 50 µm) stained with pH3 illustrate abnormal cell proliferation due to RNAi knockdown of select fly homologs of 3q29 genes, compared with appropriate VDRC GD and KK beadexMS1096-GAL4 controls. We examined changes in the number of stained cells within the wing pouch of the wing disc (white box), which becomes the adult wing. (B) Box plot of pH3-positive cells in the larval wing discs of flies with knockdown of select fly homologs of 3q29 genes (n = 8–15, *p < 0.05, two-tailed Mann–Whitney test with Benjamini-Hochberg correction). (C) Larval wing discs (scale bar = 50 µm) stained with anti-dcp1 show abnormal apoptosis due to knockdown of select fly homologs of 3q29 genes compared with appropriate VDRC GD and KK beadexMS1096-GAL4 controls. (D) Box plot of dcp1-positive cells in the larval wing discs of flies with knockdown of select fly homologs of 3q29 genes (n = 8–15, *p < 0.05, two-tailed Mann–Whitney test with Benjamini-Hochberg correction). Cbp20 flies showed severe dcp1 staining across the entire wing disc and could not be quantified. All boxplots indicate median (center line), 25th and 75th percentiles (bounds of box), and minimum and maximum (whiskers), with red dotted lines representing the control median. A list of full genotypes for fly crosses used in these experiments is provided in Supplementary File 2.
Summary of major experiments for knockdown of homologs of 3q29 genes show widespread cellular and neuronal defects.
Interactions between fly homologs of 3q29 genes enhance neuronal phenotypes
As knockdown fly models for homologs of multiple 3q29 genes showed a variety of neuronal, developmental, and cellular defects, we hypothesized that interactions between multiple genes in the 3q29 region could contribute to the neurodevelopmental phenotypes of the entire deletion. We therefore generated GMR-GAL4 recombinant lines for nine fly homologs of 3q29 genes, crossed these lines with multiple RNAi or mutant lines for other homologs of 3q29 genes to generate 94 pairwise knockdowns with 161 two-hit crosses, and assessed changes in the severity of eye phenotypes using Flynotyper (Figure 1, Figure 3—Figure Supplement 1). We found a significant enhancement in phenotypic severity for 39 pairwise knockdowns of homologs of 3q29 genes, validated with a second line when available, compared with knockdowns for individual homologs of 3q29 genes (Figure 3A, Figure 3—Figure Supplement 2-3). In fact, we found that 19 out of 21 pairwise interactions involving Cbp20 as either a first or second-hit gene resulted in more severe eye phenotypes, suggesting that reduced expression of Cbp20 drastically modifies the morphological phenotypes of other homologs of 3q29 genes (Figure 3B-D). For further validation, we also compared pairs of reciprocal crosses (i.e. Fsn/CG8888 versus CG8888/Fsn) and confirmed concordant results for 19 out of 26 reciprocal interactions, including 14/16 reciprocal interactions involving Cbp20 (Figure 3—Figure Supplement 1). We also found a non-significant increase in severity for dlg1/Pak knockdown flies using both RNAi and mutant lines, concordant with enhanced neuromuscular junction and circadian rhythm defects observed in mutant dlg1/Pak flies described by Grice and colleagues (Grice et al., 2015).

Screening for pairwise interactions of fly homologs of 3q29 genes in the Drosophila eye and nervous system. (A) Heatmap showing average changes in phenotypic scores for pairwise GMR-GAL4 RNAi knockdown of fly homologs of 3q29 genes in the adult eye, compared with recombined lines for individual homologs of 3q29 genes. Gray boxes indicate crosses without available data. Boxplots of phenotypic scores for pairwise knockdown of (B) Cbp20 and (C) dlg1 with other fly homologs of 3q29 genes are shown (n = 5–14, *p < 0.05, two-tailed Mann–Whitney test with Benjamini-Hochberg correction). Green arrows indicate an example pair of reciprocal lines showing enhanced phenotypes compared with their respective single-hit recombined controls. Crosses with the mutant line Tsf2KG01571 are included along with RNAi lines for other homologs of 3q29 genes, as eye-specific RNAi knockdown of Tsf2 was lethal. (D) Representative brightfield adult eye images of flies with pairwise knockdown of fly homologs of 3q29 genes (scale bar = 100 µm) show enhancement (Enh.) of rough eye phenotypes compared with recombined lines for individual homologs of 3q29 genes. (E) Representative confocal images of larval eye discs stained with anti-chaoptin (scale bar = 30 µm) illustrate enhanced defects (Enh.) in axonal targeting (white arrows) from the retina to the optic lobes of the brain with eye-specific knockdown of Cbp20/dlg1 and Cbp20/Fsn compared with Cbp20 knockdown. Note that n=9-17 larval eye disc preparations were assessed for each tested interaction. (F) Flies with pan-neuronal Elav-GAL4 pairwise knockdown of homologs of 3q29 genes showed enhanced defects in climbing ability over ten days (two-way repeated measures ANOVA, p<4.00×10⁻⁴, df = 2, F = 7.966) compared with recombined Cbp20 knockdown. Data represented show mean ± standard deviation of 10 independent groups of 10 flies for each line tested. Results for the climbing assays were replicated in an independent experimental batch (Figure 2—Figure Supplement 9). All boxplots indicate median (center line), 25th and 75th percentiles (bounds of box), and minimum and maximum (whiskers), with red dotted lines representing the control median. A list of full genotypes for fly crosses used in these experiments is provided in Supplementary File 2.

Replication of Drosophila experimental results for individual and pairwise knockdown of homologs of 3q29 genes. (A) Replication dataset for climbing ability of select homologs of 3q29 genes over ten days. We replicated the defects in climbing ability observed with pan-neuronal RNAi knockdown of Cbp20 and dlg1, while climbing defects in flies with knockdown of Fsn flies were not replicated in the second experimental batch and were therefore excluded from the main dataset (Figure 2B). Data represented show mean ± standard deviation of 7-10 independent groups of 10 flies for each homolog. (B) Replication dataset for climbing ability of pairwise knockdown of homologs of 3q29 genes over ten days. We replicated the defects in climbing ability observed with pan-neuronal RNAi knockdown of Cbp20/dlg1 and Cbp20/Fsn compared with recombined Cbp20 knockdown (Figure 3F). Data represented show mean ± standard deviation of 5 independent groups of 10 flies for each homolog. (C) Replication dataset for adult eye area in flies with GMR-GAL4 RNAi knockdown of homologs of 3q29 genes (n = 10-14, *p < 0.05, two-tailed Mann–Whitney test with Benjamini-Hochberg correction). We replicated the decreased eye sizes in flies with knockdown of Cbp20 and CG8888, while flies with knockdown of dlg1 showed a non-significant (p=0.154) increase in eye size (Figure 2D). (D) Confocal images for replication dataset larval eye discs (scale bar = 30 µm) stained with anti-pH3 (top) and TUNEL (bottom) illustrate cellular defects posterior to the morphogenetic furrow (white box) upon knockdown of select fly homologs of 3q29 genes (Figure 2E). (E) Replication dataset for pH3-positive cells in larval eye discs of flies with knockdown of homologs of 3q29 genes (n = 9-10, two-tailed Mann–Whitney test with Benjamini-Hochberg correction). As in the main dataset (Figure 2F), we observed no significant changes in cell proliferation for flies with knockdown of Cbp20 and dlg1. (F) Replication dataset for TUNEL-positive cells in larval eye discs of flies with knockdown of homologs of 3q29 genes (n = 6-8, *p < 0.05, two-tailed Mann–Whitney test with Benjamini-Hochberg correction). We replicated the increased apoptosis phenotypes observed with knockdown of Cbp20 and dlg1 (Figure 2—Figure Supplement 6F). All boxplots indicate median (center line), 25th and 75th percentiles (bounds of box), and minimum and maximum (whiskers), with red dotted lines representing the control median. A list of full genotypes for fly crosses used in these experiments is provided in Supplementary File 2.
As Cbp20 knockdown enhanced the rough eye phenotypes of multiple homologs of other 3q29 genes, we next tested for enhancement of other neuronal defects among flies with knockdown of Cbp20 and other homologs of 3q29 genes. We found that the simultaneous knockdown of Cbp20 with dlg1 or Fsn led to an increase in severity of axon targeting defects (Figure 3E). For instance, while knockdown of Cbp20 mostly led to mild-to-moderate axon guidance defects, such as loss of R7-R8 axon projection into the medulla, we observed more severe losses of projection across all of the axons with simultaneous knockdown of Cbp20 and dlg1 or Fsn (Figure 2—Figure Supplement 2). We also tested pan-neuronal Elav-GAL4 knockdown of select pairs of homologs, and found that both Cbp20/dlg1 and Cbp20/Fsn significantly enhanced the severity of climbing defects observed with knockdown of Cbp20 (Figure 3F, Video 2). Overall, these data suggest that Cbp20 interacts with other homologs of genes in the 3q29 region to enhance the observed cellular and neuronal defects, suggesting that NCBP2 is a key modifier of the developmental phenotypes associated with the deletion (Table 1).
To further characterize the functional effects of interactions between homologs of 3q29 genes, we analyzed changes in gene expression by performing RNA-sequencing of heads from flies with select pan-neuronal knockdown of individual (Cbp20, dlg1, Fsn, and Pak) and pairs (Cbp20/dlg1 and Cbp20/Fsn) of homologs of 3q29 genes. We identified differentially-expressed genes in each of the tested fly models compared with Elav-GAL4 controls, and performed enrichment analysis on both the differentially-expressed fly genes and their corresponding human homologs (Supplementary File 3). We found that knockdown of each of the individual homologs showed enrichment for dysregulation of cellular and developmental processes (Figure 3—Figure Supplement 4A). For example, flies with knockdown of dlg1 and Cbp20 showed enrichment for dysregulation of homologs for human synaptic transmission genes, including Glt (NLGN1) and nAChRβ3 (HTR3A). Furthermore, flies with knockdown of Cbp20 were enriched for dysregulated fly genes related to metabolic processes, while knockdown of Fsn led to dysregulation of fly genes involved in response to external stimuli and immune response. We also found that homologs of the key signaling genes dysregulated in mouse models of the 3q29 deletion reported by Baba and colleagues (Baba et al., 2019) were differentially expressed in our fly models for homologs of 3q29 genes. In fact, knockdown of Fsn led to altered expression of all “early immediate” signaling genes dysregulated in the deletion mouse model (Baba et al., 2019). While dysregulated genes in Cbp20/dlg1 knockdown flies showed enrichments for protein folding and sensory perception, Cbp20/Fsn knockdown flies were uniquely enriched for dysregulated cell cycle genes, including Aura (AURKA), Cdk1 (CDK1), lok (CHEK2), and CycE (CCNE1) (Figure 3—Figure Supplement 4B-C). We similarly found 17 differentially-expressed homologs corresponding to human apoptosis genes in Cbp20/Fsn knockdown flies, including homologs for the DNA fragmentation gene Sid (ENDOG) and the apoptosis signaling genes tor (RET) and Hsp70Bb (HSPA1A). Furthermore, we found a strong enrichment for fly genes whose human homologs are preferentially expressed in early and mid-fetal brain tissues among the dysregulated genes in Cbp20/Fsn knockdown flies (Figure 3—Figure Supplement 4D). These data suggest that Cbp20 interacts with other homologs of genes in the 3q29 region to disrupt a variety of key biological functions, including apoptosis and cell cycle pathways as well as synaptic transmission and metabolic pathways, ultimately leading to enhanced neuronal phenotypes (Table 1).

Screening for pairwise interactions among fly homologs of 3q29 genes. “All interactions” indicates the number of pairwise crosses where at least one second-hit RNAi or mutant line showed enhancement of the single-hit phenotype, while “Validated” indicates the number of interactions which have two or more crosses with a second-hit RNAi or mutant line (if available) showing the same result. “Reciprocal cross” indicates the number of interactions with concordant results across pairs of reciprocal cross (i.e. Cbp20/dlg1 vs. dlg1/Cbp20). These totals include crosses with the mutant line Tsf2KG01571, as eye-specific RNAi knockdown of Tsf2 was lethal, as well as flies heterozygous for dlg1 RNAi and homozygous for Cbp20 RNAi. Crosses with other RNAi or mutant lines for the same gene (shaded in grey) are included as validation lines tested but were not counted as interactions. A list of full genotypes for fly crosses used in these experiments is provided in Supplementary File 2.
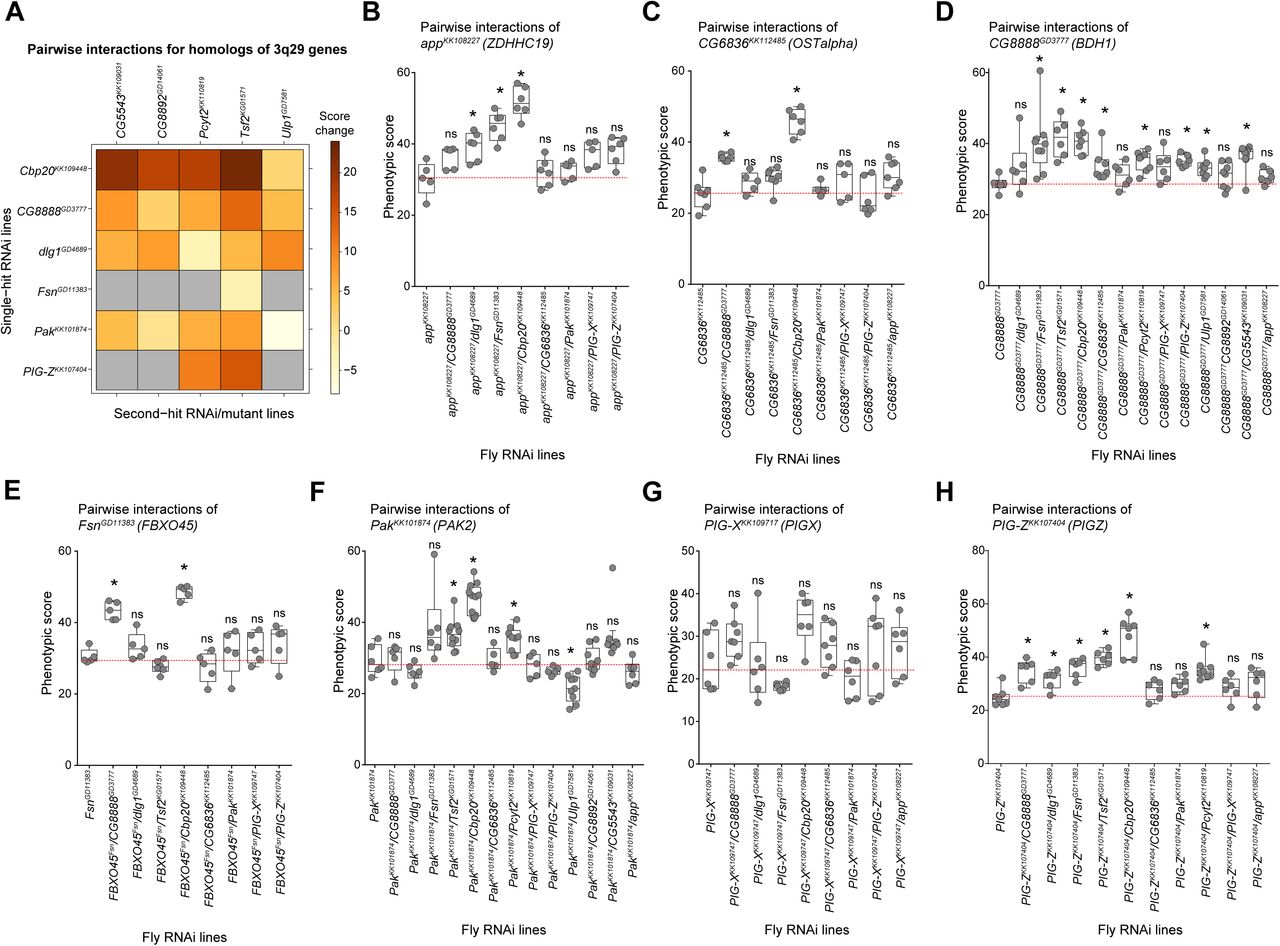
Phenotypic screening for pairwise interactions of homologs of 3q29 genes in the adult fly eye. (A) Heatmap showing average changes in phenotypic scores for pairwise GMR-GAL4 RNAi knockdown of fly homologs of 3q29 genes in the adult eye, compared with recombined lines for individual homologs of 3q29 genes. Gray boxes indicate crosses without available data. Crosses with the mutant line Tsf2KG01571 are also included along with RNAi lines for other homologs of 3q29 genes, as eye-specific RNAi knockdown of Tsf2 was lethal. (B-H) Box plots of phenotypic scores for pairwise knockdowns of homologs of 3q29 genes compared with recombined lines for individual homologs of 3q29 genes (n = 5–12, *p < 0.05, two-tailed Mann–Whitney test with Benjamini-Hochberg correction). All boxplots indicate median (center line), 25th and 75th percentiles (bounds of box), and minimum and maximum (whiskers), with red dotted lines representing the control median. A list of full genotypes for fly crosses used in these experiments is provided in Supplementary File 2.

Validation lines for pairwise interactions of homologs of 3q29 genes in the adult fly eye. (A-F) Box plots of phenotypic scores for pairwise GMR-GAL4 RNAi knockdown of select fly homologs of 3q29 genes (Cbp20, CG8888, dlg1, Fsn, Pak, and PIG-Z) with validation RNAi and mutant lines for other homologs of 3q29 genes, compared with recombined lines for individual homologs of 3q29 genes (n = 4–14, *p < 0.05, two-tailed Mann–Whitney test with Benjamini-Hochberg correction), are shown. These crosses include flies homozygous for Cbp20 RNAi as well as flies homozygous for Cbp20 RNAi and heterozygous for dlg1 RNAi (green arrows). Note that the phenotypic scores derived from Flynotyper may not accurately capture the necrotic patches observed in these crosses. All boxplots indicate median (center line), 25th and 75th percentiles (bounds of box), and minimum and maximum (whiskers), with red dotted lines representing the control median. A list of full genotypes for fly crosses used in these experiments is provided in Supplementary File 2.

Transcriptome analysis of flies with knockdown of select homologs of 3q29 genes. (A) Clusters of Gene Ontology terms enriched among differentially-expressed fly genes (blue) and their corresponding human homologs (red) with individual and pairwise Elav-GAL4 RNAi knockdown of fly homologs of 3q29 genes (p< 0.05, Fisher’s Exact test with Benjamini-Hochberg correction) are shown. Black boxes indicate enrichment of each gene set for clusters of Gene Ontology terms. Full lists of enriched GO terms are provided in Supplementary File 3. (B) Enrichments for shared and unique differentially-expressed fly genes (blue) and their corresponding human homologs (red) with individual knockdown of Cbp20 and Fsn, as well as concomitant knockdown of Cbp20/Fsn, are shown. We found 229 genes uniquely dysregulated in flies with pairwise knockdown of Fsn and Cbp20, which were enriched for cell cycle function (p=0.011 for fly gene enrichment and p=1.12×10⁻⁸ for human homologs, Fisher’s Exact test with Benjamini-Hochberg correction). (C) Diagram showing human cell cycle and apoptosis genes whose fly homologs are differentially expressed with knockdown of Cbp20 and Fsn, as well as concomitant knockdown of Cbp20/Fsn. Red boxes indicate apoptosis genes, green boxes indicate cell cycle genes, and yellow boxes indicate genes associated with both functions. (D) Enrichments of human homologs of genes differentially expressed in flies with knockdown of Cbp20/Fsn across different brain tissues and developmental timepoints are shown (Specific Expression Analysis). The size of each hexagon represents the number of genes preferentially expressed at each tissue and timepoint, with concentric hexagons representing bins of genes with stronger levels of preferential expression. The shading of each hexagon represents the enrichment of differentially-expressed genes among genes preferentially expressed at each timepoint (p<0.1, Fisher’s Exact test with Benjamini-Hochberg correction). A list of full genotypes for fly crosses used in these experiments is provided in Supplementary File 2.
Finally, to complement the interactions among homologs of 3q29 genes that we identified in Drosophila, we examined the connectivity patterns of 3q29 genes within human gene interaction databases. Gene interaction networks derived from co-expression and protein-protein interaction data (Greene et al., 2015; Warde-Farley et al., 2010) showed large modules of connected genes within the 3q29 region, including a strongly-connected component involving 11 out of 21 3q29 genes (Figure 3—Figure Supplement 5A-B). However, the average connectivity among 3q29 genes within a brain-specific interaction network (Krishnan et al., 2016) was not significantly different from the connectivity of randomly-selected sets of genes throughout the genome (Figure 3—Figure Supplement 5C), suggesting that a subset of genes drive the complexity of genetic interactions within the region. This paradigm was previously observed among genes in the 22q11.2 deletion region, where interactions between PRODH and COMT modulate neurotransmitter function independently of other genes in the region (Paterlini et al., 2005). In fact, five genes in the 3q29 region, including NCBP2, PAK2, and DLG1, showed significantly higher connectivity to other 3q29 genes compared with the average connectivity of random sets of genes (Figure 3—Figure Supplement 5D). Interestingly, NCBP2 showed the highest connectivity of all genes in the region, further highlighting its role as a key modulator of genes in the region.

Connectivity of 3q29 genes in human gene interaction databases. (A) Genetic interactions of 3q29 genes in the context of a general human gene interaction network (GeneMania). The strongly connected component includes 11 out of the 21 total 3q29 genes. Black-shaded nodes represent the input 3q29 genes, while grey nodes represent connector genes in the network. Edge color represents the interaction data source (purple: co-expression, orange: predicted interaction), while edge thickness represents weighted scores for each interaction. (B) Genetic interactions of 19 genes in the 3q29 region in the context of a brain-specific human gene interaction network (GIANT). Large nodes represent the input 3q29 genes, while small nodes represent connector genes in the network. Edge color represents the weighted score for each interaction, from low-weighted connectivity (green) to high-weighted connectivity (red). (C) Histograms and smoothed normal distributions showing the average connectivity among genes in the 3q29 region (blue) along with two other large CNVs, 16p11.2 (red) and 22q11.2 deletion (green), within a brain-specific gene interaction network. Average connectivity is measured as the shortest weighted distance between two genes, with lower values representing stronger connectivity. Genes within the 3q29 and 22q11.2 deletions were not significantly more connected to each other (p>0.05, one-tailed Mann-Whitney test with Benjamini-Hochberg correction) than random sets of 21 genes throughout the genome (grey). However, genes within the 16p11.2 region were significantly more connected to each other than the random gene sets (p=0.003, one-tailed Mann-Whitney test with Benjamini-Hochberg correction). (D) Pairwise connectivity of individual 3q29 genes within a brain-specific gene interaction network, excluding six genes not present in the network (RNF168, ZDHHC19, LRRC33, OSTalpha, SMCO1, and TCTEX1D2). Average connectivity is measured as the shortest weighted distance between two genes, with lower values representing stronger connectivity. Underlined genes have a higher average connectivity (p<0.05, one-tailed Mann-Whitney test with Benjamini-Hochberg correction) to other genes in the region compared with random sets of 21 genes throughout the genome.
Interactions between Cbp20 and other homologs of 3q29 genes enhance apoptosis defects
Cell death and proliferation are two antagonistic forces that maintain an appropriate number of neurons during development (Yamaguchi and Miura, 2015). In fact, both processes have been previously identified as candidate mechanisms for several neurodevelopmental disorders (Ernst, 2016; Glantz et al., 2006; Pinto et al., 2010). While knockdown of Cbp20 with other homologs of 3q29 genes likely disrupts multiple cellular processes that contribute towards the enhanced cellular defects, we next specifically investigated the role of apoptosis towards these defects, as larval eye and wing discs with knockdown of Cbp20 showed strong increases in apoptosis. We observed black necrotic patches on the ommatidia in adult eyes with knockdown of Cbp20/dlg1 and Cbp20/Fsn, indicating an increase in cell death with these interactions (Figure 4A, Figure 4—Figure Supplement 1A). In fact, significantly larger regions of necrotic patches were observed in flies homozygous for Cbp20 RNAi and heterozygous for dlg1 RNAi (see Supplementary File 2 for full genotype annotation), suggesting that the knockdown of both homologs contributes to ommatidial cell death (Figure 4A). Furthermore, we found an enhanced disruption of ommatidial cell organization and loss of photoreceptors in pupal flies with concomitant knockdown of Cbp20 with dlg1, Fsn or CG8888, emphasizing the role of these genes in maintaining cell count and organization (Figure 4B-C, Figure 4—Figure Supplement 1B and 2). Based on these observations, we assayed for apoptotic cells in the larval eye discs of flies with knockdown of Cbp20 and other homologs of 3q29 genes. We observed significant increases in the number of apoptotic cells, as measured by dcp1 (Figure 4D-E) and TUNEL staining (Figure 4—Figure Supplement 1C-D), when Cbp20 was knocked down along with CG8888, dlg1, or Fsn. Cbp20/CG8888 knockdown flies also showed a decreased number of pH3-positive cells, suggesting that both apoptosis and proliferation are affected by the interaction between these two genes (Figure 4F).

Cellular phenotypes for pairwise knockdowns of homologs of 3q29 genes. (A) Box plot showing area of necrotic patches in adult fly eyes with heterozygous or homozygous Cbp20 RNAi and concomitant knockdown of Fsn or dlg1 (n=8-9, *p < 0.05, two-tailed Mann–Whitney test with Benjamini-Hochberg correction). (B) Confocal images of pupal eyes (scale bar = 5 µm) stained with DLG (top) and Phalloidin (bottom) illustrate enhanced defects in ommatidial and photoreceptor cell organization with concomitant GMR-GAL4 RNAi knockdown of Cbp20 and other fly homologs of 3q29 genes compared with Cbp20 knockdown. (C) Larval eye discs (scale bar = 30 µm) stained with TUNEL show increases in apoptosis with pairwise knockdown of Cbp20 and other fly homologs of 3q29 genes compared with recombined Cbp20 knockdown. (D) Box plot of TUNEL-positive cells in the larval eye discs of flies with pairwise knockdown of homologs of 3q29 genes (n = 9–13, *p < 0.05, two-tailed Mann–Whitney test with Benjamini-Hochberg correction). All boxplots indicate median (center line), 25th and 75th percentiles (bounds of box), and minimum and maximum (whiskers), with red dotted lines representing the control median. A list of full genotypes for fly crosses used in these experiments is provided in Supplementary File 2.
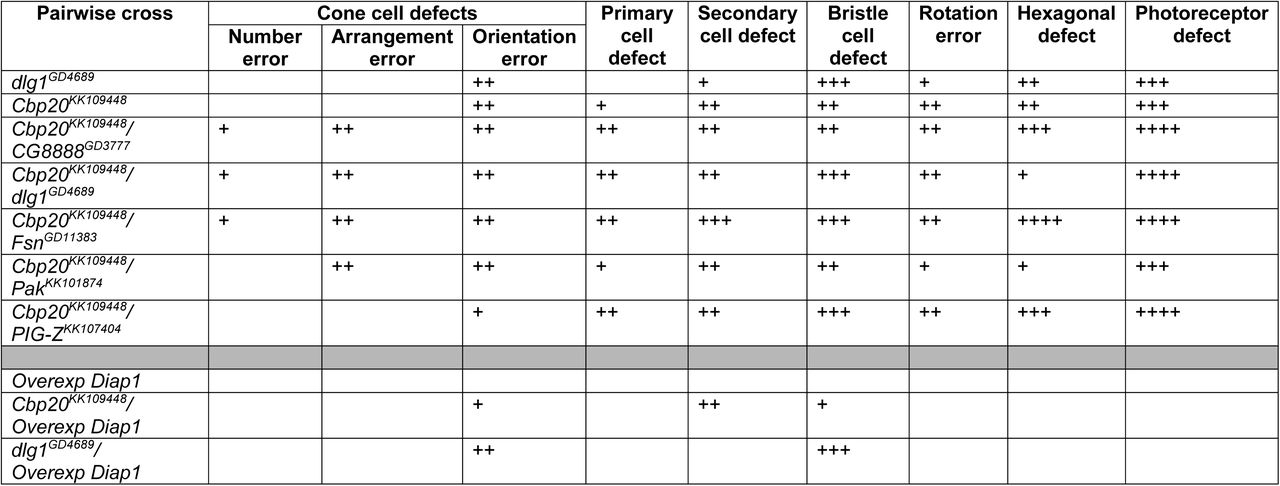
Analysis of defects in ommatidial cells with pairwise GMR-GAL4 RNAi knockdown of fly homologs of 3q29 genes. The number of “+” symbols displayed in the table indicate the severity of the observed cellular defects. Note that n=4-16 pupal eye preparations were assessed for each interaction cross tested. A list of full genotypes for fly crosses used in these experiments is provided in Supplementary File 2.

Cellular phenotypes with pairwise knockdown of fly homologs of 3q29 genes. (A) Representative brightfield adult eye images (scale bar = 100 µm) show that heterozygous GMR-GAL4 RNAi knockdown of dlg1 enhanced the rough eye phenotype and necrotic patches (yellow circles) of flies heterozygous or homozygous for Cbp20 RNAi. (B) Representative confocal images of pupal eyes (scale bar = 5 µm) stained with anti-DLG illustrate enhanced defects in ommatidial organization upon concomitant knockdown of Cbp20 with other fly homologs of 3q29 genes compared with Cbp20 knockdown. Yellow circles in DLG images indicate cone cell defects, white circles indicate bristle cell defects, yellow arrows indicate rotation defects, and yellow arrowheads indicate secondary cell defects. To account for reduced DLG expression in pupal eyes with knockdown of Cbp20/dlg1, images were taken at a higher intensity than control images (see Methods). (C) Representative confocal images of pupal eyes (scale bar = 5 µm) stained with Phalloidin illustrate enhanced defects in photoreceptor cell count and organization upon concomitant knockdown of Cbp20 and other fly homologs of 3q29 genes compared with Cbp20 knockdown. (D) Representative confocal images of larval eye discs (scale bar = 30 µm) stained with anti-dcp1 (top) and anti-pH3 (bottom) show enhanced defects in apoptosis and cell proliferation with pairwise knockdown of Cbp20 and other fly homologs of 3q29 genes compared with recombined Cbp20 knockdown. (E) Boxplot of dcp1-positive cells in the larval eye discs of flies with pairwise knockdown of homologs of 3q29 genes (n = 10–11, *p < 0.05, two-tailed Mann–Whitney test with Benjamini-Hochberg correction). (F) Boxplot of pH3-positive cells in the larval eye discs of flies with pairwise knockdown of homologs of 3q29 genes (n = 10–12, *p < 0.05, two-tailed Mann–Whitney test with Benjamini-Hochberg correction). All boxplots indicate median (center line), 25th and 75th percentiles (bounds of box), and minimum and maximum (whiskers), with red dotted lines representing the control median. A list of full genotypes for fly crosses used in these experiments is provided in Supplementary File 2.
To validate apoptosis as a candidate mechanism for the cellular defects of flies with knockdown of homologs of 3q29 genes, we crossed recombinant fly lines of Cbp20 and dlg1 with flies overexpressing Diap1 (death-associated inhibitor of apoptosis). Diap1 is an E3 ubiquitin ligase that targets Dronc, the fly homolog of caspase-9, and prevents the subsequent activation of downstream caspases that lead to apoptosis (Steller, 2008) (Figure 5—Figure Supplement 1A). We found that overexpression of Diap1 rescued the adult rough eye phenotypes (Figure 5A-B, Figure 5—Figure Supplement 1B-C) and increased the eye sizes of Cbp20 and dlg1 flies (Figure 5—Figure Supplement 1D). These observations were corroborated by the reversal of cellular changes in the eye, including the rescue of ommatidial structure and cell count deficits observed with knockdown of Cbp20 and dlg1 upon Diap1 overexpression (Figure 5D, Figure 5—Figure Supplement 1E). Furthermore, overexpression of Diap1 led to significant reductions in the number of TUNEL and dcp1-positive cells in the larval eye discs of flies with knockdown of Cbp20 and dlg1, confirming the rescue of apoptosis defects in these flies (Figure 5E-F, Figure 5—Figure Supplement 1F-G). Interestingly, Diap1 overexpression also suppressed the photoreceptor axon targeting defects observed with knockdown of Cbp20 (Figure 5G, Figure 2—Figure Supplement 2), suggesting that the neuronal defects observed in these flies could be attributed to increased apoptosis. We further confirmed these mechanistic findings by observing increased severity in cellular phenotypes upon overexpression of Dronc in Cbp20 and dlg1 knockdown flies. For example, we observed black necrotic patches (Figures 5A and 5C) and exaggerated apoptotic responses (Figure 5E-F, Figure 5—Figure Supplement 1F-G) in Cbp20 knockdown flies with overexpression of Dronc. These results suggest that apoptosis mediates the cellular defects observed in flies with knockdown of Cbp20 and dlg1, emphasizing its role towards pathogenicity of the deletion.

Rescue of cellular phenotypes due to knockdown of fly homologs of 3q29 genes with overexpression of Diap1. (A) Cellular phenotypes of flies with overexpression of Diap1 and Dronc. Representative brightfield adult eye images (scale bar = 100 µm), confocal images of larval eye discs (scale bar = 30 µm) stained with anti-dcp1, and confocal images of pupal eyes (scale bar = 5 µm) stained with anti-DLG are shown for flies with GMR-GAL4 overexpression of Diap1 and Dronc. While the overexpression of Diap1 did not lead to any changes in the pupal or adult eye phenotype, overexpression of Dronc resulted in a large increase in apoptosis and depigmentation in the adult eye. (B) Box plot of Flynotyper distance ommatidial disorderliness (OD) scores for flies with concomitant GMR-GAL4 RNAi knockdown of Cbp20 or dlg1 and overexpression of Diap1 or Dronc (n = 8–9, *p < 0.05, two-tailed Mann–Whitney test with Benjamini-Hochberg correction) is shown. (C) Box plot of Flynotyper angle OD scores for flies with knockdown of Cbp20 or dlg1 and overexpression of Diap1 or Dronc (n = 8–9, *p < 0.05, two-tailed Mann–Whitney test with Benjamini-Hochberg correction) is shown. The distance and angle OD scores, component subscores derived from Flynotyper (Iyer et al., 2016), mirror the trends observed in the overall phenotypic scores (Figure 5B). (D) Box plot of adult eye area in flies with knockdown of Cbp20 or dlg1 and overexpression of Diap1 or Dronc (n = 8–9, *p < 0.05, two-tailed Mann–Whitney test with Benjamini-Hochberg correction). (E) Confocal images of pupal eyes (scale bar = 5 µm) stained with Phalloidin illustrate the rescue of photoreceptor cell organization defects due to knockdown of Cbp20 or dlg1 upon overexpression of Diap1. (F) Larval eye discs (scale bar = 30 µm) stained with TUNEL show rescue of apoptosis phenotypes observed in flies with knockdown of Cbp20 or dlg1 and overexpression of Diap1, as well as enhanced apoptosis with overexpression of Dronc. (G) Box plot of TUNEL-positive cells in the larval eye discs of flies with knockdown of Cbp20 or dlg1 and overexpression of Diap1 or Dronc (n = 7–10, *p < 0.05, two-tailed Mann–Whitney test with Benjamini-Hochberg correction). All boxplots indicate median (center line), 25th and 75th percentiles (bounds of box), and minimum and maximum (whiskers), with red dotted lines representing the control median. A list of full genotypes for fly crosses used in these experiments is provided in Supplementary File 2.

Rescue of cellular phenotypes due to knockdown of fly homologs of 3q29 genes with overexpression of the apoptosis inhibitor Diap1. (A) Representative brightfield adult eye images (scale bar = 100 µm) show rescue of rough eye phenotypes for flies with concomitant GMR-GAL4 RNAi knockdown of Cbp20 or dlg1 and overexpression of Diap1, as well as enhanced (Enh.) phenotypes with overexpression of caspase-9 homolog Dronc. (B) Boxplot of phenotypic scores for flies with knockdown of Cbp20 or dlg1 and overexpression of Diap1 or Dronc (n = 8–9, *p < 0.05, two-tailed Mann–Whitney test with Benjamini-Hochberg correction) is shown. (C) Box plot showing area of necrotic patches in adult fly eyes with knockdown of Cbp20 and overexpression of Dronc (n=9, *p=3.27×10⁻⁵, one-tailed Mann–Whitney test) is shown. (D) Confocal images of pupal eyes (scale bar = 5 µm) stained with anti-DLG illustrate the rescue of ommatidial organization defects due to knockdown of Cbp20 or dlg1 upon overexpression of Diap1. Yellow circles in DLG images indicate cone cell defects, white circles indicate bristle cell defects, yellow arrows indicate rotation defects, and yellow arrowheads indicate secondary cell defects. To account for reduced DLG expression in pupal eyes with knockdown of dlg1, images were taken at a higher intensity than control images (see Methods). (E) Larval eye discs (scale bar = 30 µm) stained with anti-dcp1 show rescue of apoptosis phenotypes observed in flies with Cbp20 and dlg1 knockdown upon Diap1 overexpression as well as enhanced (Enh.) phenotypes upon Dronc overexpression. (F) Boxplot of dcp1-positive cells in the larval eye discs of flies with knockdown of Cbp20 or dlg1 and Diap1 or Dronc overexpression (n = 9–18, *p < 0.05, two-tailed Mann–Whitney test with Benjamini-Hochberg correction). (G) Representative confocal images of larval eye discs stained with anti-chaoptin (scale bar = 30 µm) illustrate the suppression (Supp.) of axonal targeting defects (white arrows) observed in flies due to knockdown of Cbp20 or dlg1 with overexpression of Diap1. Note that n=8-18 larval eye disc preparations were assessed for each interaction cross tested. All boxplots indicate median (center line), 25th and 75th percentiles (bounds of box), and minimum and maximum (whiskers), with red dotted lines representing the control median. A list of full genotypes for fly crosses used in these experiments is provided in Supplementary File 2.
3q29 genes interact with canonical neurodevelopmental genes
We further explored the role of 3q29 genes in neurodevelopmental pathways by screening four fly homologs with strong neurodevelopmental phenotypes (Cbp20, dlg1, CG8888, and Pak) for interactions with homologs of 15 known human neurodevelopmental genes, for a total of 60 pairwise interactions and 153 two-hit crosses (Figure 6A). We selected these neurodevelopmental genes for screening based on their association with developmental disorders in humans (Coe et al., 2012; Iyer et al., 2016), and included eight genes associated with apoptosis or cell cycle functions as well as four genes associated with microcephaly (Nicholas et al., 2009), a key phenotype observed in approximately 50% of 3q29 deletion carriers (Ballif et al., 2008). We found that 34 pairwise interactions, validated with a second line when available, led to significant increases in eye phenotypes compared with individual knockdown of the homologs of 3q29 genes (Figure 6—Figure Supplement 1-2). These interactions included 19 validated interactions of homologs of 3q29 genes with apoptosis or cell cycle genes as well as 10 interactions with microcephaly genes. We found that 13 out of 15 homologs of neurodevelopmental genes, including all four microcephaly genes, enhanced the phenotypes observed with knockdown of Cbp20 alone. Furthermore, knockdown of Cbp20 or dlg1 enhanced the ommatidial necrotic patches observed with knockdown of arm (CTNNB1) (Figure 6B). Interestingly, we also found that knockdown of CG8888 and dlg1 suppressed the rough eye phenotypes observed with knockdown of Prosap (SHANK3), while knockdown of Pak suppressed the phenotypes of both Prosap and Pten (PTEN) knockdown flies (Figure 6B, Figure 6—Figure Supplement 3). Several of these interactions have been previously observed to modulate neuronal function in model systems. For example, SHANK3 interacts with DLG1 through the mediator protein DLGAP1 to influence post-synaptic density in mice (Coba et al., 2018) and binds to proteins in the Rac1 complex, including PAK2, to regulate synaptic structure (Duffney et al., 2015; Park et al., 2003). These results suggest that homologs of 3q29 genes interact with key developmental genes in conserved pathways to modify cellular phenotypes.

Screening for interactions between fly homologs of 3q29 genes and other known neurodevelopmental genes. “All interactions” indicates the number of crosses where at least one second-hit RNAi line showed enhancement of the single-hit phenotype, while “Validated interactions” indicates the number of interactions which have two or more crosses with a second-hit RNAi or mutant line (if available) showing the same result. Results from two distinct fly homologs of CHRNA7 that were crossed with homologs of 3q29 genes, nAChRα6 and nAChRα7, were combined for the final number of interactions. Shaded interactions indicate pairwise crosses where the phenotypes observed with knockdown of the fly homolog for the neurodevelopmental gene by itself were suppressed upon concomitant knockdown of homologs for 3q29 genes. The tested neurodevelopmental genes are annotated for cell cycle/apoptosis function (Gene Ontology terms GO:0007049 and GO:0006915) as well as association with microcephaly disorders (Nicholas et al., 2009). A list of full genotypes for fly crosses used in these experiments is provided in Supplementary File 2.

Pairwise interactions between fly homologs of 3q29 genes and other neurodevelopmental genes. (A) Heatmap showing the average changes in phenotypic scores for the GMR-GAL4 pairwise RNAi knockdown of fly homologs for 3q29 genes and other neurodevelopmental genes (along with their human counterparts) in the adult eye, compared with recombined lines for individual homologs of 3q29 genes. (B) Representative brightfield adult eye images of flies with pairwise knockdown of fly homologs for 3q29 genes and known neurodevelopmental genes (scale bar = 100 µm) show enhancement (Enh.) or suppression (Supp.) of rough eye phenotypes and necrotic patches compared with flies with knockdown of individual homologs of neurodevelopmental genes. A list of full genotypes for fly crosses used in these experiments is provided in Supplementary File 2.
Reduction of 3q29 gene expression causes developmental defects in Xenopus laevis
After identifying a wide range of neurodevelopmental defects due to knockdown of fly homologs of 3q29 genes, we sought to gain further insight into the conserved functions of these genes in vertebrate embryonic brain development using the Xenopus laevis model system. We examined the effect of targeted knockdown of ncbp2, fbxo45, and pak2, as homologs of these genes displayed multiple severe phenotypes with reduced gene expression in flies. Knockdown of X. laevis homologs for each 3q29 gene was accomplished using antisense morpholino oligonucleotides (MOs) targeted to early splice sites of each homolog (Figure 1). X. laevis embryos were injected at either the two- or four-cell stage with various concentrations of MO for each homolog or a standard control, and were validated using RT-PCR (Figure 7—Figure Supplement 1A-B). As reduction of Cbp20, Fsn, and Pak each resulted in neuronal defects in Drosophila, we first examined the effects of knockdown of these homologs on X. laevis brain development at stage 47. To test this, we knocked down each gene in half of the embryo at the two-cell stage, and left the other half uninjected to create a side-by-side comparison of brain morphology (Figure 7A). We performed whole-mount immunostaining with anti-alpha tubulin and found that reduction of ncbp2, fbxo45, and pak2 each resulted in smaller forebrain and midbrain size compared with controls (Figures 7A-C). We also found that simultaneous knockdown of ncbp2 with fbxo45 caused a significant decrease in forebrain size and a trend towards decreased midbrain size compared with ncbp2 knockdown (Figure 7A-C). Knockdown of pak2 with ncbp2 showed a similar trend towards decreased forebrain size. Interestingly, the reduced brain volumes we observed with knockdown of homologs of 3q29 genes in X. laevis recapitulate the reduced brain volume observed in 3q29 deletion mice (Baba et al., 2019; Rutkowski et al., 2019), suggesting multiple genes in the 3q29 region contribute to this deletion phenotype. We further examined the effect of knocking down homologs of 3q29 genes on X. laevis eye development at stage 42, and found that knockdown of these homologs caused irregular shapes and decreased size compared with controls (Figure 7—Figure Supplement 2A-B). The reductions in eye size were rescued to control levels when mRNA was co-injected along with MO for each homolog (Figure 7—Figure Supplement 2C). Together, these data show that individual and pairwise knockdown of homologs of 3q29 genes in X. laevis leads to abnormal brain and eye morphology, confirming the conserved role of these genes during vertebrate development.

Phenotypic scores for interactions between homologs of 3q29 genes and known neurodevelopmental genes in the adult fly eye. (A-D) Box plots of phenotypic scores for concomitant GMR-GAL4 RNAi knockdown of fly homologs of 3q29 genes and neurodevelopmental genes, compared with recombined lines for individual homologs of 3q29 genes (n = 2–10, *p < 0.05, two-tailed Mann–Whitney test with Benjamini-Hochberg correction). All boxplots indicate median (center line), 25th and 75th percentiles (bounds of box), and minimum and maximum (whiskers), with red dotted lines representing the control median. A list of full genotypes for fly crosses used in these experiments is provided in Supplementary File 2.

Quantification of 3q29 morpholino knockdown and apoptosis marker levels in X. laevis models. (A) Electrophoretic gels show decreased expression of homologs of 3q29 genes due to morpholino (MO) knockdown at various concentrations in X. laevis embryos. Three replicates (uninjected and two MO concentrations) were performed for each morpholino, and band intensities were compared with expression of ODC1 controls taken from the same cDNA samples and run on gels processed in parallel. (B) Quantification of expression for homologs of 3q29 genes at different MO concentrations, as measured by band intensity ratio to ODC1 controls (n=3 replicates, *p<0.05, two-tailed Welch’s T-test with Benjamini-Hochberg correction). (C) Full images of western blots for quantification of cleaved caspase-3 levels in X. laevis embryos with MO knockdown of homologs of 3q29 genes. Two replicate experiments were performed, and the intensity of bands at 19kD and 17kD (green arrows), corresponding with caspase-3, were normalized to those for the β-actin loading controls. Embryos injected with control MO, uninjected embryos, and embroys treated with 30% EtOH as a positive control were included with the embryos injected with 3q29 MOs.

Eye phenotypes observed with knockdown of homologs of 3q29 genes in X. laevis models. (A) Representative eye images of stage 42 X. laevis tadpoles with MO knockdown of homologs of 3q29 genes (scale bar = 500 µm) show defects in eye size and morphology compared with the control (top). These defects were rescued with co-injection and overexpression of mRNA for homologs of 3q29 genes, as well as overexpression of the apoptosis inhibitor xiap for ncbp2 (bottom). (B) Box plot of eye area in X. laevis models with knockdown of homologs of 3q29 genes, normalized to controls (n = 48–71, *p < 0.05, two-tailed Welch’s T-test with Benjamini-Hochberg correction). Models with ncbp2 knockdown and xiap overexpression showed an increased eye size compared with ncbp2 knockdown. (C) Box plot of eye area in X. laevis models with knockdown of homologs of 3q29 genes and overexpression of mRNA for homologs of 3q29 genes, normalized to controls (n = 56–63, *p < 0.05, two-tailed Welch’s T-test with Benjamini-Hochberg correction). All boxplots indicate median (center line), 25th and 75th percentiles (bounds of box), and minimum and maximum (whiskers), with red dotted lines representing the control median. The data shown for the eye area experiments represent pooled results of three experimental batches, and were normalized to the respective controls from each batch.

Developmental phenotypes observed with knockdown of homologs of 3q29 genes in X. laevis models. (A) To study brain morphology upon knockdown of X. laevis homologs of genes in the 3q29 region, one cell in a two-cell embryo was injected with single or multiple MOs for homologs of 3q29 genes while the other cell remained uninjected. Representative images of stage 47 X. laevis tadpoles (scale bar = 500 µm) with MO knockdown of ncbp2, fxbo45 and pak2 show morphological defects and decreased size, including decreased forebrain (highlighted in red on the control image) and midbrain (highlighted in yellow) area, compared with control tadpoles. Pairwise knockdown of fbxo45 and ncbp2 enhanced these phenotypes, which were also rescued with overexpression of xiap. (B) Box plot of forebrain area in X. laevis models with knockdown of homologs of 3q29 genes, normalized to controls (n = 30–63, *p < 0.05, two-tailed Welch’s T-test with Benjamini-Hochberg correction). Red box indicates rescue of decreased ncbp2 forebrain area with overexpression of the apoptosis inhibitor xiap. (C) Box plot of midbrain area in X. laevis models with knockdown of homologs of 3q29 genes, normalized to controls (n = 30–63, *p < 0.05, two-tailed Welch’s T-test with Benjamini-Hochberg correction). Red box indicates rescue of decreased ncbp2 midbrain area with overexpression of the apoptosis inhibitor xiap. (D) Western blot analysis of X. laevis whole embryos show increased levels of cleaved caspase-3 with knockdown of homologs of 3q29 genes, including enhanced caspase-3 levels with knockdown of multiple homologs of 3q29 genes and rescued levels with xiap overexpression (red box). β-actin was used as a loading control on the same blot. Representative western blot images shown are cropped; the full blots for both replicates are provided in Figure 7—Figure Supplement 1C. (E) Quantification of western blot band intensity for caspase-3 levels, normalized to the loading control. All boxplots indicate median (center line), 25th and 75th percentiles (bounds of box), and minimum and maximum (whiskers), with red dotted lines representing the control median. The data shown for the brain area experiments represent pooled results of three experimental batches, and were normalized to the respective controls from each batch. X. laevis embryo diagrams were produced by Nieuwkoop and Farber (Nieuwkoop and Faber, 1994) and provided by Xenbase (Karimi et al., 2018).
To determine if the knockdown of homologs of 3q29 genes also disrupted apoptotic processes in X. laevis, we tested whether overexpression of the X-linked inhibitor of apoptosis gene (xiap) could rescue the observed developmental defects. We found that overexpression of xiap rescued the midbrain and forebrain size deficits observed with ncbp2 knockdown to control levels (Figure 7A-C). Similarly, we found that the decreased eye sizes and morphological defects observed with knockdown of ncbp2 were rescued with xiap overexpression (Figure 7—Figure Supplement 2A-B). To further validate these findings, we performed a western blot following knockdown of fbxo45 and ncbp2 using anti-cleaved caspase-3 (Asp175) as a marker for apoptosis (Figure 7D, Figure 7—Figure Supplement 1C). We found that reduction of fbxo45 and ncbp2 expression each led to an increase in cleaved caspase-3 levels compared with controls, which were restored to control levels with concomitant overexpression of xiap (Figure 7E). Caspase-3 levels were also enhanced when fbxo45 and ncbp2 were knocked down together (Figure 7E), suggesting that these two homologs contribute towards developmental phenotypes through increased apoptosis. Overall, these results suggest involvement of apoptotic processes towards the developmental phenotypes observed with knockdown of homologs of 3q29 genes in a vertebrate model (Table 1).
DISCUSSION
Using complementary Drosophila and X. laevis models, we interrogated individual genes, genetic interactions, and cellular mechanisms potentially responsible for the neurodevelopmental phenotypes associated with the 3q29 deletion. Our major findings were recapitulated across both model systems (Table 1) and could also potentially account for the developmental phenotypes reported in mouse models of the entire deletion. Several themes emerge from our study that exemplify the genetic and mechanistic complexity of the 3q29 deletion.
First, our analysis of developmental phenotypes upon knockdown of homologs for individual 3q29 genes showed that a single gene within the region may not be solely responsible for the effects of the deletion. In fact, we found that knockdown of 12 out of 14 fly homologs showed developmental defects in Drosophila, while every fly homolog showed an enhanced rough eye phenotype when knocked down along with at least one other homolog (Figure 2). Although our study is limited to examining conserved cellular phenotypes of homologs of 3q29 genes in Drosophila and X. laevis, evidence from other model organisms also supports an oligogenic model for the deletion. In fact, knockout mouse models for several 3q29 genes have been reported to exhibit severe developmental phenotypes, including axonal and synaptic defects in Fbxo45-/- and embryonic lethality in Pak2-/- and Pcyt1a-/- knockout mice (Marlin et al., 2011; Saiga et al., 2009; Wang et al., 2005) (Figure 1—Figure Supplement 3). Notably, Dlg1+/- or Pak2+/- mice did not recapitulate major developmental and behavioral features observed in mouse models of the entire deletion (Baba et al., 2019; Rutkowski et al., 2019; Wang et al., 2018), suggesting that these phenotypes are contingent upon haploinsufficiency of multiple genes in the region (Figure 8—Figure Supplement 1). Furthermore, several 3q29 genes including PAK2, DLG1, PCYT1A, and UBXN7 are under evolutionary constraint in humans based on gene pathogenicity metrics (Supplementary File 1). Two genes in the 3q29 region without fly homologs, CEP19 and TFRC, are also under evolutionary constraint in humans, with TFRC having been implicated in neural tube defects and embryonic lethality in mouse models (Levy et al., 1999). While no common variants associated with neurodevelopmental traits have been observed in the 3q29 region (Eicher et al., 2015), rare variants of varying effects in 9 out of the 21 genes have been identified among patients with different developmental disorders (Abrahams et al., 2013; Purcell et al., 2014; Turner et al., 2017) (Supplementary File 1). These data, combined with our findings in Drosophila and X. laevis, implicate multiple genes in the 3q29 region towards the pathogenicity of the entire deletion.
Second, our screening of 161 crosses between pairs of fly homologs of 3q29 genes identified 44 interactions that showed enhanced rough eye phenotypes, suggesting that complex interactions among 3q29 genes could be responsible for the developmental defects observed in carriers of the deletion (Figure 8A). While we only tested a subset of all possible interactions among the non-syntenic homologs of 3q29 genes in Drosophila, our results highlight conserved mechanistic relationships between “parts”, or the individual genes, towards understanding the effects of the “whole” deletion. For example, knockdown of Cbp20 enhanced the phenotypes of 11 out of 12 other fly homologs, suggesting that NCBP2 could be a key modulator of the deletion phenotype. NCBP2 encodes a subunit of the nuclear cap-binding complex (CBC), which binds to the 5’ end of mRNA and microRNA in the nucleus (Pabis et al., 2010). Given the role of the CBC in post-transcriptional regulatory mechanisms such as nonsense-mediated decay, alternative splicing and mRNA transport (Gonatopoulos-Pournatzis and Cowling, 2014; Maquat, 2004), it is possible that disruption of this complex could result in changes to a broad set of genes and biological processes. In fact, our analysis of differentially-expressed genes in Cbp20 knockdown flies showed disruption of synaptic transmission, cellular respiration, and several metabolic pathways. In contrast to other proposed candidate genes in the 3q29 region, NBCP2 was not predicted to be pathogenic on its own in humans (Supplementary File 1) and does not have identified deleterious mutations in sequencing studies of neurodevelopmental disease cohorts so far, indicating its potential role as a modifier of the other candidate genes in the region (Figure 8B). Our results also complement previous reports of synergistic interactions among fly homologs of 3q29 genes in the nervous system (Grice et al., 2015), representing another hallmark of an oligogenic model for the deletion. As these genetic interactions may vary across different species, developmental timepoints, and tissues, the role of these interactions should be more deeply explored using mouse and human cell culture models.

Interactions between NCBP2 and other homologs of 3q29 genes contribute to the neurodevelopmental phenotypes of the deletion. (A) We identified 44 interactions between pairs of Drosophila homologs of 3q29 genes. With the exception of Ulp1 (SENP5), the cellular phenotypes of each homolog were significantly enhanced with simultaneous knockdown of Cbp20. While other homologs of 3q29 genes also interact with each other, our data suggest that Cbp20 is a key modulator of cellular phenotypes within the deletion region. (B) Schematic representing the network context of NCBP2 and other genes in the 3q29 region towards the observed deletion phenotypes. We propose that the effect of disruption of NCBP2 propagates through a network of functionally-related genes, including other 3q29 genes (highlighted in blue), leading to a cascade of disruptions in key biological pathways, including apoptosis. These pathways jointly contribute towards the observed neurodevelopmental phenotypes in individuals carrying the entire deletion.
Third, we identified disruptions to several cellular processes due to both single and pairwise knockdown of homologs in Drosophila and X. laevis models (Table 1). For example, simultaneous knockdown of homologs of NCBP2 and FBXO45 in Drosophila led to enhanced cellular disorganization (Figure 4) and altered expression of cell cycle and apoptosis genes (Figure 3—Figure Supplement 5), as well as enhanced morphological defects and increased caspase-3 levels in X. laevis (Figure 7). We further found that overexpression of the apoptosis inhibitors Diap1 and xiap rescued the cellular and neuronal phenotypes observed with knockdown of homologs of 3q29 genes (Figure 5), providing important validations for the potential involvement of apoptosis towards the deletion phenotypes (Table 1). We propose that NCBP2 could modify several cellular and molecular processes that may not be directly related to apoptosis, but could instead lead to a cascade of biological events that ultimately result in apoptosis (Figure 8B). Apoptosis mechanisms are well-conserved between Drosophila, X. laevis, and humans, with key genes such as XIAP (Diap1), CASP2 (Dronc), CASP3 (DrICE), and CASP7 (Dcp-1) sharing the same roles in programmed cell death across the three organisms (Kornbluth and White, 2005; Tittel and Steller, 2000; Xu et al., 2009). In fact, fly homologs of human genes annotated for apoptosis function in the Gene Ontology database are also enriched for apoptosis function (n=1,063 fly homologs from 1,789 human apoptosis genes; p=5.30×10⁻¹³, Fisher’s Exact test with Benjamini-Hochberg correction). Although we focused on testing apoptosis phenotypes upon knockdown of homologs of 3q29 genes, we note that apoptosis is potentially one of the many cellular pathways disrupted by the 3q29 deletion (Figure 8B). In fact, our data implicated knockdown of several homologs of 3q29 genes, including dlg1 and CG8888 (BDH1), towards abnormal cell proliferation during development. Furthermore, several 3q29 genes have been previously associated with apoptosis or cell cycle regulation functions (Supplementary File 1). For example, DLG1 is a tumor suppressor gene whose knockdown in Drosophila leads to neoplasms in the developing brain and eye disc (Bilder et al., 2000; Humbert et al., 2003), while PAK2 is a key downstream mediator of the ERK signaling pathway for neuronal extension and is activated by caspases during apoptosis (Luo and Rubinsztein, 2009; Marlin et al., 2011; Shin et al., 2002). Our results recapitulate the role of DLG1 towards cell cycle regulation, and also implicate NCBP2 and its interactions towards multiple cellular and developmental phenotypes.
More broadly, genes involved with apoptosis and cell proliferation have been implicated in several neurodevelopmental disorders. For example, we previously observed disrupted cell proliferation upon knockdown of Drosophila homologs of genes in the 16p11.2 deletion region, as well as an enrichment of cell cycle genes as connector genes in a human brain-specific network of interactions between 16p11.2 genes (Iyer et al., 2018). Furthermore, abnormal apoptosis in the early developing brain has been suggested as a possible mechanism for the decreased number of neurons observed in individuals with autism and schizophrenia (Courchesne et al., 2011; Glantz et al., 2006; Kreczmanski et al., 2007). For example, increased apoptosis was observed in both postmortem brain tissue from autism patients (Dong et al., 2018) and primary fibroblasts from schizophrenia patients (Batalla et al., 2015; Gassó et al., 2014). We found further support for the role of apoptosis in these disorders by identifying significant enrichments for genes associated with apoptotic processes among candidate genes for autism (empirical p<1.00×10⁻⁵) (Abrahams et al., 2013), intellectual disability (p<1.00×10⁻⁵) (Thormann et al., 2019), and schizophrenia (p=0.014) (Purcell et al., 2014) (Figure 8—Figure Supplement 2). In fact, out of the 525 neurodevelopmental genes involved in apoptosis, 20 genes were present within pathogenic CNV regions (Girirajan et al., 2012), including CORO1A, MAPK3 and TAOK2 in the 16p11.2 region and TBX1, the causative gene for heart defects in DiGeorge/velocardiofacial syndrome (Lindsay et al., 2001) (Supplementary File 4). In addition to neuropsychiatric disorders, apoptosis has also been implicated in syndromic forms of microcephaly in humans (Poulton et al., 2011) as well as decreased brain size in animal models of microcephaly genes (Faheem et al., 2015; Silver et al., 2010). For example, a mouse model of the Nijmegen breakage syndrome gene NBN exhibited increased neuronal apoptosis leading to microcephaly and decreased body mass (Frappart et al., 2005). Overall, these findings highlight the importance of cell cycle-related processes, particularly apoptosis and proliferation, towards modulating neuronal phenotypes that could be responsible for developmental disorders.
In this study, the use of Drosophila and X. laevis models, both of which are amenable to high-throughput screening of developmental phenotypes, allowed us to systematically examine the conserved cellular and mechanistic roles of homologs of 3q29 genes and their interactions. Follow-up studies in more evolutionarily advanced systems, such as mouse or human cell lines, will be useful to overcome limitations of the Drosophila and X. laevis models, including testing the neurodevelopmental phenotypes and interactions of 3q29 genes without fly homologs. Collectively, these results emphasize the utility of quantitative functional assays for identifying conserved pathways associated with neurodevelopmental disorders, which will hopefully allow for future discoveries of treatments for these disorders.
MATERIALS AND METHODS
Fly stocks and genetics
Using reciprocal BLAST searches and ortholog predictions from the DIOPT v.7.1 database (Hu et al., 2011), we identified 15 fly homologs for the 21 human genes within the chromosome 3q29 region (Figure 1—Figure Supplement 1). No fly homologs were present for six genes, including LRRC33, CEP19, RNF168, SMCO1, TFRC, and TM4SF19. We used a similar strategy to identify homologs for other neurodevelopmental genes tested for interactions in this study. Gene Ontology-Slim (GO-Slim) terms for each human gene and fly homolog were obtained from PantherDB (Mi et al., 2017) and are provided in Supplementary File 1. RNAi lines for fly homologs were obtained from the Vienna Drosophila Resource Centre (Dietzl et al., 2007) (VDRC), including both KK and GD lines, and the Bloomington Drosophila Stock Centre (BDSC) (NIH P40OD018537). A list of fly RNAi lines used in this study is provided in Supplementary File 2. Fly RNAi lines for homologs of 3q29 genes were tested for gene knockdown using quantitative real-time PCR (Figure 1—Figure Supplement 1). As the available KK line for CG5359 (TCTEX1D2) showed a wing phenotype consistent with tiptop overexpression due to RNAi insertion at the 5’UTR of the gene (Green et al., 2014), which we confirmed using qPCR analysis (Supplementary File 5), we excluded the gene from our experiments. Microarray data and modENCODE Anatomy RNA-Seq from FlyBase (Chintapalli et al., 2007; Graveley et al., 2011) showed that all of the 14 tested homologs were expressed in the fly central nervous system and eye tissues (Figure 1—Figure Supplement 1).
All fly stocks and crosses were cultured on conventional cornmeal-sucrose-dextrose-yeast medium at 25°C, unless otherwise indicated. RNAi lines were crossed with a series of GAL4 driver lines to achieve tissue-specific knockdown of genes, including w1118;da-GAL4 (Scott Selleck, Penn State) for ubiquitous, w1118;dCad-GFP,GMR-GAL4/CyO (Zhi-Chun Lai, Penn State) and w1118;GMR-GAL4;UAS-Dicer2 (Claire Thomas, Penn State) for eye-specific, w1118,beadexMS1096-GAL4;;UAS-Dicer2 (Zhi-Chun Lai, Penn State) for wing-specific, and w1118,Elav-GAL4 (Mike Groteweil, VCU) and w1118,Elav-GAL4;;UAS-Dicer2 (Scott Selleck, Penn State) for pan-neuronal knockdown of gene expression. A list of full genotypes for all crosses tested in this study is provided in Supplementary File 2. To perform interaction studies, we generated recombinant stock lines of GMR-GAL4 with reduced expression of nine select homologs of 3q29 genes (Figure 3—Figure Supplement 1). Females from these stocks with constitutively reduced gene expression for each of these genes were crossed with RNAi lines of other homologs to achieve simultaneous knockdown of two genes (Figure 1). We previously demonstrated that these two-hit crosses had adequate GAL4 to bind to two independent UAS-RNAi constructs (Iyer et al., 2018).
Quantitative real-time polymerase chain reaction for Drosophila RNAi knockdowns
Levels of gene expression knockdown were confirmed using quantitative real-time PCR (RT-PCR) on RNA isolated from pooled groups of 35 fly heads per line tested (Figure 1—Figure Supplement 2). Briefly, RNAi lines were crossed with Elav-GAL4 (to test RNAi line efficacy) or Elav-GAL4;;UAS-Dicer2 (to test for tiptop overexpression) at 25°C to achieve pan-neuronal knockdown of the fly homolog. Adult fly heads at day 3 were separated by vortexing, and total RNA was isolated using TRIzol (Invitrogen, Carlsbad, CA, USA). cDNA was prepared using the qScript cDNA synthesis kit (Quantabio, Beverly, MA, USA). Quantitative real-time PCR (qPCR) was performed using an Applied Biosystems Fast 7500 system with SYBR Green PCR master mix (Quantabio) to estimate the level of gene expression. Primers were designed using NCBI Primer-BLAST (Ye et al., 2012), with primer pairs separated by an intron in the corresponding genomic DNA. All experiments were performed using three biological replicates. A list of primers used in the experiments is provided in Figure 1—Figure Supplement 2. The delta-delta Ct value method was used to obtain the relative expression of fly homologs in the RNAi lines compared with Elav-GAL4 controls (Livak and Schmittgen, 2001).
Climbing assay
We set up fly crosses at 25°C with Elav-GAL4 to obtain pan-neuronal knockdown for select homologs of 3q29 genes. For each RNAi line tested, groups of ten female flies were first allowed to adjust at room temperature for 30 minutes and then transferred to a climbing apparatus, made by joining two vials, and allowed to adjust for 5 minutes. The flies were tapped down to the bottom, and the number of flies climbing past the 8 cm mark measured from the bottom of the apparatus in 10 seconds was then counted (Videos 1-2). This assay was repeated nine additional times for each group, with a one-minute rest between trials. The sets of 10 trials for each group were repeated daily for ten days, capturing data from 100 replicates from day 1 until day 10, starting the experiments with 1-2-day old flies. All experiments were performed during the same time of the day for consistency of results.
Imaging of adult fly eyes and wings
We crossed RNAi lines with GMR-GAL4 and reared at 29°C for eye-specific knockdown and beadexMS1096-GAL4 at 25°C for wing-specific knockdown. For eye imaging, adult 2-3-day old female progenies from the crosses were collected, immobilized by freezing at −80°C, mounted on Blu-tac (Bostik Inc, Wauwatosa, WI, USA), and imaged using an Olympus BX53 compound microscope with LMPLan N 20X air objective using a DP73 c-mount camera at 0.5X magnification and a z-step size of 12.1μm. (Olympus Corporation, Tokyo, Japan). We used CellSens Dimension software (Olympus Corporation, Tokyo, Japan) to capture the images, and stacked the image slices using Zerene Stacker (Zerene Systems LLC, Richland, WA, USA). All eye images presented in this study are maximum projections of 20 consecutive optical z-sections. Adult wings were plucked from 2-5 day old female flies, mounted on a glass slide, covered with a coverslip and sealed with clear nail polish. The wings were imaged using a Zeiss Discovery V20 stereoscope (Zeiss, Thornwood, NY, USA) with ProgRes Speed XT Core 3 camera (Jenoptik AG, Jena, Germany) using a 40X objective, and images were captured with ProgRes CapturePro v.2.8.8.
Quantitative phenotyping of fly eyes using Flynotyper
We used a computational method called Flynotyper (https://flynotyper.sourceforge.net) to measure the degree of roughness of the adult eyes (Iyer et al., 2016). The software uses an algorithm to detect the center of each ommatidium, and calculates a phenotypic score based on the number of ommatidia detected, the lengths of six local vectors with direction pointing from each ommatidium to the neighboring ommatidia, and the angle between these six local vectors (Figure 2—Figure Supplement 3A). Using Flynotyper, we obtained quantitative measures for roughness of the fly eye with single gene or pairwise gene knockdown. Eye areas, ommatidial diameter, and areas of necrotic patches, which may not be reflected in the Flynotyper scores, were measured using ImageJ. Significant pairwise interactions were reported as “validated” when multiple RNAi or mutant lines, if available, showed the same phenotype (Figure 3—Figure Supplement 1, Figure 6—Figure Supplement 1).
Immunohistochemistry of eye and wing discs
Third instar larval and 44-hour-old pupal eye discs, reared at 29°C, and third instar larval wing discs, reared at 25°C, were dissected in 1X phosphate-buffered saline (PBS) and fixed in 4% paraformaldehyde for 20 minutes. The eye and wing discs were then washed thrice in PBT (PBS with 0.1% Triton-X) for 10 minutes each, treated with blocking solution (PBS with 1% normal goat serum (NGS) for eye discs, or 1% bovine serum albumin (BSA) for wing discs) for 30 minutes, and then incubated overnight with primary antibodies at 4°C. Rabbit anti-cleaved Drosophila dcp1 (Asp216) (1:100; 9578S, Cell Signaling Technology, Danvers, MA, USA), a marker for cells undergoing apoptosis, and Mouse anti-phospho-Histone H3 (S10) antibody (1:100; 9706L, Cell Signaling Technology), a mitotic marker for measuring proliferating cells, were used to assay cell proliferation and apoptosis defects in larval eye and wing discs. Mouse anti-DLG (1:200; 4F3, DSHB, Iowa City, Iowa, USA), a septate junction marker, and Rhodamine Phalloidin (1:200; R415, Invitrogen Molecular Probes, Carlsbad, CA, USA), an F-actin marker, were used to visualize and count ommatidial cells and photoreceptor cells in pupal eyes. Mouse anti-chaoptin (1:200; 24B10, DSHB) was used to visualize retinal axon projections. Preparations were then washed for 10 minutes thrice with PBT, and incubated for two hours with fluorophore-conjugated secondary antibodies (Alexa fluor 568 goat anti-mouse (1:200) (A11031), Alexa fluor 488 goat anti-mouse (1:200) (A11029), Alexa fluor 647 goat anti-rabbit (1:200) (A21245), and Alexa fluor 647 goat anti-mouse (1:200) (A21236), Invitrogen Molecular Probes, Carlsbad, CA, USA)) with gentle shaking. Preparations were washed thrice in PBT for 10 minutes, and the tissues were then mounted in Prolong Gold antifade mounting media with DAPI (P36930, Thermo Fisher Scientific, Waltham, MA, USA) or Vectashield hard set mounting media with DAPI (H-1500, Vector Laboratories, Burlingame, CA, USA) for imaging.
Bromouridine staining
Third instar larval eye discs were dissected in 1X PBS and immediately transferred to Schneider’s Insect Media (Sigma-Aldrich, St. Louis, MO). The tissues were then incubated in 10 µM BrdU (Sigma-Aldrich) at 25°C for one hour with constant agitation to allow for incorporation of BrdU into DNA of replicating cells during the S-phase of cell cycle. The samples were washed thrice with PBS for five minutes each and fixed in 4% paraformaldehyde for 20 minutes. To denature DNA, the tissues were acid-treated in 2N HCl for 20 minutes, neutralized in 100 mM Borax solution for 2 minutes, washed thrice in 10X PBT (PBS with 0.1% Tween-20) for 10 minutes, and treated with blocking solution (PBS, 0.2% Triton X-100, 5% NGS) for one hour. The tissues were then incubated in mouse anti-BrdU (1:200; G3G4, DSHB, Iowa City, Iowa, USA) and diluted in blocking solution overnight at 4°C. The next day, the tissues were washed thrice in PBT for 20 minutes each and incubated in Alexa fluor 568 goat anti-mouse (1:200, Invitrogen Molecular Probes, Carlsbad, CA, USA) for two hours with constant agitation. Finally, the samples were mounted in Prolong Gold antifade reagent with DAPI (Thermo Fisher Scientific, Waltham, MA, USA) for imaging.
Terminal deoxynucleotidyl transferase (TUNEL) Assay
The levels of cell death in the developing eye were evaluated by staining using the In Situ Cell Death Detection Kit, TMR Red (Roche, Basel, Switzerland). The third instar larval eye discs were dissected in 1X PBS and fixed in 4% paraformaldehyde for 20 minutes at room temperature, followed by three 10-minute washes with PBS. The dissected tissues were permeabilized by treating with 20 µg/ml proteinase K (Sigma-Aldrich, St. Louis, MO, USA) for two minutes, washed thrice in PBT (PBS with 0.1% Triton-X) for 5 minutes each, fixed in 4% paraformaldehyde for 15 minutes, and washed thrice again in PBT for 10 minutes each. The tissues were then incubated overnight with TUNEL (terminal deoxynucleotidyl transferase dUTP nick end labeling) reaction mixture at 4°C per the manufacturer’s instructions, and washed five times in PBT for 15 minutes each. Finally, tissues were mounted in Prolong-gold antifade containing DAPI (Thermo Fisher Scientific, Waltham, MA, USA) for imaging.
Confocal imaging and analysis
Confocal images of larval and pupal eye discs were captured using an Olympus Fluoview FV1000 laser scanning confocal microscope (Olympus America, Lake Success, NY). Maximum projections of all optical sections were generated for display. To account for decreased expression of DLG in flies with knockdown of dlg1, the laser intensity used to image DLG staining in pupal eyes of these flies was increased to 530-570V, compared with 400-490V in control flies. Acquisition and processing of images was performed with the Fluoview software (Olympus Corporation, Tokyo, Japan), and the z-stacks of images were merged using ImageJ (Schneider et al., 2012). The number of pH3, BrdU, TUNEL, and dcp1-positive cells from larval eye discs were counted using two ImageJ plugins, AnalyzeParticles and Image-based Tool for Counting Nuclei (ITCN). As we found a strong correlation (Pearson correlation, r=0.736, p<2.2×10⁻¹⁶) between the two methods (Figure 2—Figure Supplement 3D), all cell counts displayed for eye data were derived from ITCN analysis. Proliferating cells in larval wing discs stained with pH3 were counted using AnalyzeParticles, and apoptotic cells in wing discs stained with dcp1 were analyzed using manual counting.
Differential expression analysis of transcriptome data
We performed RNA sequencing (RNA-Seq) of samples isolated from three biological replicates of 35 fly heads each for individual (Cbp20, dlg1, Fsn, Pak) and pairwise (Cbp20/dlg1, Cbp20/Fsn) Elav-GAL4 mediated knockdowns of homologs of 3q29 genes. We compared gene expression levels of each cross to VDRC control flies carrying the same genetic background (GD or KK control lines crossed with Elav-GAL4). We prepared cDNA libraries for the three biological replicates per genotype using TruSeq Stranded mRNA LT Sample Prep Kit (Illumina, San Diego, CA), and performed single-end sequencing using Illumina HiSeq 2000 at the Penn State Genomics Core Facility to obtain 100 bp reads at an average coverage of 36.0 million aligned reads/sample. We used Trimmomatic v.0.36 (Bolger et al., 2014) for quality control assessment, TopHat2 v.2.1.1 (Kim et al., 2013) to align the raw sequencing data to the reference fly genome and transcriptome (build 6.08), and HTSeq-Count v.0.6.1 (Anders et al., 2015) to calculate raw read counts for each gene. edgeR v.3.20.1 (Robinson et al., 2009) (generalized linear model option) was used to perform differential expression analysis, and genes with log2-fold changes >1 or <-1 and false-discovery rates <0.05 (Benjamini-Hochberg correction) were considered to be differentially expressed (Supplementary File 3). Human homologs of differentially-expressed fly genes (top matches for each fly gene, excluding matches with “low” rank) were identified using DIOPT (Hu et al., 2011). Enrichment analysis of Panther GO-Slim Biological Process terms among the differentially-expressed fly genes and their human homologs was performed using the PantherDB Gene List Analysis tool (Mi et al., 2017). Enrichments for genes preferentially expressed in the developing brain were calculated using the Cell-type Specific Expression Analysis tool (Dougherty et al., 2010) based on expression data from the BrainSpan Atlas (Miller et al., 2014).
X. laevis embryos
Eggs collected from female X. laevis frogs were fertilized in vitro, dejellied, and cultured following standard methods (Lowery et al., 2012; Sive et al., 2010). Embryos were staged according to Nieuwkoop and Faber (Nieuwkoop and Faber, 1994). All X. laevis experiments were approved by the Boston College Institutional Animal Care and Use Committee (Protocol #2016-012) and were performed according to national regulatory standards.
Morpholino and RNA constructs
Morpholinos (MOs) were targeted to early splice sites of X. laevis ncbp2, fbxo45, pak2, or standard control MO, purchased from Gene Tools LLC (Philomath, OR, USA). MO sequences are listed in Figure 7—Figure Supplement 3. For knockdown experiments, all MOs were injected at either the 2-cell or 4-cell stage, with embryos receiving injections two or four times total in 0.1X MMR containing 5% Ficoll. Control and fbxo45 MOs were injected at 10ng/embryo, ncbp2 and control MOs were injected at 20ng/embryo, and pak2 and control MOs were injected at 50ng/embryo. For rescue experiments, the same amounts of MOs used in the KD experiments were injected along with gene-specific mRNA tagged with GFP (800pg/embryo for xiap-GFP; 1000pg/embryo for ncbp2-GFP and fbxo45-GFP, and 300pg/embryo for pak2-GFP) in the same injection solution. Capped mRNAs were transcribed in vitro using SP6 or T7 mMessage mMachine Kit (Thermo Fisher Scientific, Waltham, MA, USA). RNA was purified with LiCl precipitation. X. laevis ncbp2, fbxo45, pak2, and xiap ORFs obtained from the European Xenopus Resource Center (EXRC, Portsmouth, UK) were gateway-cloned into pCSf107mT-GATEWAY-3’GFP destination vectors. Constructs used included NCBP2-GFP, FBXO45-GFP, PAK2-GFP, XIAP-GFP, and GFP in pCS2+. Embryos either at the 2-cell or 4-cell stage received four injections in 0.1X MMR containing 5% Ficoll with the following total mRNA amount per embryo: 300pg of GFP, 800pg of xiap-GFP, 1000pg of ncbp2-GFP, 1000pg of fbxo45-GFP, and 300pg of pak2-GFP.

Morpholinos used for X. laevis experiments.
RT-PCR for X. laevis morpholino knockdown
Morpholino validation and knockdown was assessed using RT-PCR. Total RNA was extracted using TRIzol reagent (Life Technologies, Grand Island, NY, USA), followed by chloroform extraction and ethanol precipitation from 2-day old embryos injected with increasing concentrations of MO targeted to each homolog of the tested 3q29 gene. cDNA synthesis was performed with SuperScript II Reverse Transcriptase (Life Technologies, Grand Island, NY, USA) and random hexamers. PCR primers are listed in Figure 7—Figure Supplement 4. RT-PCR was performed in triplicate (Figure 7—Figure Supplement 1A), with band intensities quantified by densitometry in ImageJ and normalized to the uninjected control mean relative to ODC1, which was used as a housekeeping control.

qPCR primers used for X. laevis experiments.

Comparison of mice with heterozygous deletion of the syntenic 3q29 region (Baba et al., 2019; Rutkowski et al., 2019) with heterozygous knockout mouse models for Dlg1 (Rutkowski et al., 2019) and Pak2 (Wang et al., 2018). Blue shaded boxes indicate phenotypes observed in the knockout models, while gray-shaded boxes indicate a phenotype that was not tested in the knockout model. Neither Dlg1+/- nor Pak2+/- knockout mice recapitulate the body and brain weight, spatial learning and memory, or acoustic startle defects observed in the deletion mouse models.

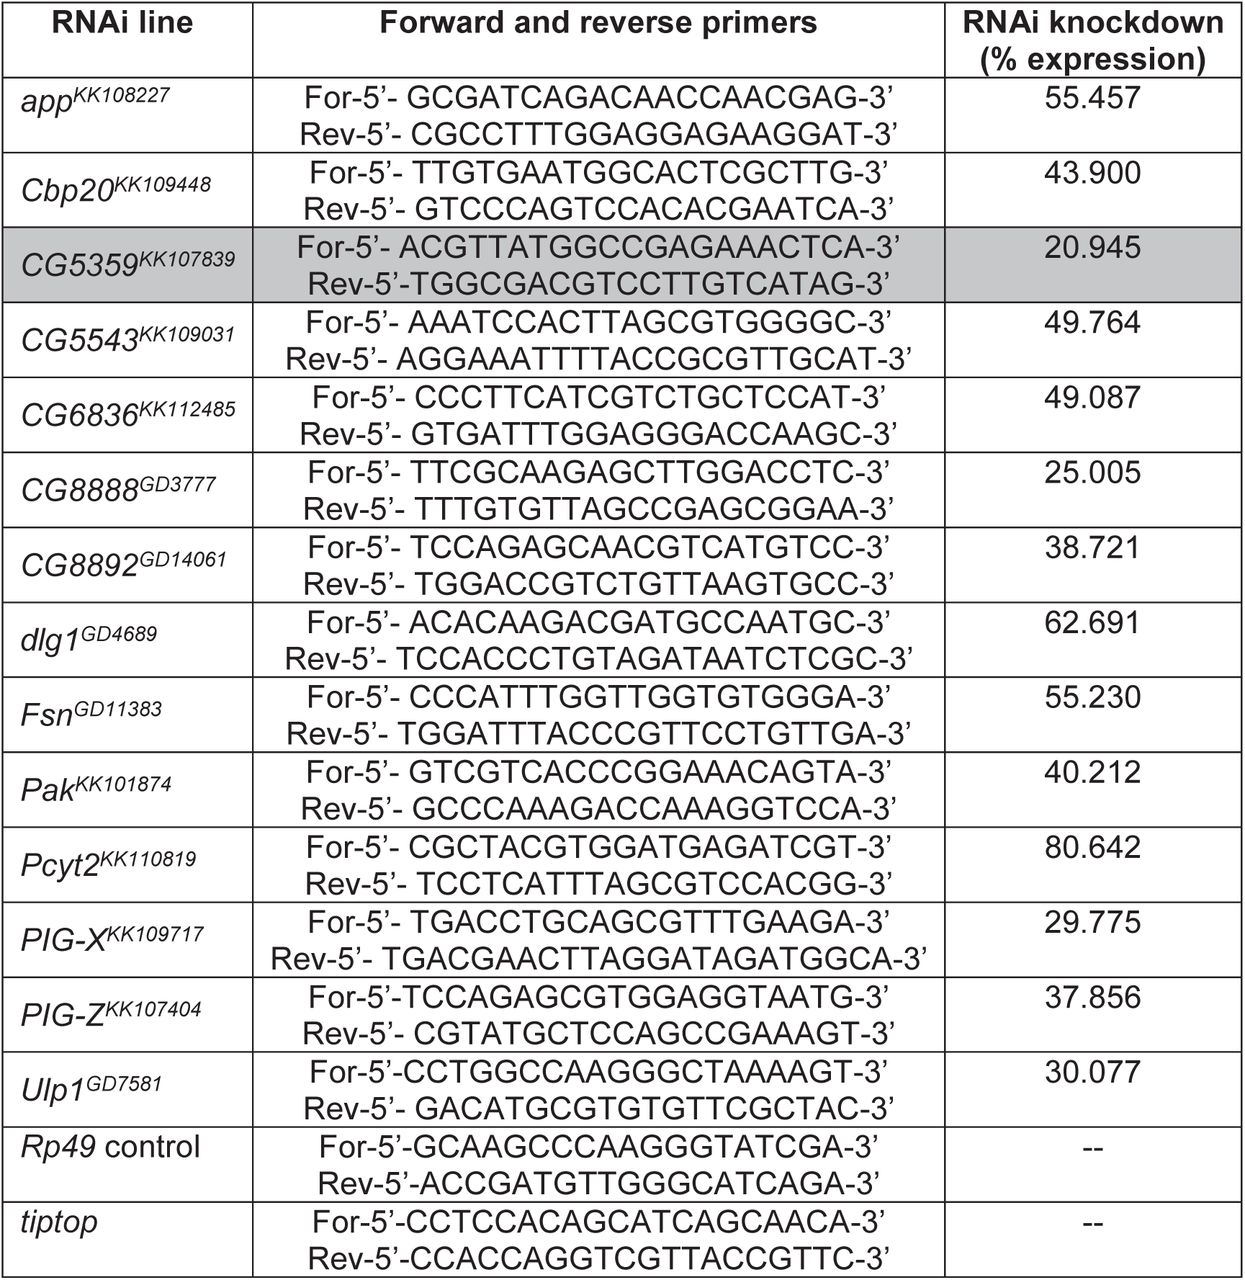
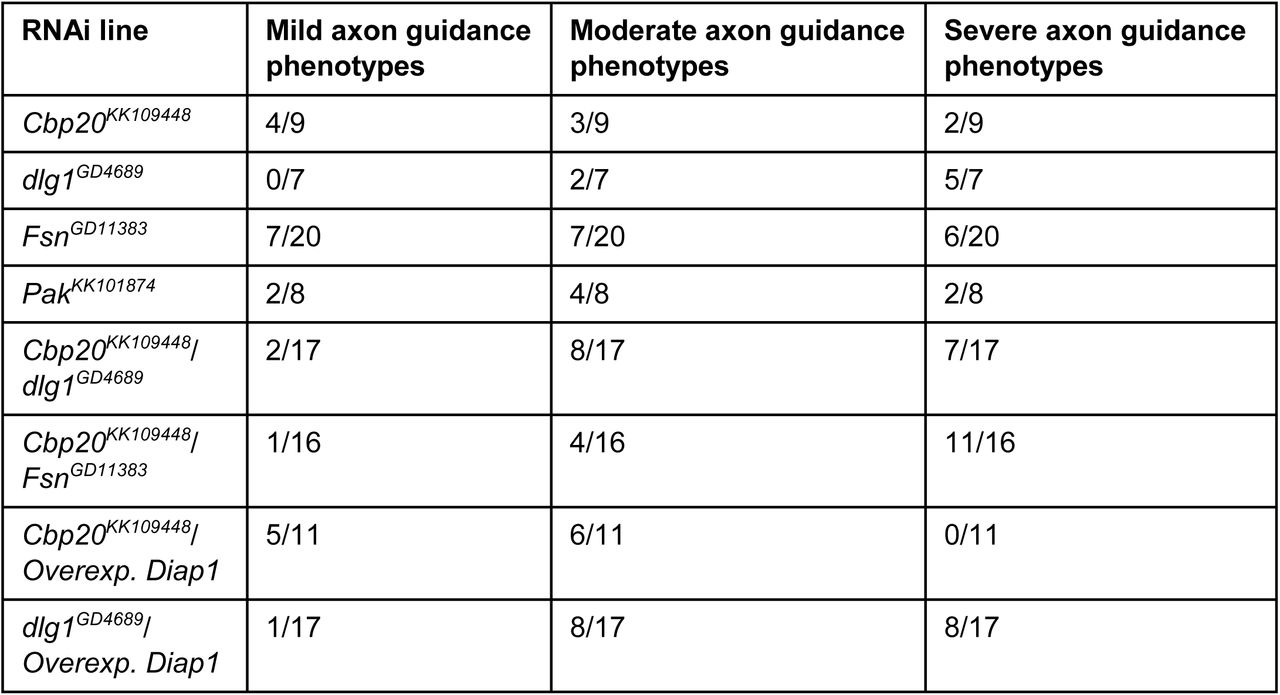
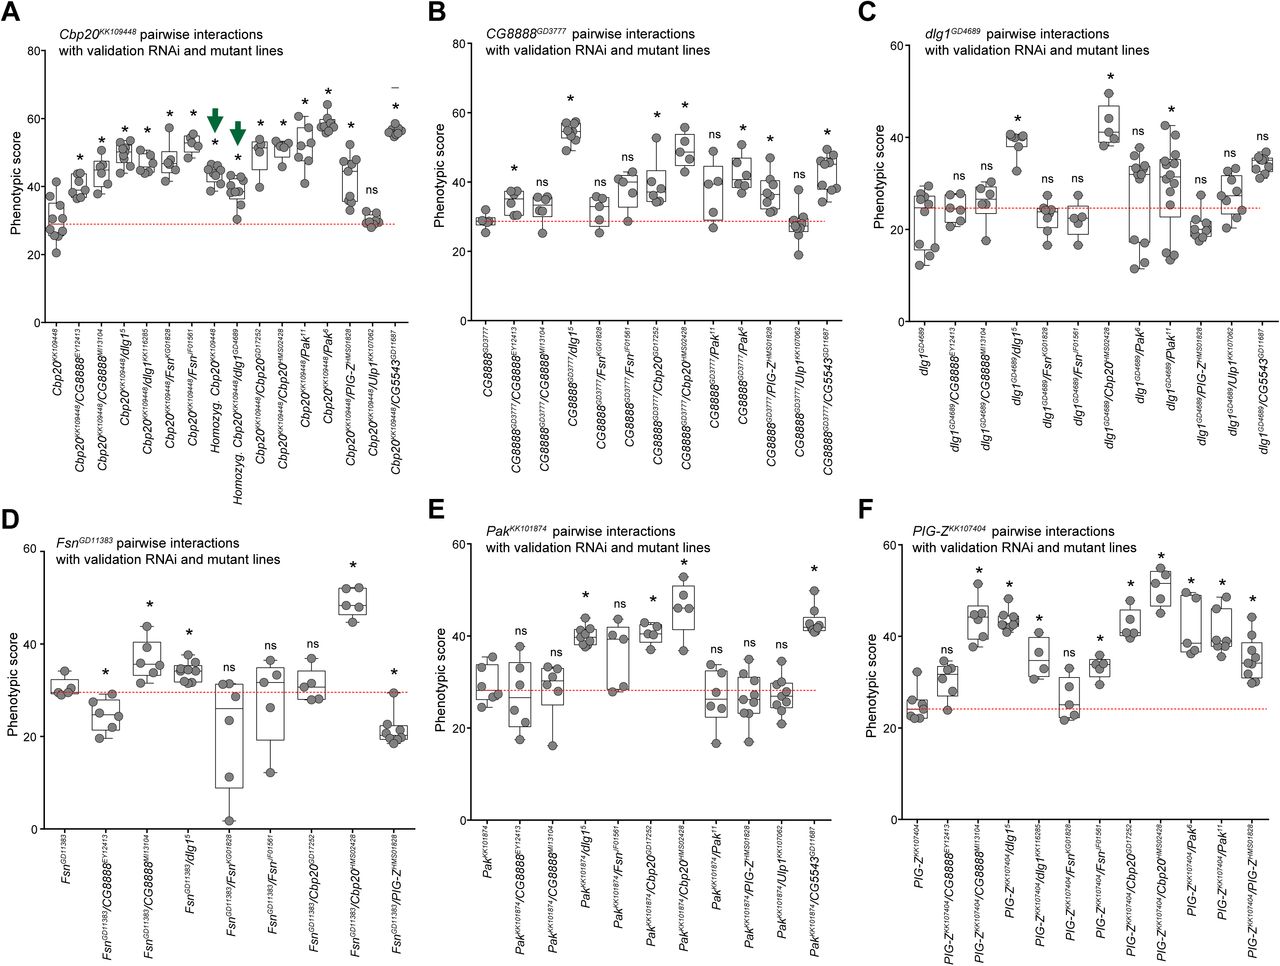
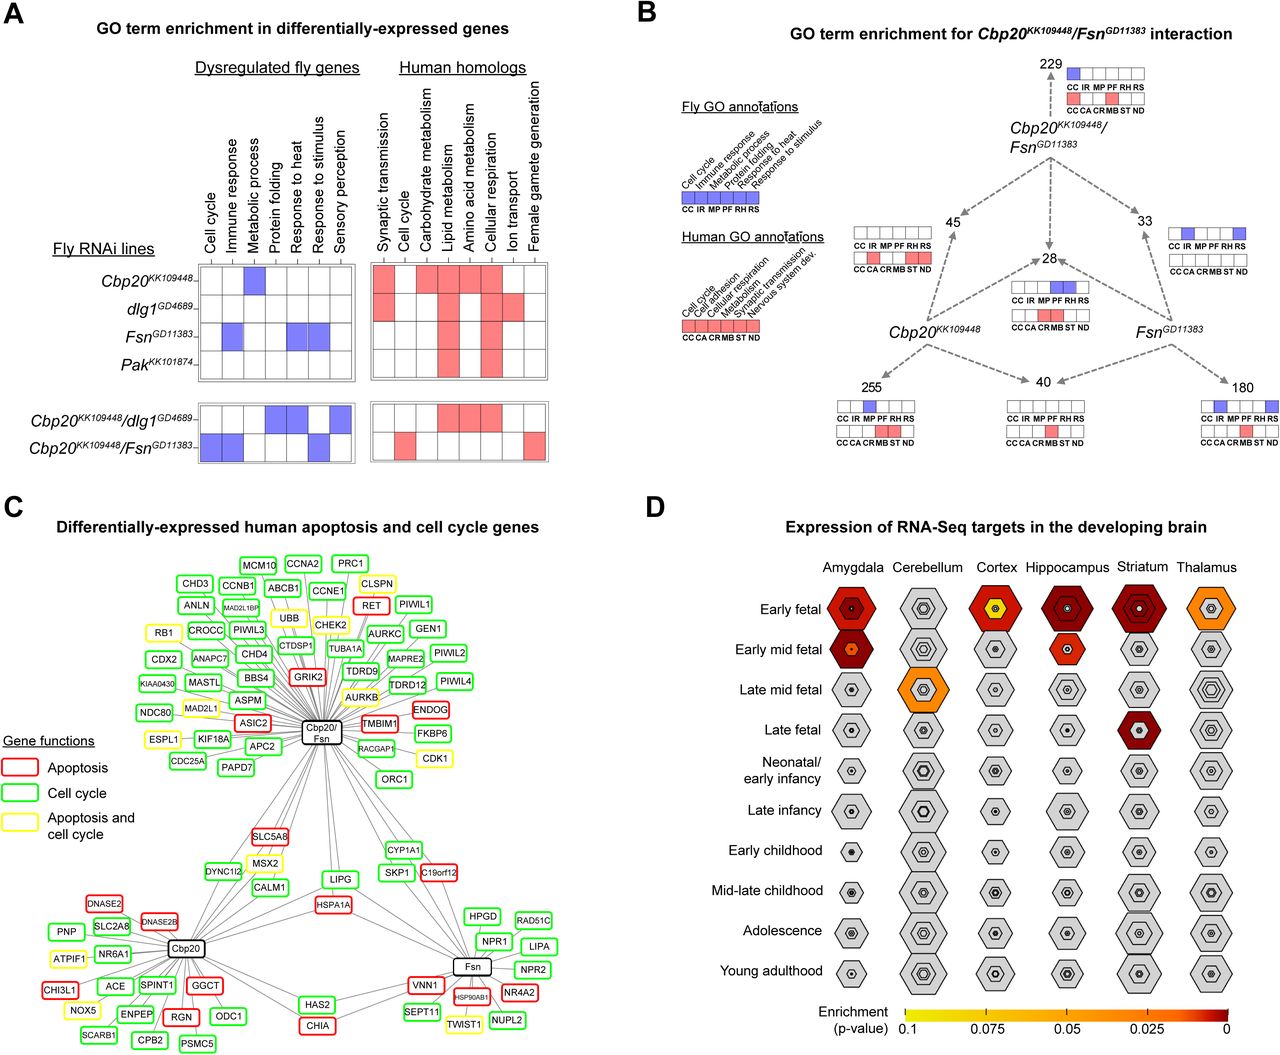
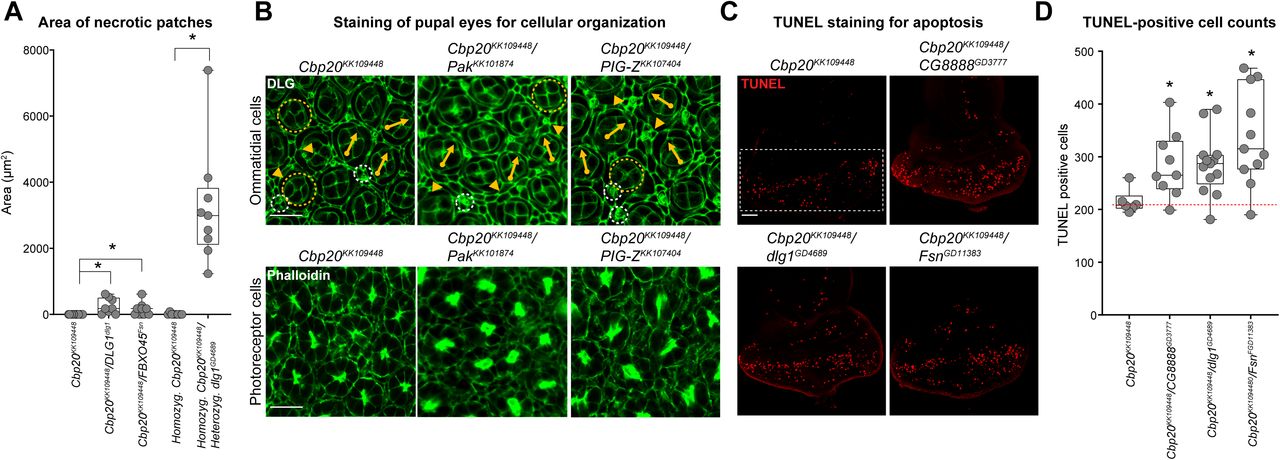
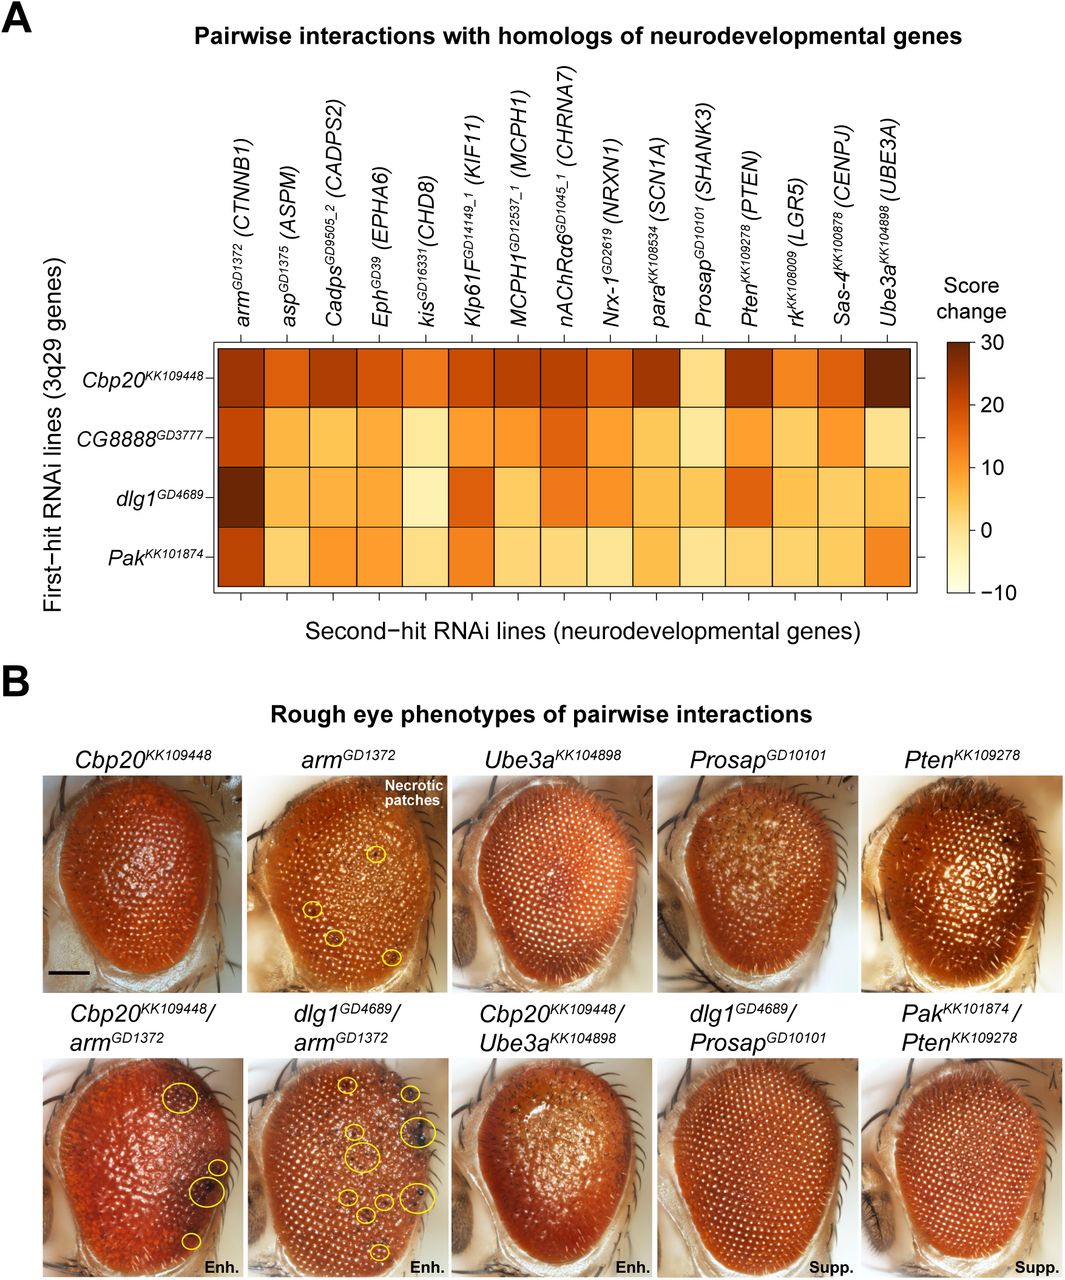
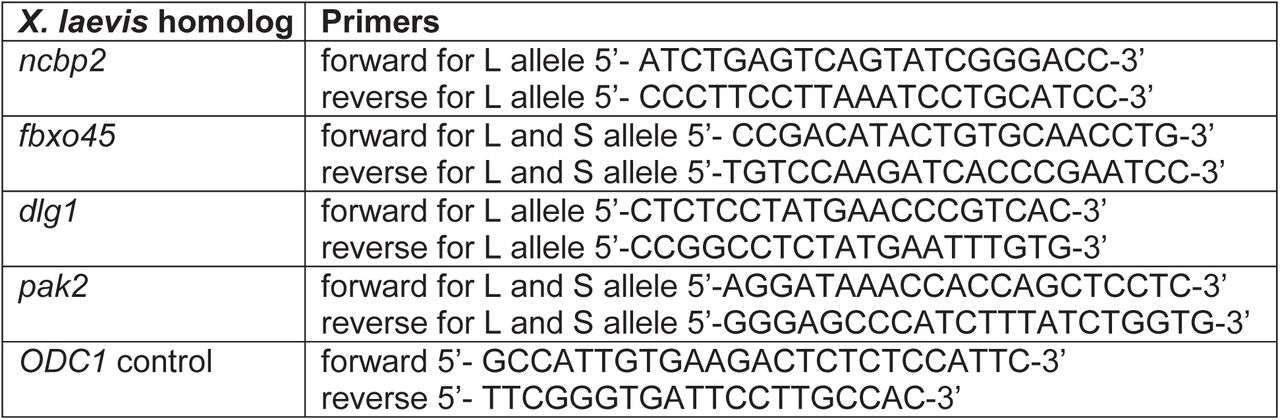
Summary of apoptosis function enrichment among candidate neurodevelopmental genes. This table shows the number of candidate autism, intellectual disability and schizophrenia genes annotated for apoptosis function. The minimum, mean and maximum numbers of apoptosis genes in 100,000 simulated sets of candidate genes are shown, along with the percentiles and empirical p-values of the observed apoptosis overlap for each simulation.
Brain and eye morphology assays
In brain morphology experiments, all embryos received two injections at the 2-cell stage in 0.1X MMR containing 5% Ficoll. One cell was left uninjected and the other cell was injected with either control MO or MO targeted to the tested 3q29 gene, along with 300pg of GFP mRNA in the same injection solution. Stage 47 tadpoles were fixed in 4% PFA diluted in PBS for one hour, rinsed in PBS and gutted to reduce autofluorescence. Embryos were incubated in 3% bovine serum albumin and 1% Triton-X 100 in PBS for two hours, and then incubated in anti-acetylated tubulin primary antibody (1:500, monoclonal, clone 6-11B-1, AB24610, Abcam, Cambridge, UK) and goat anti-mouse Alexa fluor 488 conjugate secondary antibody (1:1000, polyclonal, A11029, Invitrogen Life Technologies, Carlsbad, CA). Embryos were then rinsed in 1% PBS-Tween and imaged in PBS. Skin dorsal to the brain was removed if the brain was not clearly visible due to pigment. For eye phenotype experiments, all embryos received four injections at the 2-cell or 4-cell stage in 0.1X MMR containing 5% Ficoll with either the control MO or MOs targeted to each 3q29 gene. Stage 42 tadpoles were fixed in 4% PFA diluted in PBS. Tadpoles were washed three times in 1% PBS-Tween for one hour at room temperature before imaging.
X. laevis image acquisition and analysis
Lateral view images of stage 42 tadpoles for eye experiments and dorsal view images of state 47 tadpoles for brain experiments were each collected on a SteREO Discovery.V8 microscope using a Zeiss 5X objective and Axiocam 512 color camera (Zeiss, Thornwood, NY, USA). Areas of the left and right eye, forebrain, and midbrain were determined from raw images using the polygon area function in ImageJ. Eye size was quantified by taking the average area of both the left and right eye, while forebrain and midbrain area were quantified by taking the ratio between the injected side versus the uninjected side for each sample.
Western blot for apoptosis
Two replicate western blot experiments were performed to test for apoptosis markers in X. laevis with 3q29 gene knockdown (Figure 7—Figure Supplement 1). Embryos at stages 20-22 were lysed in buffer (50mM Tris pH 7.5, 1% NP40, 150mM NaCl, 1mM PMSF, 0.5 mM EDTA) supplemented with cOmplete Mini EDTA-free Protease Inhibitor Cocktail (Sigma-Aldrich, Basel, Switzerland). Blotting was carried out using rabbit polyclonal antibody to cleaved caspase-3 (1:500, 9661S, Cell Signaling Technology, Danvers, MA, USA), with mouse anti-beta actin (1:2500, AB8224, Abcam, Cambridge, UK) as a loading control. Chemiluminescence detection was performed using Amersham ECL western blot reagent (GE Healthcare Bio-Sciences, Pittsburgh, PA, USA). Band intensities were quantified by densitometry in ImageJ and normalized to the control mean relative to beta-actin. Due to the low number of replicates, we did not perform any statistical tests on data derived from these experiments.
Human brain-specific network analysis of 3q29 gene interactions
We used a human brain-specific gene interaction network that was previously built using a Bayesian classifier trained on gene co-expression datasets (Greene et al., 2015; Krishnan et al., 2016). We extracted interactions with predicted weights >2.0 (containing the top 0.5% most likely interactions), and measured the distance of the shortest paths connecting pairs of 3q29 genes within the network, excluding genes without connectivity in the network from final calculations. As a control, we also measured the connectivity of 500 randomly selected genes with 100 replicates each of 20 other random genes. All network analysis was performed using the NetworkX Python package (Hagberg et al., 2008).
Overlap between neurodevelopmental and apoptosis gene sets
We obtained a set of 1,794 genes annotated with the Gene Ontology term for apoptotic processes (GO:0006915) or children terms from the Gene Ontology Consortium (AmiGO v.2.4.26) (Carbon et al., 2009), and compared this gene set to sets of 756 candidate autism genes (SFARI Gene Tiers 1-4) (Abrahams et al., 2013), 1,854 candidate intellectual disability genes (Thormann et al., 2019), and 2,546 curated candidate schizophrenia genes (Purcell et al., 2014). Genes in these three sets that were annotated for apoptosis function are listed in Supplementary File 4. To determine the statistical significance of these overlaps, we performed 100,000 simulations to identify the number of apoptosis genes among groups of genes randomly selected from the genome, and determined the percentiles for each observed overlap among the simulated overlaps as empirical p-values.
Statistical analysis
Details of each dataset and the associated statistical tests are provided in Supplementary File 5. All statistical analyses of functional data were performed using R v.3.4.2 (R Foundation for Statistical Computing, Vienna, Austria). Non-parametric one-tailed and two-tailed Mann-Whitney tests were used to analyze Drosophila functional data and human network data, as several datasets were not normally distributed (p<0.05, Shapiro-Wilk tests for normality). Climbing ability and survival data for each fly RNAi line across each experiment day were analyzed using two-way and one-way repeated values ANOVA tests with post-hoc pairwise t-tests. We also used parametric t-tests to analyze Drosophila qPCR data and all X. laevis data, as these data were either normally distributed (p>0.05, Shapiro-Wilk tests for normality) or had a robust sample size (n>30) for non-normality. All p-values from statistical tests derived from similar sets of experiments (i.e. Flynotyper scores for pairwise interactions, dcp1 rescue experiments with Diap1) were corrected using Benjamini-Hochberg correction.
Reproducibility
Drosophila eye area and pH3 and TUNEL staining experiments for select individual knockdown lines, as well as climbing ability experiments for a subset of individual and pairwise knockdown lines, were performed on two independent occasions with similar sample sizes. Data displayed in the main figures were derived from single batches, while data from the repeated experiments are shown in Figure 2—Figure Supplement 9. X. laevis brain and eye area experiments were performed on three independent occasions, with the data shown in the figures representing pooled results of each of the three experimental batches (normalized to the respective controls from each batch). X. laevis qPCR experiments were performed three times and western blot experiments were performed twice, with the blots/gels for each replicate experiment shown in Figure 7—Figure Supplement 1. Sample sizes for each experiment were determined by testing all available organisms; no prior power calculations for sample size estimation were performed. No data points or outliers were excluded from the experiments presented in the manuscript.
Data availability
Gene expression data for the six Drosophila individual and pairwise RNAi knockdown of homologs of 3q29 genes are deposited in the GEO (Gene Expression Omnibus) database with accession code GSE128094, and the raw RNA Sequencing files are deposited in the SRA (Sequence Read Archive) with BioProject accession PRJNA526450. All other data generated and analyzed in study are included in the manuscript and supporting files. All unique biological materials described in the manuscript, such as recombinant fly stocks, are readily available from the authors upon request.
Code availability
All source code and datasets for generating genomic data (RNA-Seq, network analysis, and neurodevelopment/apoptosis gene overlap) are available on the Girirajan lab GitHub page at https://github.com/girirajanlab/3q29_project.
COMPETING INTERESTS
The authors declare that they have no competing interests.
SUPPLEMENTARY FILES AND LEGENDS
Supplementary File 1 (Excel file). Pathogenicity metrics, mutations in disease cohorts, and biological functions of 3q29 genes. 3q29 genes with Residual Variation Intolerance Scores (RVIS) <20th percentile (Petrovski et al., 2013) or probability of Loss-of-function Intolerant (pLI) scores >0.9 (Lek et al., 2016) are considered to be potentially pathogenic in humans and are shaded in gray. Mutations within 3q29 genes identified in disease cohorts were curated from three databases: denovo-db v.1.6.1 (Turner et al., 2017), GeneBook database (http://atgu.mgh.harvard.edu/~spurcell/genebook/genebook.cgi); and SFARI Gene (Abrahams et al., 2013). Molecular functions for 3q29 genes were derived from RefSeq, UniProtKB and Gene Ontology (GO) individual gene summaries (O’Leary et al., 2016; The Gene Ontology Consortium, 2019; UniProt Consortium, 2018), and GO SLIM terms for human genes and fly homologs were curated from PantherDB (Mi et al., 2017). Annotations for cell cycle/apoptosis and neuronal function were derived from GO Biological Process annotations for each gene.
Supplementary File 2 (Excel file). List of fly stocks and full genotypes for all crosses tested. This file lists the stock lines, stock center, and genotypes for primary and validation lines for fly homologs of 3q29 genes as well as neurodevelopmental and apoptosis genes outside of the 3q29 region. Full genotypes for all individual and pairwise crosses tested in the manuscript are also listed in the file. BDSC: Bloomington Drosophila Stock Center; VDRC: Vienna Drosophila Resource Center.
Supplementary File 3 (Excel file). Transcriptome analysis of flies with knockdown of homologs of 3q29 genes. This file lists all differentially expressed genes from RNA sequencing of flies with Elav-GAL4 RNAi knockdown of homologs of 3q29 genes, as defined by log-fold change >1 or < −1 and false discovery rate (FDR) <0.05 (Benjamini-Hochberg correction). Human homologs identified using DIOPT are included for each differentially-expressed fly gene. The file also includes enriched Gene Ontology (GO) terms (p<0.05, Fisher’s Exact test with Benjamini-Hochberg correction) for each set of differentially-expressed fly genes, as well as lists of GO terms enriched among their corresponding human homologs.
Supplementary File 4 (Excel file). List of candidate neurodevelopmental genes with apoptosis function. This file lists 525 candidate neurodevelopmental genes that are annotated for apoptosis GO terms, including their membership within pathogenic CNVs.
Supplementary File 5 (Excel file). Statistical analysis of experimental data. This file shows all statistical information (sample size, mean/median/standard deviation of datasets, Shapiro-Wilk test statistics for normality, statistical test and controls used, test statistics, p-values, confidence intervals, and Benjamini-Hochberg FDR corrections) for all data presented in the main and supplemental figures. Statistical information for ANOVA tests includes factors, degrees of freedom, test statistics, and post-hoc pairwise t-tests with Benjamini-Hochberg correction.
VIDEO LEGENDS
Video 1. Climbing ability of flies with knockdown of individual homologs of 3q29 genes. This video shows the climbing ability of Elav-GAL4 control, Cbp20 and dlg1 individual RNAi knockdown flies at day 10 of the climbing ability experiments.
Video 2. Climbing ability of flies with pairwise knockdowns of homologs of 3q29 genes. This video shows the climbing ability of Cbp20/dlg1 and Cbp20/Fsn pairwise Elav-GAL4 RNAi knockdown flies at day 10 of the climbing ability experiments.
ACKNOWLEDGMENTS
We thank A. Krishnan for assistance with the brain-specific gene interaction network analysis, J. Tiber for technical assistance with the X. laevis experiments, and V. Faundez for useful discussions and critical reading of the manuscript. This work was supported by a Basil O’Connor Award from the March of Dimes Foundation (#5-FY14-66), NIH R01-GM121907, a NARSAD Young Investigator Grant from the Brain and Behavior Research Foundation (22535), and resources from the Huck Institutes of the Life Sciences to S.G., NIH T32-GM102057 to M.J., and NIH R01-MH109651 to L.A.L. The funders had no role in study design, data collection and interpretation, or the decision to submit the work for publication
Footnotes
We have made the following changes to increase the clarity and contextualize the results towards the 3q29 deletion: 1. We examined connectivity patterns of 3q29 genes in multiple human gene interaction databases, and observed strong connectivity among 3q29 genes in both general and brain-specific gene interaction networks (Figure 3-Figure Supplement 5). 2. We expanded our enrichment analysis of apoptosis function among candidate schizophrenia genes to also include autism and intellectual disability genes (Figure 8-Figure Supplement 2). 3. We expanded our Gene Ontology enrichment analysis of genes differentially expressed with knockdown of homologs of 3q29 genes to include both differentially-expressed fly genes as well as their human homologs (Figure 3-Figure Supplement 4A-B). 4. We clarified several points regarding the relevance of our results towards the entire deletion, including (a) functional conservation of homologs of 3q29 genes and apoptosis pathways between Drosophila and humans (Supplementary File 1); (b) the role of the deletion and apoptosis pathways towards autism and other neurodevelopmental disorders; and (c) that apoptosis and complex interactions are not unique functionalities of genes in the 3q29 deletion region, and apoptosis is likely one of several biological mechanisms disrupted by the deletion (Figure 8). 5. We added a discussion of previous findings from animal models for individual homologs of 3q29 genes (Figure 1-Figure Supplement 3), recently published mouse models of the entire deletion (Figure 8-Figure Supplement 1), and de novo mutations in 3q29 genes from individuals with neurodevelopmental disorders (Supplementary File 1). 6. We revised the gene nomenclature throughout the manuscript, and added lists of full genotypes for all fly experiments (Supplementary File 2). 7. We expanded the Reproducibility section of the Methods, and added data for each of the Drosophila replication experiments (Figure 2-Figure Supplement 9). 8. We revised our statistical analyses for all experiments, including performing multiple testing correction on all sets of experiments (Supplementary File 5). 9. We expanded our axonal targeting analysis to show the phenotypic severity for each tested RNAi line or pairwise interaction (Figure 2-Figure Supplement 2). 10. We compared Flynotyper scores for homologs of genes in the 3q29 region to those for homologs of known neurodevelopmental genes (Figure 2-Figure Supplement 5). 11. We quantified necrotic patches in adult flies with knockdown of Cbp20 and overexpression of Dronc (Figure 5C).
REFERENCES


