

Abstract
Tree structures, showing hierarchical relationships and the latent structures between samples, are ubiquitous in genomic and biomedical sciences. A common question in many studies is whether there is an association between a response variable measured on each sample and the latent group structure represented by the tree. Currently this is addressed on an ad hoc basis, usually requiring the user to decide on an appropriate number of clusters to prune out of the tree to be tested against the response variable. Here we present a statistical method with statistical guarantees that tests for association between the response variable and the tree structure across all levels of the tree hierarchy with high power, while accounting for the overall false positive error rate. This enhances the robustness and reproducibility of such findings.
In the era of big data where quantifying the relationship between samples is difficult, tree structures are commonly used to summarize and visualize the relationship between samples and to capture latent structure. The hierarchical nature of trees allows the relationships between all samples to be viewed in a single framework and this has lead to their widespread usage in genomics and biomedical science. Examples are phylogenetic trees built from genetic data, hierarchical trees based on distance measures of features of interest (for example gene expression data with thousands of markers measured in each sample), evolution of human languages, and more broadly in machine learning where clustering and unsupervised learning is a fundamental task 1–5.
Often samples have associated phenotypes (response variables) and a common question is whether there is an association between the latent group structure captured by the tree and the phenotype of interest. Testing for all possible combinations of groupings on the tree is practically impossible as it grows exponentially with sample size. Currently users typically decide on the number of clusters on an ad hoc basis (e.g., after plotting the phenotypes on the tips of the tree and deciding visually which clusters to choose). These clusters are then tested for association with the phenotype of interest. This lack of rigorous statistical methodology has limited the translational application and reproducibility of these methods. Here, we present a statistical method and accompanying R package, treeSeg, that given a significance level α, tests for association between the phenotypes and all levels of hierarchy in the tree while accounting for multiple testing. It returns the most likely segmentation of the tree such that each segment has a distinct phenotype distribution, while controlling the overall false positive error rate. The method is applicable to a wide-range of problems across many scientific disciplines where the association between a tree structure and a response variable is under investigation, such as phylogenetic studies, molecular epidemiology, metagenomics, gene expression studies, etc. 1, 6–8. The only inputs needed are the tree structure and the phenotypes of interest for the tips of the tree. We demonstrate the sensitivity and specificity of treeSeg using simulated data and its application to a cancer gene expression study 3.
For ease of presentation we restrict to discrete binary phenotypes. However, the procedure is equally applicable to continuous and other observation types (see Methods). If there is no association between the tree and the phenotypes, then the observed phenotypes would be randomly distributed on the tips of the tree, independent of the tree structure. However, if the distribution of phenotypes is associated with the tree structure, we may observe clades in the tree with distinct phenotype distributions. The power to detect segments with distinct distributions depends on the size of the clade and the change in phenotype probability which means one can only make statistical statements on the minimum number of clades with distinct distributions on the tree and not the maximum.
Figure 1 illustrates our method and its output for a simulated dataset. The phenotypes are displayed on the tips of the tree as black and gray lines. The tree is made of three segments with distinct distributions over the phenotypes indicated by dark gray, light gray and white backgrounds. Given a confidence level 1 − α (e.g., 1 − α = 0.9, 0.95), treeSeg procedure estimates the most likely segmentation of the tree into regions of common phenotype distributions, such that the true number of segments is at least as high as the estimated number of segments with probability of 1 − α. Our method employs many likelihood ratio statistics simultaneously to test for changes in the phenotype distribution on all levels of tree hierarchy and estimates at what level, if any, there is a change. The multiple testing procedure of treeSeg is based on a multiscale change point methodology 9, tailored to the tree structure. The significance levels of the individual tests are chosen in such a way that the overall significance level is the pre-specified α. Theoretical proofs are provided in Online Methods section. In the example of Figure 1, using α = 0.1, treeSeg estimates three segments in the tree, indicated with red dots on the nodes of the tree, recovering the true simulated changes in phenotype distributions. Our method also provides confidence sets (at 1 − α level) for the nodes of the tree associated with the change in phenotype distribution and a confidence band for the phenotype probabilities over the segments. In Figure 1, blue dots on the tree indicate the 1 − α confidence set for the nodes on the tree associated with the change in phenotypes. The red line, in the bottom plot, shows the maximum likelihood estimate of the phenotype probabilities for each segment, which accurately recovers the true simulated probabilities shown as black dotted line. The orange band, shows the 1 − α confidence band of the phenotype probabilities. The treeSeg method includes a straight forward way to handle missing data and to make phenotype predictions on new samples. Computationally, treeSeg scales well with sample size, for example a test simulation for a tree with 100,000 samples (number of tips in the tree) and no phenotype association took around 110 minutes to run on a standard laptop. For a detailed description of the model and inference procedure see the Online Methods section.

Illustration of the treeSeg method. Binary tree with 200 tips and three segments with distinct phenotype distributions indicated by dark gray, light gray and white backgrounds. Phenotype for each sample is shown on the tips of tree as gray or black vertical lines. Tip phenotypes were simulated such that the black line has probability of 0.95, 0.47 and 0.05 for each of the dark gray, light gray and white background sections respectively. Using α = 0.1, treeSeg has estimated three segments on the tree with distinct phenotype distributions indicated by the red dots on the nodes of the tree. Blue dots constitute a 90% confidence set for the nodes of the tree associated with the change in phenotype distribution. The bottom panel shows the simulation phenotype probabilities (black dotted line) and the treeSeg estimate (red line) and its 90% confidence bands in orange colour.
We confirmed the statistical calibration and robustness of treeSeg using simulation studies. We found that for reasonable minimal clade sizes and changes in phenotype distribution, treeSeg is able to detect association between phenotype and tree structure reliably (Supplementary Figs. 1-6). More importantly, treeSeg almost never detects segments which are not present (it can be mathematically proven that the inclusion of a false positive segment only happens with probability ≤ α, see Methods supplement) and the nominal guarantee of 1 − α is even exceeded in most cases (Supplementary text). For example, in 1,000 randomly generated trees (200 tips) with no changes in phenotype distribution, treeSeg (using α = 0.1) correctly assigns no association between phenotype and tree structure in 98.6% of the runs. Furthermore, we provide simulation results on stability of treeSeg with respect to the tree nodes ordering. Different ordering of tree nodes results in different tests being used for the multiple testing procedure. However, our simulations show that treeSeg is robust to changes in node ordering and consistently infers the correct number of segments on the tree (Supplementary Figs 7-15). For more details on simulation studies refer to the Supplementary text.
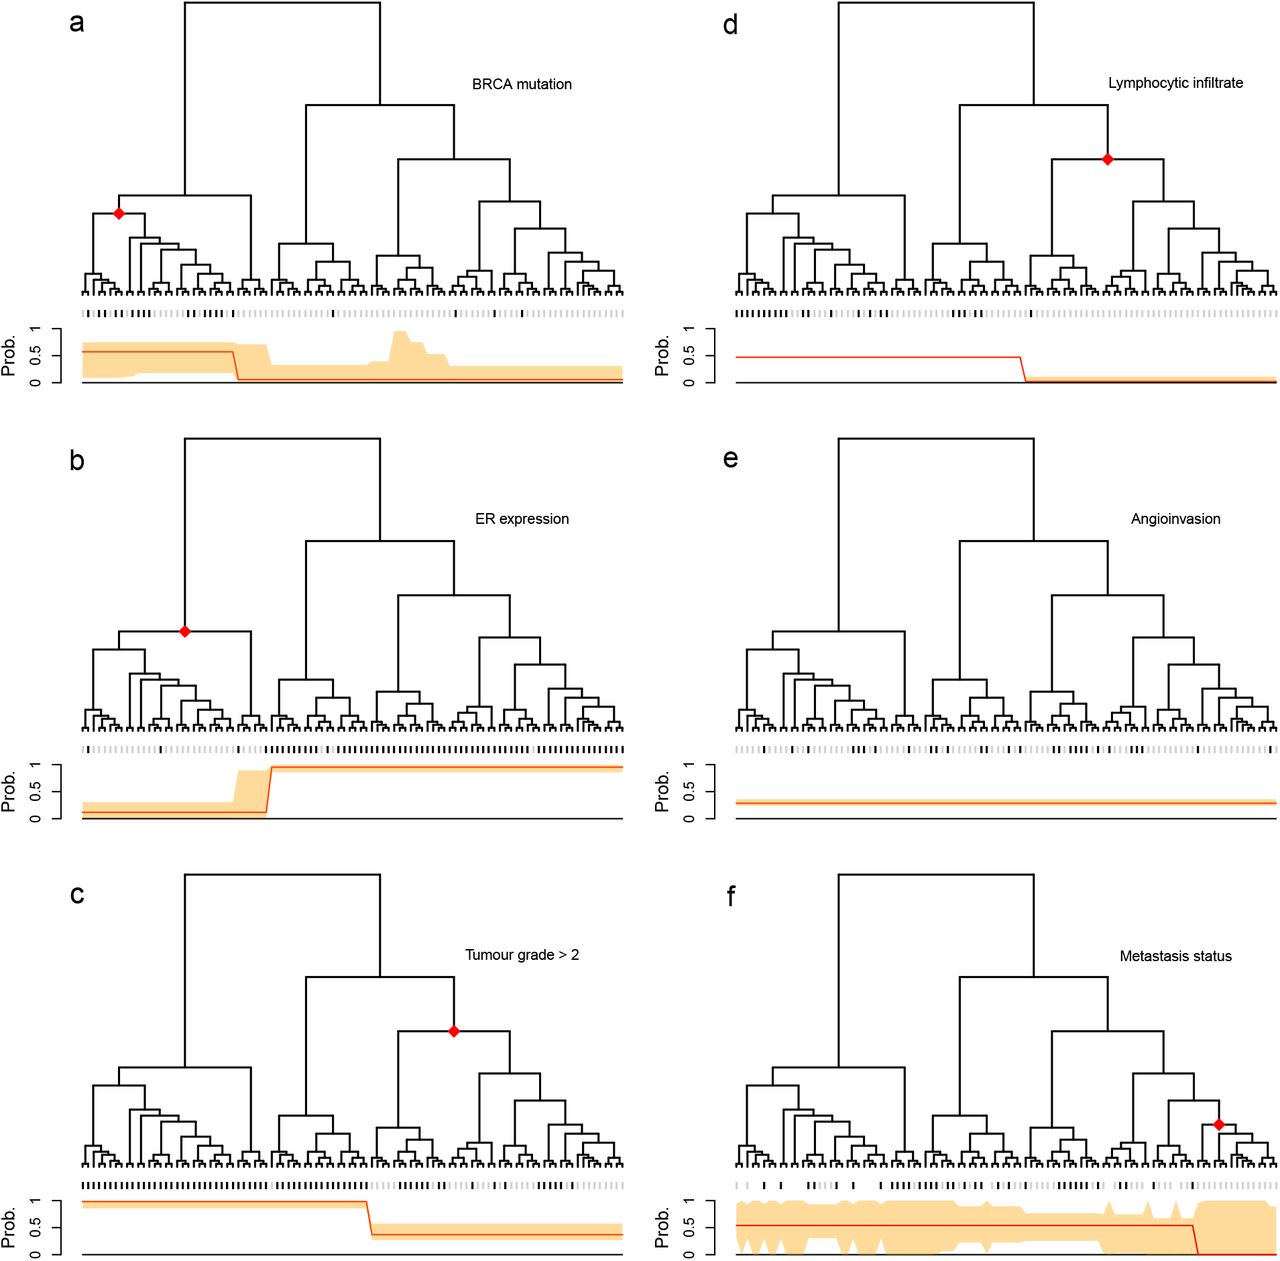
We illustrate the application of the method on a breast cancer gene expression study 3 where data are publicly available. Following the original study, we used correlation of gene expression data as a distance measure between samples to build a hierarchical clustering tree. In the original study, based on visual inspection, the authors divided the samples into two clusters, observing differences in the distributions of various clinical phenotypes between the two clusters. In contrast, treeSeg only requires a significance level α as input and searches for associations between phenotypes and the tree on all levels of hierarchy, while accounting for multiple testing. Our results are shown in Figure 2. Using an α = 0.05, for one of the phenotypes, treeSeg delinated the tree into two clusters with distinct phenotype distribution as in the original study. However, treeSeg reports different patterns of association between the tree and the other five phenotypes, including one, which has no association with tree structure.

Application of treeSeg to a cancer gene expression study 3. Gene expressions for 98 breast cancer samples were clustered based on correlation between samples. Six clinical phenotypes were collected for the samples, BRCA mutation, oestrogen receptor (ER) expression, histological grade, lymphocytic infiltration, angioinvasion and development of distant metastasis within 5 years which are represented in panels (a-f) respectively. In each panel, the treeSeg estimation (at α = 0.05) for clades with distinct phenotype distribution and their probabilities are indicated by the red dots on the tree and the red line below the tree. The orange band shows the 95% confidence band for the phenotype probabilities for the estimated segments. In panel (e) there is no association between the tree and the phenotype (angioinvasion) and in panel (f) some of the samples have missing observations for the phenotype (distant metastasis within 5 years).
Tree like structures are ubiquitous across many fields of science as they summarise the latent structure between samples in high dimensional datasets. The samples are often linked to observed response variables and a fundamental question in these settings is whether the latent structure of the data (represented by a tree structure) is associated with the response variables. This is often solved on an ad hoc basis, dividing the tree into clades by visual inspection and then testing for association between the clades and the trait of interest. Here, we propose a rigorous statistical method that tests for dependence between the tree structure and the trait of interest across all possible levels of the tree, while accounting for multiple testing. The only tuning parameter for the treeSeg method is a significance level α.
Depending on the application, the user can decide which value of α is appropriate, or screen through several values of α, e.g., α = 0.01, 0.05, 0.1, 0.5. A small α gives a higher confidence that all detected associations are, indeed, present in the data (with probability of at least 1 − α). A larger α allows to detect more clusters, but increases the risk of including false positive clusters. The confidence statement for detected clades and phenotype probabilities that accompany treeSeg’s segmentation, account for multiple testing at the level of 1 − α. This allows for precise uncertainty quantification when detecting associations between tree structure and the phenotypes. We highlighted treeSeg’s potential with an example from a gene expression study, but note its ubiquitous applicability in various settings. Our method treeSeg is implemented as an R package, available on GitHub (https://github.com/merlebehr/treeSeg) and accompanied by a detailed Jupyter notebook with reproductions of all figures in this text, and has the potential to be used across many fields of science.
Methods
Methods, including statements of data availability and any associated accession codes and references, are available in the online version of the paper.
Note: Any Supplementary Information and Source Data files are available in the online version of the paper.
Competing Interests
The authors declare that they have no competing financial interests.
Acknowledgements
AM was funded by the Deutsche Forschungsgemeinschaft (DFG, German Research Foundation) under Germanys Excellence Strategy - EXC 2067/1-390729940. MB acknowledges funding of DFG-GRK 2088. AM and MB acknowledge support of DFG-SFB 803 Z02. The authors thank Laura Jula Vanegas for help with parts of the implementation.


