

Abstracts
Purpose We developed an automated interpretation system for the whole process of Whole exome sequencing (WES) including raw data processing, variant calling, variant interpretation, and measurement of phenotypic similarity between the patient and each disease. This study was to investigate diagnostic yield and clinical utility of our new system that assists clinicians with diagnosis of patients with suspected genetic disorders.
Methods WES was performed a total of 194 patients (age range 0-68 years) with suspected genetic disorder. The patient inclusion criteria were delayed development within age of 5 months, multiple congenital anomalies with dysmorphic features, strongly suggestive features of monogenic disorder or genetically heterogeneous disorder, or not diagnosed despite performing genetic investigation.
Results WES reported 180 variants, of which 110 variants were confirmed by segregation analysis and 94 patients (48.4%) were diagnosed with 89 genetic disorders. There was no difference of diagnostic rate (48.9 %, 71/145 vs. 46.9%, 23/49, P > 0.05) and duration of the diagnostic odyssey (2.8 ± 3.3 vs. 4.1 ± 5.1, P= 0.293) between group with and without genetic test before WES. There was no significant difference in the distribution of clinical symptoms between the patients who were diagnosed with and without genetic disorder. Forty four percent of total patients filled only 9% of total symptom principal component analysis (PCA) space, and the remaining 56% of patients filled the other 91% of symptom PCA space. The two groups had similar genetic variant diversities (P = 0.899).
Conclusion This study showed improved diagnostic yield (48.4%) in patients with clinical heterogeneity by using automating variant interpretation. Diverse genetic variations were also observed in patients with similar symptoms. This study highlights the utility of automated interpretation system of WES to clarify differential diagnosis in patients with suspected genetic disorder.
Introduction
Recent advances in diagnostic techniques such as next-generation sequencing and whole exome sequencing (WES) have identified a variety of genetic disorders and related variants. The identification of causative genes in pediatric patients with suspected genetic disorders is important to make a decision of timely treatment and predict its consequence. In particular, in case of lethal genetic disorder, parents and clinicians have to reach a consensus on the type of treatment, active or conservative.
To date, more than 6300 genetic disorders and 4000 genes have been established on a molecular basis with the help of WES, and the numbers are still growing (1, 2). Diagnostic yield was shown to vary according to the patient’s phenotype, sample size, and cohort characteristics, while the average diagnostic rate of WES reported by various institutions is about 40% (3-10). It is time-consuming and challenging for clinical geneticist and bioinformatics to match a large number of candidate variants with diverse clinical symptoms (11). In addition, the lack of supporting data leaves many variants as those of uncertain significance, leading to a number of questions to patients as well as clinicians (12). To address the issue, medical practitioners use several bioinformatic tools to establish prioritized variants, in accordance with the guideline of American College of Medical Genetics (ACMG) (13, 14). These tools still have limitations in accurately predicting the possible clinical effects of each variant. Phenovar, an interpretation tool developed in 2014, first calculated a patient-specific diagnostic score for each Online Mendelian Inheritance in Man (OMIM) entry, which is assigned to each given variant (3). Although this has noticeably reduced the number of prioritized variants, the diagnosis rate is about 35%, not significantly different from that of previous studies (4).
In order to improve diagnostic yield, we first took advantage of artificial intelligence technology to extract a rich pool of data on the pathogenicity of variants from scientific literatures. Then we built a streamlined variant interpretation software, which conducts under few minutes an interpretation of over 100,000 variants according to the ACMG guideline (15) and prioritizes variants. 3 Billion created a symptom suggestion system based on Human Phenotype Ontology (HPO), which increases probability of capturing all of the patient’s symptoms. Finally, the system scored similarity between clinical symptoms caused by prioritized variants and patient’s phenotype. And the score was matched with plausible genetic diagnosis listed in OMIM data base.
This study was to investigate diagnostic yield and clinical utility of our new software that assists clinicians with diagnosis of patients with suspected genetic disorders.
Materials and Methods
Recruitment of patients
The study enrolled a total of 194 patients with clinically suspicion of genetic disorder, non-consanguineous Korean families from March 2018 to February 2019 at the Medical Genetics Center, Asan Medical Center, Seoul, South Korea. Patients were referred to the outpatient clinic or consulted from diverse department. Their detailed clinical characteristics were reviewed, including age at presentation and diagnosis, sex, family history, laboratory findings, radiologic findings, and genetic testing results. The inclusion criteria of patients were delayed development within age of 5 months, multiple congenital anomalies with dysmorphic features, strongly suggestive features of monogenic disorder or genetically heterogeneous disorder, or not diagnosed despite performing genetic investigation. Informed consent was obtained from parents or patients after genetic counseling regarding WES testing. The study was approved by the Institutional Review Board for Human Research of Asan Medical Center (IRB number: 2018-0574).
Whole exome sequencing, variant calling and annotation
Blood, saliva or buccal swab sample were collected from the patients to extract genomic DNA. For the generation of standard exome capture libraries, we used the Agilent SureSelect Target Enrichment protocol for Illumina paired-end sequencing library (Version C2, December, 2018). In all cases, the SureSelect Human All Exon V6 probe set was used. Exome capture was performed according to the standard Agilent SureSelect Target Enrichment protocol. The captured DNA was then amplified. The final purified product is then quantified using qPCR according to the qPCR Quantification Protocol Guide and qualified using the TapeStation DNA screentape (Agilent). And then we sequenced using the NovaSeq platform (Illumina, San Diego, USA).
Paired-end sequences produced by HiSeq Instrument are firstly mapped to the human genome, where the reference sequence is UCSC assembly hg19 (original GRCh37 from NCBI, Feb. 2009), without unordered sequences and alternate haplotypes, using the mapping program ‘BWA’ (version 0.7.12), and generated a mapping result file in BAM format using ‘BWA-MEM’. Then, we applied programs packaged in Picard-tools (ver.1.130) in order to remove PCR duplicates reducing those reads identically match to a position at start into a single one, using MarkDuplicates.jar, which requires reads to be sorted. The local realignment process is performed to consume BAM files and to locally realign reads such that the number of mismatching bases is minimized across all the read. Base quality score recalibration and local realignment around indels were performed using Genome Analysis Toolkit to locally realign reads such that the number of mismatching bases is minimized across all the read.
Variant genotyping each sample was performed with Haplotype Caller of GATK (GATKv3.4.0). Based on the BAM file previously generated, Variant genotyping for each sample was performed with Haplotype Caller of GATK. In this stage SNP and short indels candidates were detected at nucleotide resolution. Those variants were annotated by another program called SnpEff v4.1g, to vcf file format, filtering with dbSNP for the version of 142, and SNPs from the 1000 genome project. Then in-house program and SnpEff was applied to filter additional databases, including ESP6500, ClinVar, dbNSFP2.9.
Prioritization of variants and symptom suggestion system
Variants with minor allele frequencies less than 0.05% for dominant disease association or 2% for recessive disease association in population genome databases including gnomAD (http://gnomad.broadinstitute.org/), ExAc (http://exac.broadinstitute.org/), 1000 genome (http://www.internationalgenome.org/), and ESP (https://evs.gs.washington.edu/EVS/) were considered for further interpretation. The proband’s clinical phenotypes were transformed to corresponding HPO terms, and accessed to measure the similarity with each of ~7,000 rare genetic diseases (16, 17). Pathogenicity of each variant on its associated diseases were evaluated according to the recommendations of ACMG guideline (15) The whole processes of genetic diagnosis including processing of raw genome data, phenotype to disease similarity measure and variant interpretation were integrated and automated into an computational framework. (Figure 1)
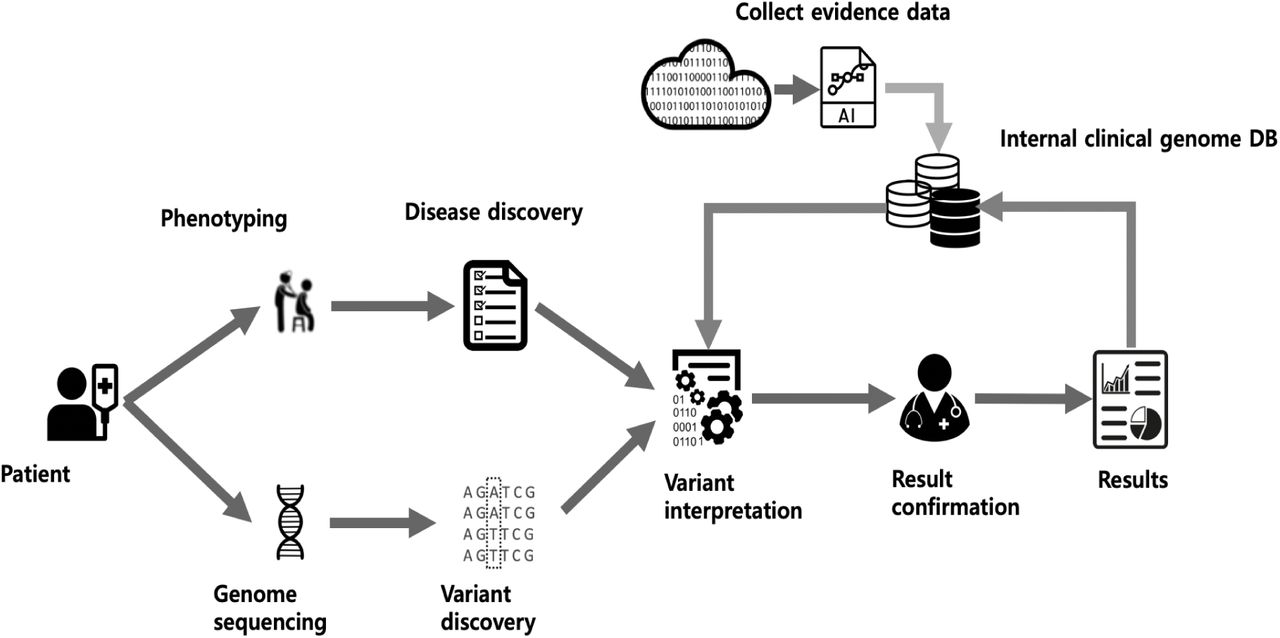
Whole automated process illustrating the variant filtration steps, phenotype calculation, and the match of plausible genetic diagnoses
Variant interpretation and confirmation
Variants were interpreted based on our new software and patient’s phenotype by medical geneticists and a clinical geneticist. Finally, physician in the outpatient clinic ordered sanger sequencing to patients and their parents after one more examination in outpatient clinic.
Statistical analysis
All statistical analyses were performed with R studio (version 3.5.1). To analyze principal Component Analysis (PCA) of symptom and genetic variation, patient symptom matrix was constructed to have 1 as an entry (i, j) if a patient j has symptom i, and 0 otherwise. Genetic variation matrix has 1 as an entry (i, j) if a patient j has variant i. All pathogenic variants aggregated from total patients were used. 10 types of functional type of variation were treated separately to make 1285 combination of gene and functional variant types of pathogenic variation. The two major principal components of patient symptom matrix and genetic variation matrix were calculated by custom made program using Eigen C++ linear algebra library.
Results
Patients demographics
Basic demographic characteristics were noted in Table 1. The mean age at presentation and performed WES of the patients was 6.8 ± 13.3 (range, 0 – 68 years) and 10.2 ± 14.7 years (range, 0 – 70 years), respectively. One hundred-fifty-three patients (78.8%) were under 10 years of age. Patients showed wide range of clinical manifestations, described by 25 high HPO categories. The average number of overlapping HPO categories per patient was 8.1 ± 5.0. The most common HPO category was nervous system (63.9%), followed by head and neck (46.9%), skeletal (44.8 %), cardiovascular (33%), eye (29.4%), and others were noted in Table 1. A 145 patients (74.7%) in this study were done genetic testing before WES. Targeted exome sequencing (included 4813 OMIM genes) and array comparative genome hybridization were performed in 24 patients and 5 patients, respectively, which revealed no diagnostic variants. Single gene test for monogenic disorder was performed in 59 patients. Patient 27 with suspected cystic fibrosis had only one variant of CFTR gene in one allele and patient 67 with elevated transaminase had only one variant of ATP7B gene in one allele. Patient 106 was diagnosed with lysinuric protein intolerance caused by homozygote variants of SLC7A7 gene (c.713C>T), but she was suspicion of inflammatory bowel disease or primary immune deficiency due to severe developmental delay, persistent diarrhea and recurrent infection. No variant was found in 56 patients. Genetic tests beyond the scope of WES included karyotype and/or fluorescence in situ hybridization (n = 37), multiplex ligation-dependent probe amplification (n = 29), methylation test for imprinting disease (n=7), and mitochondrial full genome sequencing (n= 13).
Characteristics of total 194 patients
Diagnostic yield by whole exome sequencing
WES reported 180 variants for 145 patients (74.7%), of which 110 variants were confirmed by conventional sanger sequencing for patients and/or their parents. Ninety-four patients (48.4%) were diagnosed with 89 genetic disorders. Among remaining 70 variants, 21 variants showed normal in sanger sequencing and 49 variants were inherited from mother or father. There were no variants in genes of relevance to the patient’s phenotype in 49 patients. The disease inheritance pattern of the 89 genes were autosomal dominant (n=60), autosomal recessive (n=23), and X-linked (n=6). Thirty patients were de novo cases. The type of variants was pathogenic (n=58, 52.7%), likely pathogenic (n=26, 23.6%), and uncertain significance (n=26, 23.6%) (Supplementary Table 1). Fifty-five novel variants were identified.
The most common HPO category in patients with genetic diagnosis was nervous system (64.9%), followed by head and neck (42.6%), skeletal (42.6%), musculature (30.9%), and cardiovascular (29.8%), which was similar with those of total patients (Figure 2A). More than 30% of most phenotypes were related to diagnosis, of which abnormality of connective tissue was 57.1% (Figure 2B). There was no significant difference in the average number of HPO categories between undiagnosed and diagnosed patients (8.6 ± 5.1 vs. 7.4 ± 5.7, P = 0.158). When divided group according to the age, 44.4% (68/153) of patients under 10 years old and 63.4% (26/41) of patients older than 10 years old were diagnosed with genetic disorder (P = 0.023). Patients older than 10 years old presented more primary phenotype than patients under 10 years old. (9.0 ± 4.9 vs. 3.5 ± 2.7, P < 0.001).
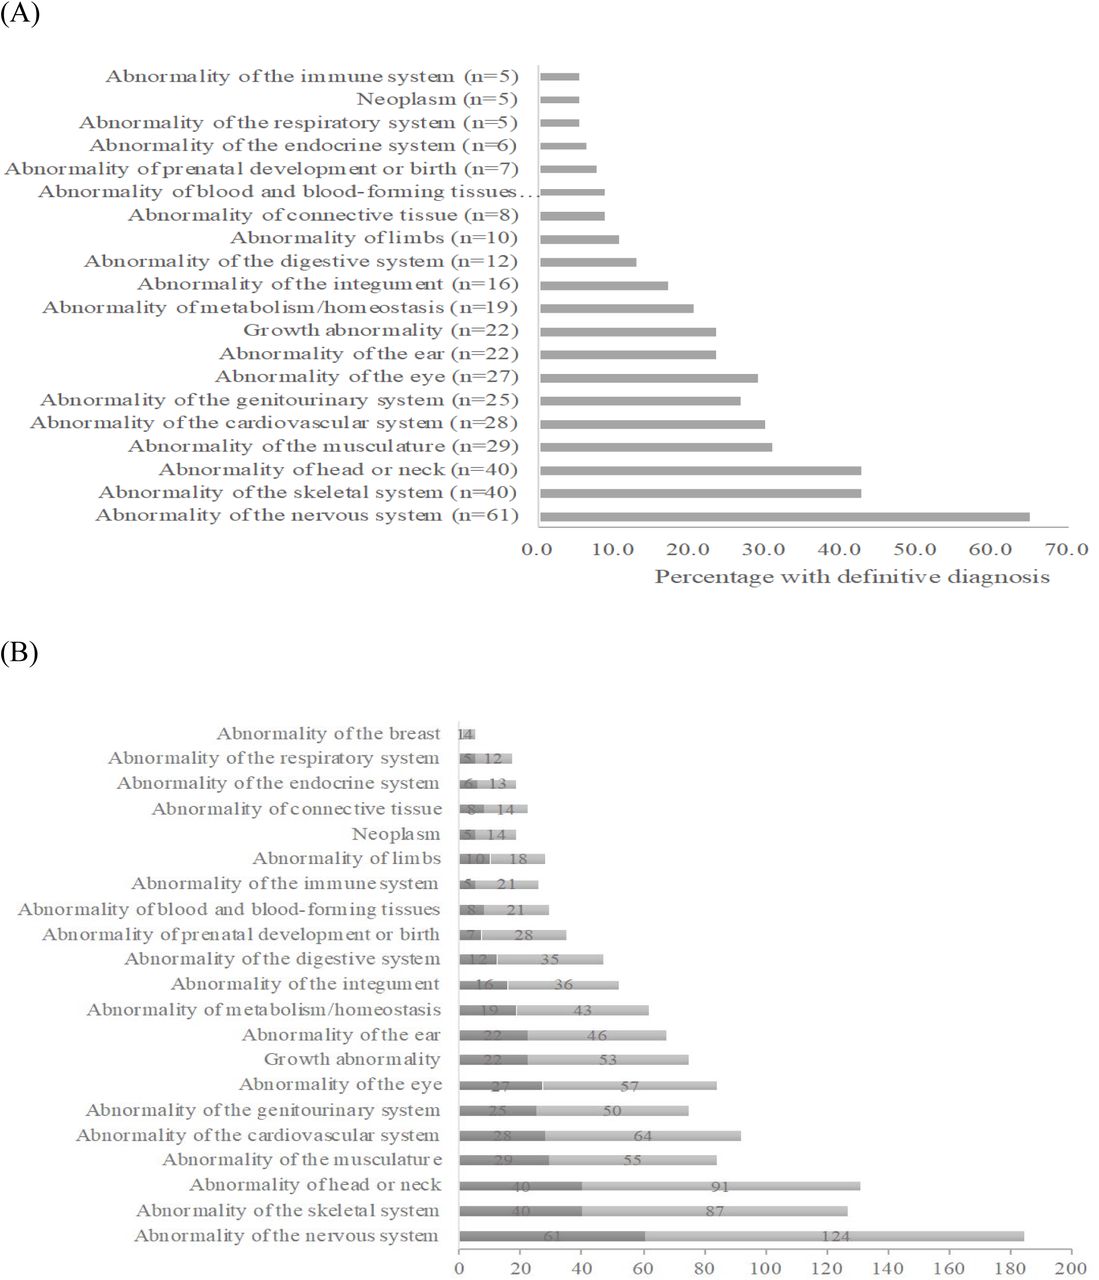
(A) Percentage of primary phenotype in patients with genetic diagnosis based on the primary phenotype, (B) Comparison of proportion of primary phenotype based on HPO between patients with and without genetic diagnosis, Dark bar: frequency of HPO of patients with genetic diagnosis, Light bar: frequency of HPO of total patients
Effectiveness of comprehensive WES
Duration of diagnostic odyssey in patients with genetic diagnosis was 3.3 ± 3.8 years (range, 0-19.4). There was no difference in the diagnosis rate according to the age at which clinical symptoms developed. There was no significant difference of diagnostic rate (48.9 %, 71/145 vs. 46.9%, 23/49, P = 0.531) and duration of the diagnostic odyssey (2.8 ± 3.3 vs. 4.1 ± 5.1, P= 0.293) between group with and without genetic test before WES.
In Figure 3A, when the patients were distributed based on the patient’s symptoms, the right-centered portion indicated patients with similar symptoms. There was no significant difference in the distribution of clinical symptoms between the patients who were diagnosed with and without genetic disorder (by 2-dimensional Kolmogorov-Smirov test). Similarity of principal component (PC1) value in symptom principal component analysis (PCA) of two patients implies symptom similarity of the patients. By visual inspection of Figure 3B, we divided patients into two groups using 0.75 of PC1 in symptom PCA value as a threshold. Eighty-six patients out of 194 (44%) were grouped together in PC1 of symptom PCA range from 1.03 to 0.75 (9% of total symptom PCA PC1 length). In other words, 44% of total patients filled only 9% of total symptom PCA space, and the remaining 56% of patients filled the other 91% of symptom PCA space. The two patient groups had similar genetic variant diversities (P = 0.899 by Student’s t-test of PC1 values of genetic variation PCA).

(A) Distribution of patients in symptom space, (B) Distribution of patients in symptom and genetic variation space
Impact on clinical management after genetic diagnosis
Four patients changed their clinical management after WES and 29 patients had additional surveillance for known complications of their condition.
Patient 11 presented hypernatremia and did not responded desmopressin at age of 1 year. She was diagnosed with clinically nephrogenic diabetes insipidus, not identified pathogenic variants of AVPR2 and AQP2 gene, which was treated with thiazide. However, she developed poor feeding, hypokalemia, alkalosis and hypernatremia. After WES, she was diagnosed with Batter syndrome caused by c.C382T (p.R128X) of SLC12A1 gene and stopped medication. Patient 38 showed macrocephaly, elevated transaminases, ketosis, increased lactate in serum and cerebrospinal fluid, abnormal acylcarnitine profile at age of 1.3 years. There was no pathogenic variant of HADHA gene. She was diagnosed with medium-chain acyl-CoA dehydrogenase deficiency caused by c.A1084G (p.K362E) and c.T1288A (p.Y430N) of ACADM gene and was administered carnitine supplements with frequent food intake. Patient 50 presented recurrent renal stone at age 32 years, which lead to chronic kidney disease at age 41 years. Kidney biopsy showed accumulation of calcium oxalate crystals, but no pathogenic variant of AGXT gene was found. Homozygote c.G294A (p.W98X) of APRT gene was identified in WES and he was diagnosed with adenine phosphoribosyltransferase deficiency. Then, he was treated with allopurinol while waiting for kidney transplantation. Patient 73 showed lactic acidosis and hyperbilirubinemia at birth and initial mitochondrial genome test was negative. Because of high lactate level in serum, she was on ketogenic diet. After WES, she was diagnosed with pyruvate carboxylase deficiency caused by c.180delinsGC and c.2875delinsGT of PC gene and stopped ketogenic diet. She started high carbohydrate diet, which lead to improvement of biochemical findings.
Discussion
WES has been used to find genetic causes in a large population of patients with autism, epilepsy, neurodevelopmental delay, hearing loss, and congenital heart disease, and it has effectively identified many novel genes and has suggested mechanism (3-10). In particular, patients who had hearing problem, visual impairment, or abnormality of musculoskeletal system, or patients being critical condition or presenting symptom at newborn period showed higher diagnostic yield (over 50%) compared with that of other patients (4, 8, 18). However, researchers find diagnostic process exhausting because WES takes large amount of time to interpret a vast amount of variants, even though the clinical utility of WES has been clearly shown in various studies (6, 11). We developed an automated interpretation system for the whole process of WES including raw data processing, variant calling, variant interpretation, and measurement of phenotypic similarity between the patient and each disease. There were initially more than 100,000 variants identified from WES, around 25,000 variants were remained after filtering out variants without association of disease. About 1,000~1,100 variants were classified as pathogenic, likely pathogenic or uncertain significance with estimation of pathogenicity according to ACMG guideline (15). Fewer than 20 variants with significant similarity between associated disease and patient’s phenotypes remain for clinical confirmation by medical geneticists. The whole workflow before final confirmation by clinicians is all processed automatically, which reduces the total amount of time for the diagnostic process from 20~40 hours to less than 20 minutes with a detection rate as high as that reported in previous study (11). This present study showed improved diagnostic yield despite including patients with clinical heterogeneity and varying age, which means this newly introduced system is more effective than the traditional bioinformatics tools, and especially reduces time to calculate pathogenicity for a number of variants and correlate patient’s phenotype with genotype. The diagnostic odyssey left emotional exhaustion for the uncertainty of diagnosis and high cost for several investigations including biochemical tests, imaging tests, and genetic tests (19). According to a survey of patients with genetic disease in Europe, 25% of patients took a broad diagnostic period of 5 to 30 years from presenting symptom to receiving a definitive diagnosis (20). Forty percent of these patients were misdiagnosed during that period, leading to inappropriate intervention and unsatisfactory genetic counselling (20). The most common contributing factor for patients not receiving a genetic diagnosis prior to WES was significant genetic heterogeneity and phenotypic diversity associated with their disorders (21). Recent study for infants with a suspected monogenic disorder performed singleton WES without pregenetic tests, showing high diagnostic yield and impact on clinical management (8). In this present study, no difference in detection rate and diagnostic duration was found for patients with or without previous genetic tests. Furthermore, genetic heterogeneity was identified among patients with similar symptoms, even though clinician suspected specific disorders that were well known to match with their phenotypes. Thus, WES as a first-tier option for undiagnosed patients would be clinically valid and cost-effective to be performed at patient’s first visit without other genetic tests such as chromosomal microarray, targeted panel, or clinical exome sequencing.
Although the number of patients older than 10 years old in this cohort was smaller than that of patients under 10 years old, diagnostic rate in the former population was higher than that in the latter one. The diagnosis for patients older than 10 years was associated with abnormality of connective tissue, kidney, eye, or musculoskeletal system, which was consistent with the fact that they showed fewer phenotypes than patients under 10 years old. This may be associated with having a specific phenotype in the case of diseases that develop symptoms as the patient ages, which can contribute to a high diagnostic yield in older patients.
For all patients for whom a diagnosis was made, clinicians may receive accurate prognostic information to provide future reproductive genetic counselling and management to their families. Depending on both the diagnostic period and cohort characteristics, the percentage of patients whose clinical management has changed varied from 5% to 65% (8, 18, 21). About 30% of patients with genetic diagnosis in this study had a change in clinical management after WES. Three patients changed or stopped medication and one patient modified diet therapy. Twenty-nine patients had additional investigation related to known clinical course. Ultimately, the benefits of genetic diagnosis confirmed by molecular test can be extended beyond the direct management of patients and influence long term clinical course.
Several limitations of the study should be addressed. First, about 11% of reported variants failed Sanger confirmation in this study despite a few variants had sufficient quality score (data not shown) and matched patient’s phenotype. Technical issue of WES is still major limitation of detection rate of WES for diagnosis of rare disease. The accuracy of WES has been improved with development of bioinformatics tools and genetic method, allowing to empirically be determined quality score (>500) for identified variant that do not require Sanger confirmation (22). However, even with non-stringent criteria applied to whether or not to perform Sanger sequencing, 13% of the variants failed the sanger confirmation and 8.3% of them are unpredictable (23). There is still no clear criteria or method to predict which variants need further confirmation of variant, thus leading to need of additional validation of raw read depth and allele fraction by WES. Second, when groups were categorized by age, the total number of patients in each group was different. Third, twenty of patients with genetic diagnosis (20/94) did not performed segregation analysis due to definite family history, full matched phenotype, or absence of parents. Incomplete penetrance was not considered in these patients.
In conclusion, WES with an automated interpretation system showed high diagnostic yield, providing a definitive diagnosis to 48.4% of patients with clinical heterogeneity. Variants of different genes were identified in patients with similar phenotypes. Clinical management such as medication change and long-term surveillance had impact on patients with genetic diagnosis. Therefore, WES can be used as a first diagnostic method for patients presenting diverse symptoms involving the multidisciplinary system as well as patients with suspected specific disorders. However, studies on application of even more advanced platform are needed because clinical confirmation of identified variants and associated disorders still remains as a process that is not only time-consuming but also susceptible to error, which increases false results.
Authors’ contributions
BHL and CK designed the study. GHS, CK, and BHL drafted the manuscript and analyzed data. GHS, AO, YL, and BHL were the treating pediatricians and conducted all clinical analyses. The genetic analyses and variant interpretation were performed by GHS, JYP, SK, JL, and TK. All authors were involved in analyzing and interpreting data. All authors read and approved the final manuscript.
Disclosure
The authors declare no conflict of interest.
Acknowledgments
This work was supported by Institute for Information & communications Technology Promotion (IITP) grant funded by the Korea government (MSIT) (2018-0-00861, Intelligent SW Technology Development for Medical Data Analysis)
References


