

Abstract
In 1929 Hans Berger discovered the alpha oscillations: a prominent, ongoing 10 Hz rhythm in the human EEG. These alpha oscillations are amongst the most widely studied cerebral signals, related to cognitive phenomena such as attention, memory and consciousness. However, the mechanisms by which alpha oscillations affect cognition await demonstration. Here we provide a novel model system from an adequately described complex neural circuit of the honey bee (Apis mellifera), that exhibits properties of the alpha oscillations. We found a prominent alpha wave-like ongoing neural activity (∼ 18 Hz) that is reduced in amplitude upon stimulus presentation. The phase of this alpha activity biased both neuronal spikes and amplitude of high frequency gamma activity (> 30 Hz). These results suggest a common role of oscillatory neuronal activity across phyla and provide an unprecedented new venue for causal studies on the relationship between neuronal spikes, brain oscillations and cognition.
One Sentence Summary The cerebral circuit of the honey bee allows new vistas into mechanisms of human cognition.
Introduction
The brain encodes information by the rate and by the timing of action potentials (spikes) across neurons. The importance of timing has already been stressed in 1929 by Hans Berger who discovered the alpha oscillations: The strongest rhythmic oscillation measurable from the human scalp electroencephalogram (EEG) at a frequency of 10 Hz (1). In 1934 Adrian and Matthews confirmed this observation and concluded that the alpha oscillation arises “from an area in the occipital lobes connected with vision, and not from the whole cortex” (p.384) (2, 3). Today, alpha oscillations are amongst the most widely studied psychophysiological signals. They have been linked to cognitive functions such as attention and memory in humans and other vertebrates (4-7). Amplitude modulation of alpha oscillations is hypothesized to regulate neuronal excitability throughout the cortex (5, 6, 8), and the phase of alpha oscillations biases the rate of neuronal spiking within (9) and across cortical areas (10). On a larger scale, neural processing is functionally organized in feed forward (bottom up) and feedback (top down) streams (11). Feedback streams have been linked to alpha oscillations and feed forward streams to higher frequency oscillations above 30 Hz (gamma oscillations) (12-14). Studies in humans and cats suggest that oscillatory synchronization across brain hemispheres serves to integrate the different features of a visual object into a unitary percept (15, 16). However, the exact mechanisms by which alpha and gamma oscillations affect neural processing and manifests in behavior still await demonstration. Progress in revealing the mechanisms and functions of oscillatory brain activity is hampered by the difficulty to relate oscillatory brain activity to the spiking activity of identified neurons in behaving animals.
In recent years insects have become model systems for studying the relationship between the spiking activity of identified neurons and the animal’s perception and cognitive performance. For example, the perceived quality of an odor can be predicted from the ensemble of co-active olfactory neurons, each being identified by its specific pattern of afferent and lateral inputs (17-21), and the mechanistic understanding of odor learning is unparalleled both in regard to molecular pathways and the identity of neuronal circuits (22-24).
Albeit ubiquitous, most studies on insect brain function ignore oscillatory brain activity and focus mainly on the encoding of sensory information via stimulus-driven changes in spike rates rather than on network-driven spike synchrony across neurons. Insect brains show spontaneous oscillations that are reminiscent of alpha oscillations (water beetles (25); honey bees (26, 27)) and stimulus-evoked, higher frequency oscillations that are reminiscent of gamma oscillations (locusts (28); moths (29); flies (30); honey bees (31)). Olfactory induced gamma oscillations in the mushroom bodies of locusts and honey bees are driven by odorant-specific oscillatory spike synchronization in olfactory projection neurons and have been implicated in odor coding (31, 32). Visually induced oscillations in fruit flies are modulated by stimulus salience and have been implicated in attention (30, 33). However, it is unknown, whether insect brains show interhemispheric oscillatory synchronization, as is the case in vertebrates (15, 16).
To investigate interhemispheric oscillatory synchronization in the insect brain, we performed paired recordings of local field potentials (LFP) and spikes in both mushroom bodies of the honey bee. The mushroom bodies form associative odor memories (23, 34, 35), and they integrate unilaterally learned odor-reward associations across hemispheres (36). We found ongoing oscillatory 18 Hz activity in the LFP (Figure 1), which was coupled across the mushroom bodies of both sides of the brain (Figure 2). Spikes of putative mushroom body output neurons were phase-locked to the 18 Hz oscillation (Figure 2B). The ongoing 18 Hz oscillation was reminiscent to the human alpha oscillation in that sensory stimuli reduced its power, giving rise to higher frequency LFP oscillations (Figure 1C and D). Again, odorant-driven spikes were phase-coupled to the odorant-evoked LFP oscillations. These data demonstrate that both ongoing and odorant-evoked spikes in the honey bee mushroom body are precisely timed by a network-generated oscillatory clock. This oscillatory spike synchronization might play a role in object segmentation as has been proposed for mammals (37).
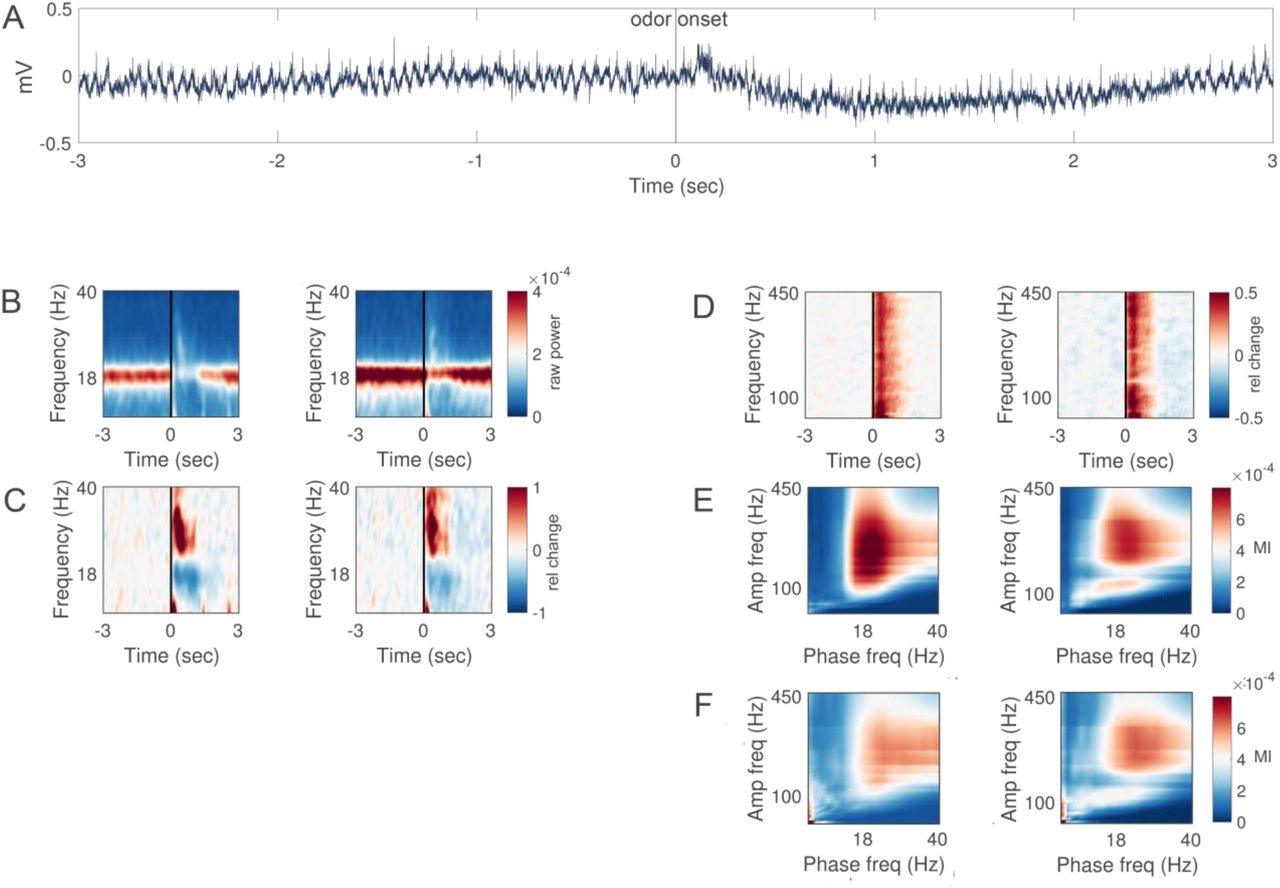
A: Raw trace of a single trial in a representative bee. Odor is presented at 0 sec. B: Time-frequency (5-40Hz, alpha and low gamma) representation of raw power (color-coded, mV/⍁Hz) recorded in the left (left) and right hemisphere (right) respectively. An odor stimulus was presented at 0 sec for the duration of 1 sec. C: Same as in B baseline corrected. Warm colors indicate increase and cold colors decrease in oscillatory power expressed as relative change from pre-stimulus baseline. N = 10 bees (stimulations per bee mean/SD 52.6/28.9). D: Same as in C but for higher frequencies (40-450Hz, high gamma). E: Cross-frequency phase-to-amplitude coupling. Bispectra illustrating cross-frequency relationships in the left and right hemisphere respectively. The phase providing frequency is depicted on the x-axis and amplitude providing frequency on the y-axis. Color code depict the modulation index (MI). F: Same as E but during olfactory stimulation.
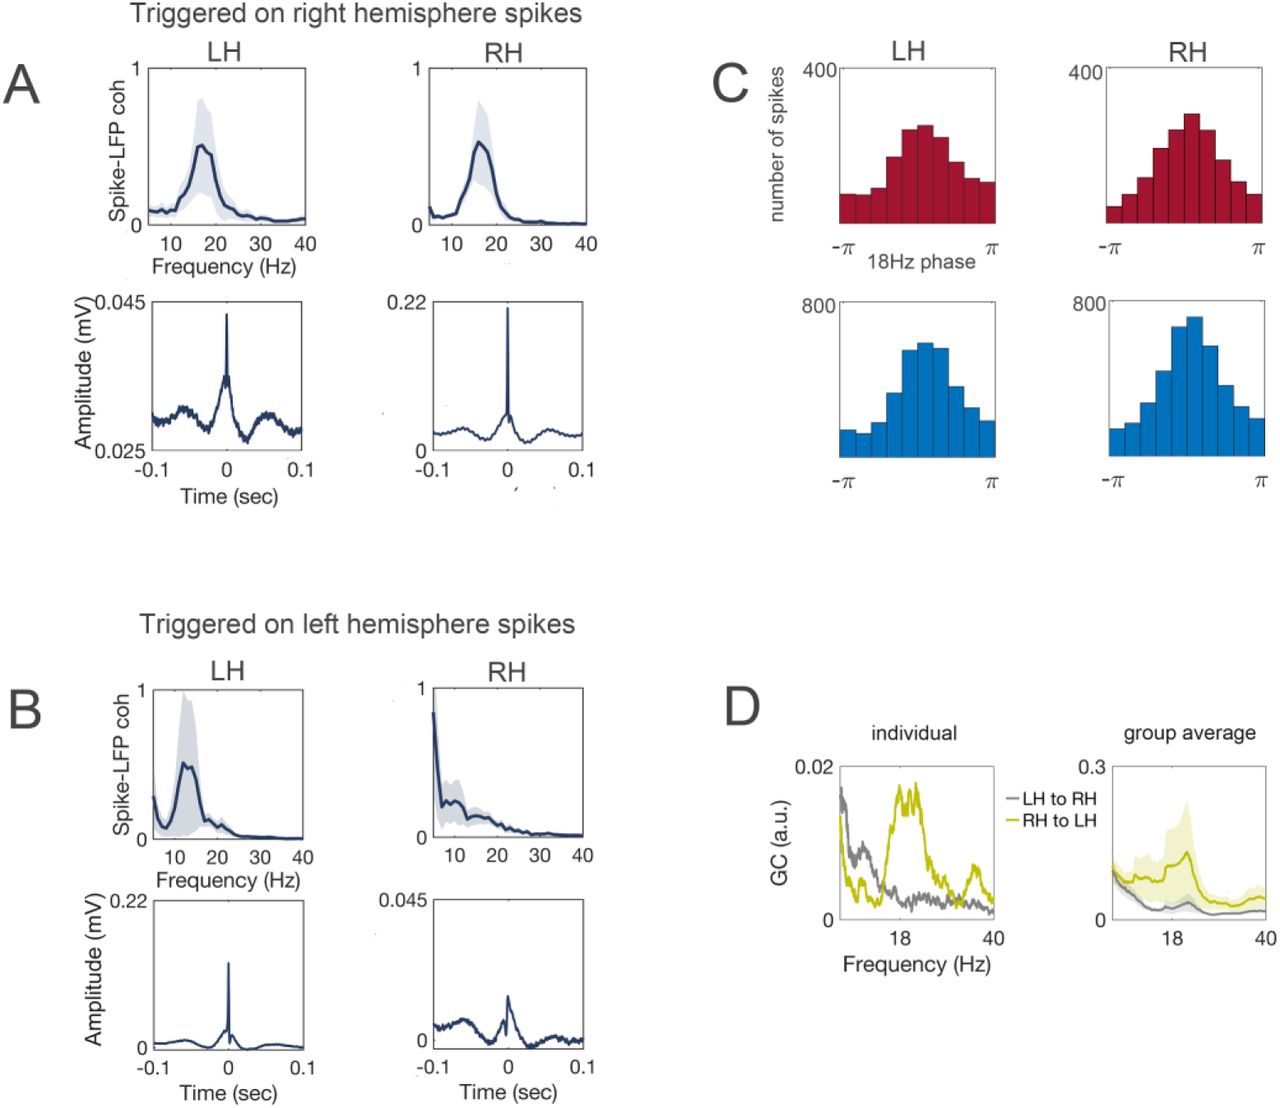
A: Spike-triggered averages computed on right hemisphere spikes. Top-Coherence between spikes and low gamma activity computed over the spike triggered averages indicating a reliable ∼18 Hz peak in the spectrum. Bottom-Spike-triggered averages for the left and right hemisphere respectively. Spike onset is evident at 0 sec. B: Same as A computed on spikes identified in the left hemisphere. N = 5 bees (spikes per bee mean/SD 4441/2415). C: Phase preference of neuronal spikes. Distribution of the spikes within the 18 Hz oscillatory cycle. Top-spikes identified during the odor stimulation interval. Bottom-spikes identified during the pre-stimulus baseline period. X-axis denotes the phase and y-axis the absolute number of identified spikes. D: Granger causality spectra for an individual bee (left) and the group average (N = 10 bees, line represents the mean, the shaded area the SEM, right).
Results and Discussion
A reliable and spontaneous ∼18 xsHz oscillation was observed in both hemispheres (Figure 1A). The amplitude of this oscillatory activity was reduced upon odor stimulation and returned back to baseline shortly after (Figure 1B). This power reduction was accompanied by a stimulus-induced power increase in 20-40 Hz band (low gamma oscillation) (Figure 1C).
In addition, there was an increase of power at frequencies above 40 Hz (high gamma activity) (Figure 1D). This high gamma activity coincided with the stimulus-induced low gamma oscillation. Increases in high gamma power are thought to reflect the increase in the underlying spiking activity of multiple neurons (38, 39). Both, the spontaneous alpha oscillation and the odor-evoked low and high gamma activity required an intact antenna ipsilateral to the recording site (Figure S1), suggesting that both alpha and gamma oscillations are generated in or require input from the ipsilateral antennal lobe (first olfactory brain center and functional analog of the vertebrate olfactory bulb).
The cross-frequency coupling of high gamma activity to the phase of the ongoing alpha oscillation is considered a mechanism of neural communication in cortical circuits (40). Analysis of the cross-frequency coupling between high gamma activity and alpha oscillations confirms that the high gamma amplitude is modulated by the phase of the ongoing alpha oscillation around 18 Hz (Figure 1E). This modulation was stronger in the left as compared to the right hemisphere. Moreover, there was also a cross-frequency coupling between high gamma activity and odor-evoked gamma oscillations (Figure 1F). In contrast to the ongoing activity, this modulation was stronger in the right as compared to the left hemisphere.
In human EEG recordings such cross-frequency coupling between high gamma activity and alpha oscillations is typically interpreted as an indicator of stimulus-or task-induced changes in neuronal spiking that is biased by the phase of the ongoing alpha rhythm. Unlike in human EEG, in honey bees the accesses to both, LFP and neuronal spikes allow the empirical test of this hypothesis. An affirmative confirmation of the coupling between spikes and alpha oscillations is illustrated by the spike-field coherence analysis in Figure 2. A reliable 18 Hz peak in the coherence spectrum was visible in both hemispheres, suggesting that the timing of spikes is coupled to the phase of the ongoing 18 Hz oscillation. The timing of spikes in the right hemisphere was phase-coupled to the 18 Hz oscillation in the left hemisphere (Figure 2A). In contrast, the timing of spikes in the left hemisphere was not phase-coupled to the 18 Hz oscillation in the right hemisphere (Figure 2B). In other words, the direction of information flow quantified by spike transmission was stronger in the direction from the right to left hemisphere.
Neuronal spikes were biased by the 18 Hz phase and displayed a non-uniform phase preference (Figure 2C). Independent of stimulus presentation recurrence of spikes was larger in the peak of the ongoing alpha oscillation.
Our data show that the LFP activity in the mushroom body of the honey bee shares characteristics of the human EEG activity. First, there is a spontaneously generated, ongoing alpha oscillation with a characteristic peak in the spectrum (18 Hz in bees, 10 Hz in humans). Second, the amplitude of the alpha oscillation is reduced upon stimulus presentation. Third, the phase of the spontaneous alpha oscillation biases both high-gamma oscillatory activity and underlying neuronal spiking. The effective connectivity between cortical modules (left and right mushroom bodies) could be established based on both spike occurrence and Granger causality analyses which showed that the timing of spikes in the right hemisphere is controlled by the 18 Hz oscillation in the left hemisphere. This interhemispheric coordination of spike timing could serve to bind bilateral olfactory information into coherent object representations (37) and could for example underlie bees’ ability to retrieve unilaterally learned odor-reward associations via both antennae (36, 41). Given that honey bees show cognitive capacities (e.g., concept learning (42); selective attention (43); map-like spatial memories (44)), our results suggest the honey bee as animal model to examine the functional role of oscillatory brain activity in perception and cognitive function. The ease with which brain oscillations and spikes can be recorded in honey bees opens opportunities inaccessible in human electrophysiology.
Materials and Methods
Animals
Honey bees (Apis mellifera) were used in an in vivo preparation. The head capsule, thorax and abdomen were fixated with dental wax (Dr. Böhme & Schöps Dental GmbH, Deiberit 502) in a metal tube. The basis of the antennae were immobilized with eicosan (Sigma Aldrich). The cuticle of the head capsule between antennae and eyes was removed to get access to the brain. The glands in the head were removed and the head capsule was rinsed with artificial hemolymph (in mM: NaCl 130, KCl 6, Glucose 25, MgCl2 2, CaCl2 7, Sucrose 160, 10 HEPES, pH 6,7, 500 mOsmol). To avoid recording muscular activity we used Philanthotoxin-343 to paralyze the muscles in the head (50 µl, 10-4 Mol in artificial hemolymph; donated by P.N.R. Usherwood). Trachea between the antennal lobes and above the vertical lobes of the mushroom bodies were removed.
Olfactory stimuli
Olfactory stimuli were applied with a computer controlled stimulator (45). The following odorants were used: essential oils of clove, peppermint, orange (all from Apotheke Dahlem-Dorf), and geraniol, citral, isoamyl acetate und 1-heptanol (all from Sigma-Aldrich). Four µl of pure odorants were applied on 1 cm2 filter paper in a 1 ml syringe. The different odorants were applied alternatingly with an interstimulus interval of 10 to 15 seconds. Residual odorants were removed via an exhaust tube (5 cm inner diameter) positioned 3 cm behind the bee.
Data acquisition
Local field potentials (LFP) and extracellular recordings from single neurons were recorded in the center of the mushroom body vertical lobes (depth: 20 – 150 µm). Recordings were performed with artificial hemolymph-filled glass microelectrodes (1/0.58 mm outer/inner diameter) that were pulled with a micropipette puller (P-2000, Sutter Instrument CO) to get a tip resistance of 5 to 10 µOhm and which were then broken to get a tip resistance of 1.3 – 3.5 MOhm. The reference electrode was a chloridized silver wire (0.2 mm diameter). The recording chain consisted of a 10×-amplifier (Simmonds-Amplifier, Cambridge, UK), a 1000×-amplifier and 0.1 – 3.000 Hz band-pass filter (AM503, Tektronix) and an analog-digital converter (1401+, Science Park Cambridge, UK). Experiments were performed at room temperature.
Data analysis
Data analysis was performed with the MATLAB FieldTrip toolbox (46). Spectral analysis was computed for each trial using a Fast Fourier Transformation (FFT) utilizing a multi-taper approach with orthogonal Slepian tapers (47). For frequencies below 40 Hz, 3 orthogonal Slepian tapers were used, resulting in frequency smoothing of ±2 Hz. Time frequency representation of power in sensor space served to confirm load-induced power modulation in the theta and alpha frequency ranges as reported in the literature (see above). Spectrally resolved Granger causality (GC) analysis (48-50) was used to identify the directionality (so-called feedforward vs. feedback influences) of information flow between cortical areas. The first .5 s post stimulus onset was omitted in order to avoid transient responses biasing Granger estimates. A bivariate nonparametric spectral matrix factorization approach (50) was applied in order to estimate GC. This algorithm estimates the spectral density matrix on the basis of Fourier coefficients that were computed using multitapers as described above (3 orthogonal Slepian tapers) with frequency smoothening of ±3 Hz for frequencies of 0 to 100 Hz with 1 Hz spectral resolution. On the basis of the spectral density matrix (i.e., applying spectral factorization), the noise covariance matrix and the transfer function were obtained (50).
Neural spikes were identified from the raw LFP recordings using the peak detection algorithm implemented in MATLAB -findpeaks.m. Spikes were identified as local maxima exceeding 0.1 mV as illustrated in Figure S2. Subsequently the indices of these local maxima were used as triggers in order to re-segment the data ± 1sec around each spike.
Author Contributions
PS performed the experiments. TP analyzed the data. TP and PS wrote the manuscript.
Data availability statement
The data reported in the paper will be archived and documented here: www.fieldtriptoolbox.org.xs
Acknowledgments
We thank Randolf Menzel for discussions initiating the experiments and for his support during data acquisition. We thank Peter N. R. Usherwood for donating Philanthotoxin-343.
References


