

ABSTRACT
Animals socially interact during foraging to share information about the quality and location of food sources. The mechanisms of social information transfer during foraging have been mostly studied at the behavioral level, and its underlying neural mechanisms are largely unknown. The fruit fly Drosophila melanogaster has become a model for studying the neural bases of social information transfer, as fruit flies show a rich repertoire of social behaviors and provide a well-developed genetic toolbox to monitor and manipulate neuronal activity. Social information transfer has already been characterized for fruit flies’ egg laying, mate choice, foraging and aversive associative learning, however the role of social information transfer on associative odor-food learning during foraging are unknown. Here we present an automated foraging assay for groups of walking flies that allows studying the effect of group size on the formation and expression of associative odor-food memories. We found that inter-fly attraction increases with group size and that groups of flies exhibit extended odor-food memory expression, as compared to single or pairs of flies. We discuss possible behavioral and neural mechanisms of this social effect on odor-food memory expression. This study opens up opportunities to investigate how social interactions are relayed in the neural circuitry of learning and memory expression.
INTRODUCTION
Vertebrates often forage in groups to get a more accurate estimate of the location and quality of resources (Giraldeau and Caraco, 2000; Templeton and Giraldeau, 1996; Valone, 1989; Ward and Zahavi, 1973). Insects also convey information about the location and quality about a food source through social interactions. For example, honey bees signal the direction and distance of food locations to other bees (Frisch, 1965), ants complement their individual memory of a route to food using trail pheromones left by scouts (Czaczkes et al., 2011), and stimulus enhancement and local enhancement at the food source improves foraging efficiency in bumble bees (Alem et al., 2016; Avarguès-Weber and Chittka, 2014; Leadbeater and Dawson, 2017; Worden and Papaj, 2005). These social effects on foraging have been mostly studied at the level of behavioral outcome, and the neural mechanisms of how social information transfer improves foraging are still unknown.
The fruit fly, Drosophila melanogaster, is a suitable model organism for studying the effects of social interactions on foraging at both the behavioral and the neuronal level. Fruit flies are gregarious (Lefranc et al., 2001; Navarro and del Solar, 1975) and demonstrate a rich repertoire of social behaviors that encompass communication about internal states (Suh et al., 2004), social information spread during odor avoidance (Ramdya et al., 2014), foraging (Abu et al., 2018; Lihoreau et al., 2016; Tinette et al., 2004) and predator-induced egg-retention (Kacsoh et al., 2015). Moreover, fruit flies socially learn (Battesti et al., 2012a; Danchin et al., 2018; Durisko and Dukas, 2013; Golden and Dukas, 2014; Lin et al., 2015; Mery et al., 2009; Sarin and Dukas, 2009) and they show improved aversive odor memory retrieval when in groups (Chabaud et al., 2009). However, it is still unknown whether social information transfer affects flies’ associative odor-food learning during foraging.
The mechanistic understanding of foraging in fruit flies is unparalleled, both in regard to the neural mechanisms of odor-guided search (Galizia, 2014; Haverkamp et al., 2018; Wilson, 2013) and feeding (Itskov and Ribeiro, 2013), and of associative odor-food learning (Burke et al., 2012; Huetteroth et al., 2015; Liu et al., 2012; Owald and Waddell, 2015; Schwaerzel et al., 2003; Tempel et al., 1983; Thum et al., 2007), making the fruit fly a good model for studying the neural mechanisms of social interactions during foraging.
Here we investigated whether fruit flies socially interact during foraging and whether group size affects associative odor-food memory expression. We developed an automated foraging assay to study classical odor-reward conditioning in single flies and in groups of flies. We conditioned flies to associate an odorant with a sucrose patch, and then tested their associative odor-food memory expression. We found that small groups (3 - 4 flies) and large groups (7 - 8 flies) showed extended odor-food memory expression compared to pairs of flies or single flies, and pairs of flies showed shorter memory expression than single flies. Moreover, flies in small or large groups, but not in pairs, were attracted to each other. These data suggest that flies socially interact during foraging and that these social interactions increase the efficiency of odor-guided food search.
MATERIALS AND METHODS
Animals
Drosophila melanogaster wild type Canton S were raised on a standard food medium (100 mL contain 6.7 g fructose, 2.4 g dry yeast, 0.7 g agar, 2.1 g sugar beet syrup, 0.282 g ethyl paraben and 0.61 ml propionic acid). Flies were raised in a room with normal day light cycle, with an average temperature of 23.5 °C and 32% relative humidity. One to four days old flies were anesthetized with CO2 and female flies were collected. Flies were starved for 2-3 days to motivate them to search for food. Flies were starved in a fly vial with filter paper soaked in water.
Conditioning apparatus
To condition groups of flies, we used an automated rotating platform with four concentric arenas (Figure 1A, B). The arenas were covered with a watch glass (7 cm diameter, 8 mm height in the center) which was coated on the inner side with Sigmacote (Sigma-Aldrich) to prevent flies from walking on the inside of the glass. The floor was made of a Teflon-coated fiberglass fabric (441.33 P, FIBERFLON, Konstanz). Pure odorants (ethyl acetate and 2,3-butanedione, Sigma-Aldrich) were stored in 20 ml vials (Schmidlin Labor and Service). The vials were mounted under the platform and the lid was pierced with a needle (Hypodermic-needle; 0.45 ×25 mm, Sterican), allowing the odorant to diffuse through a hole (diameter: 5 mm) in the platform through the Teflon fabric and into the arena. Each arena had two odorant sources. One odorant was used as sucrose-paired conditioned stimulus (CS+) and the other odorant was used as unpaired conditioned stimulus (CS−). At the location of the CS+, 20 μl of oversaturated sucrose-ethanol solution was pipetted onto the fiberglass fabric and blow-dried for 20 minutes, producing a thin layer of pure sucrose on a round patch with a diameter of 10 mm. The position of the CS+ and CS− were always switched between the conditioning and the test (e.g. if CS+ was at the inside position during conditioning, it was at the outside position during the test, and in half of the experimental runs the CS+ was at the inside position during conditioning, and in the other half at the outside position); each odorant was used equally often as CS+ and CS−. To change the floor between experimental phases, the platform was rotated underneath the arenas; the arenas themselves did not move. The angular rotation speed of the platform was 360°/25 s which corresponded to a speed of 2.6 cm/s in the center of the arena (the distance between center of the table and the center of the arena is 10.25 cm). The conditioning apparatus was placed in an air suction hood in order to remove odorants. All experiments were performed in the dark to eliminate visual stimuli. The arena was back-illuminated with infrared light (850 nm, SOLAROX LED Strip), which is not visible to flies, and experiments were video recorded with an infrared sensitive camera (infrared Camera Module v2, Pi NoiR, connected to a Raspberry Pi 3, Model B V1.2) at 5 frames/s. The rotating motor was controlled via TTL pulses through the Raspberry Pi. The rotation of the table and the video recordings were controlled with custom-written software in Python (Stefanie Neupert).

(A) Conditioning assay for conditioning and testing four groups of flies in parallel.
(B) Conditioning assay viewed from above through the tracking camera. The locations of the CS+ and CS− in each arena are indicated. The arcs indicate the position of the arena in different experimental phases. Full lines outline the acclimatization phase, dotted lines outline the conditioning phase, and dashed lines outline the pause phase before the test.
(C) Same as (B) but with examples of individual fly trajectories during the test overlaid. Trajectories are shown for a single fly (top left), a pair of flies (top right), a group of 4 flies (small group, bottom right) and a group of 8 flies (large group, bottom left).
(D) Approach probability for the odorant (CS+)-sucrose patch for the single flies (red), the pairs (blue), the small group (yellow) and the large group (pink) during conditioning. Each minute bin shows the mean of the binary approach scores across all experimental runs (N= 30 experimental runs). The dashed line represents the approach probability of 0.5 (chance).
(E) Visit probability maps for each group size (columns) for the entire duration of the recording, the first minute of recording and the second minute of recording (rows). Each bin shows the mean binary value across all experimental runs. N = 30 experimental runs for all groups; single flies: N = 30 individuals; pairs: N = 60 individuals; small group: N = 118 individuals; large group: N = 229 individuals.
Odor-food conditioning
All experiments were done between 10:00 and 12:00 or after 15:00 during periods when flies show higher foraging activity (Breugel et al., 2017). Each experimental run contained 4 differently sized groups (“single”, “pair”, “small group”, “large group”), and the positions of the 4 arenas used for the 4 differently sized groups were balanced across experimental runs.
One experimental run consisted of four phases:
Acclimatization (Figure 1B, solid arcs)
Flies were sucked out from the starvation vials using a tube aspirator and placed into an arena that had no odorant source and were allowed to acclimatize for 10 minutes.
Conditioning (Figure 1B, dotted arcs)
The floor was rotated counterclockwise by 22.5° and the CS+ paired with sucrose and the CS− without sucrose were presented for 7 minutes.
Pause (Figure 1B, dashed arcs)
The floor was rotated by 22.5° and replaced by a new floor without odorants or sucrose. The pause lasted for 5 seconds.
Test
The floor was rotated by 22.5° and replaced by a floor which had the CS+ and CS− but without sucrose. CS+ and CS− positions were switched from conditioning. The test phase lasted for 7 minutes.
Videos were recorded during the conditioning and test. After each experimental run, all flies were discarded and the Teflon fabric floor was rinsed with hot water and soap to remove the odorants and the sucrose patch.
Fly tracking
Video recordings were analyzed using the software Fiji (ImageJ 1.51s Wayne Rasband NIH, USA). We removed the first 30 frames due to compression artifacts and converted the video to grayscale. Then we did a Z projection to get the maximum intensity projection over the whole video, and calculated the difference per frame between the maximum intensity projection and the original video. This gave us a clear image of flies moving around the arena for tracking. We used this output to track flies using the plugin TrackMate (Version: 3.5.3, Tinevez et al., (2017)). We used a Downsample LoG detector to identify flies (blob diameter = 13 pixels, downsampling = 3, threshold = 6-8). To generate the tracks, we used the Simple LAP Tracker, with the following parameters: linking distance = 150 pixels, max gap closing = 150 pixels and maximal frame gap = 3 frames. For the conditioning data, we only extracted the x and y coordinates of each fly per frame. For the test data, we extracted the x and y coordinates per frame as well as the identity of the fly throughout the recording. We inspected all tracking results visually and corrected the tracks manually to connect the missing links and afterwards we extracted the x and y coordinates for the analysis.
Data analysis
Normalizing arenas for comparison
For both the conditioning and the test datasets, we centralized each arena so that the center point of the circular arena was at (0, 0). The center point was determined by taking the midpoint between the CS+ and CS− locations; the x and y coordinates of the CS+ and CS− were recorded manually. We then converted each Cartesian coordinate to polar coordinates, in order to rotate each arena so that the CS+ location was at the top of the arena and the CS− was at the bottom. We took the distance of the CS+ to the center as a reference radius of 1, and normalized all coordinates to this radius. We then filtered out any points that had a radius equal to or greater than 1.3 to remove tracking errors. Note that for the conditioning dataset, only the x and y coordinates of a fly per frame were recorded. For the test dataset, the x and y coordinates per frame were recorded, but also the identity of the fly across frames. Thus the analysis for the two datasets differs slightly.
Visit probability maps
Visit probability maps were generated only for the test dataset. For every individual fly, we divided the arena into 20 × 20 pixel bins. For each frame, we gave the pixel bin that contained the coordinate of the fly a score of 1, and gave all of the other bins a score of 0. We summed the scores of each pixel bin over all frames and then normalized by the track length for each individual. For each group size, we then took the mean of each pixel bin over all individual fly tracks. We used the same analysis for the time-binned visit probability maps by looking only at the frames that occurred during the time bin.
Calculating the distance of individual flies to the CS+ and CS−
We calculated the distance of each fly to the CS+ and to the CS− in every frame using:

Where x and y are the Cartesian coordinates of the fly, and x0 and y0 are the Cartesian coordinates of either the CS+ or the CS−.
Approach probability
For the conditioning data, the coordinates of the flies were tracked for each frame. For every frame of the experiment, we scored each point: if the fly was closer to the CS+ than the CS−, it was given a score of 1, otherwise it was given a score of 0. We then divided the data into one-minute time bins. For every experiment we calculated the number of ones and zeros in each time bin; if there were more ones than zeros, the time bin was given a score of 1 for that experiment, otherwise it was given a score of 0. We then took the mean for each time bin over all experimental runs.
For the test data, we used a similar method, however since we had the fly identities over the whole video, we calculated the approach probability using the individual fly tracks. This allowed us to calculate the approach score for each individual fly. A fly received a score of 1 when she spent more time closer to the CS+ than the CS− and a 0 when she spent more time closer to the CS− than to the CS+ during the experimental run. If more flies in a particular experimental run scored a 1 than scored a 0, then the experimental run was scored a 1, otherwise it was scored a 0. Moreover, we divided each track into one-minute time bins and for each experimental run each time was scored 1 (flies were closer to the CS+) or 0 (flies were closer to the CS−).
Latency to the CS+ and the CS−
For the test dataset, we identified for each individual the first frame (latency) that the individual was 0.5 cm or closer to the center of the CS+ or CS−. We firstly took the mean latency to the CS+ or CS− across all flies in one experimental run, and then took the mean across the 30 experimental runs for each group size.
Calculating the distance between flies
For the test dataset, we used the rotated Cartesian coordinates to calculate the Euclidean distance between every fly in each frame of the experiment. We divided the distances into bins of 5 mm and counted the occurrences of each distance per experimental run.
Simulating distances between flies due to chance
For the test dataset, we selected flies according to their group size, and randomly sampled entire fly tracks from different experimental runs of the same experiment. We simulated as many experimental runs as there were real experimental runs, and we also simulated as many flies as were in each experimental run. We then overlaid these tracks and calculated the Euclidean distance between flies for the simulated experiments as we did for the real experiments.
Calculating encounters between flies
We defined an encounter as the center of one fly being maximum two fly lengths (5 mm) away from the center of another fly. We calculated the Euclidean distance between all flies as before. We selected the distances that were less than or equal to 5 mm (the encounter distances). Since we had the identity of every fly per experimental run, we could calculate the number of encounters for every fly and the length of these encounters.
For the mean encounter number per fly per experimental run, we calculated the total number of encounters for one experimental run, multiplied it by two as there were two flies involved in each encounter, and then divided it by the number of flies in the arena. For the mean encounter length per experimental run, we summed the length of all encounters and divided by the total number of encounters per experimental run. We repeated this analysis for the simulated data.
Statistical analysis
For all data analysis, R version 3.5.0 was used (R Core Team, 2018). All statistics were performed using Bayesian data analysis, based on Korner-Nievergelt et al., (2015).
To investigate the effect of group size on conditioned approach probability for the CS+, we used a binomial generalized linear model (GLM), with conditioned approach probability as the binary response variable (1 = approach, 0 = no approach). We used the logistic regression (logit) link function. The group size (“single”, “pair”, “small group” and “large group”) was used as the explanatory variable. We used an improper prior distribution (flat prior) and simulated 100 000 values from the posterior distribution of the model parameters using the function “sim” from the package “arm”. The means of the simulated values from the posterior distributions of the model parameters were used as estimates, and the 2.5 % and 97.5 % quantiles as the lower and upper limits of the 95 % credible intervals. We used this GLM to compare the conditioned approach probability of each group size against chance. For each group size, we calculated the proportion of simulated values from the posterior distribution that were larger than 0.5. A value of 0.5 indicates that flies spend equal time in the two halves of the arena, whereas a value of 1 indicates that flies spent all of the time in the half of the arena containing the CS+, and a value of 0 indicates that flies spent all of the time in the half of the arena containing the CS−. If the proportion of simulated values was significantly greater than 0.5, we determined that flies spent more time in the half of the arena containing the CS+ than predicted by chance (represented by filled circles in plots). To test for differences between conditioned approach probabilities for different group sizes, we calculated the proportion of simulated values from the posterior distribution that were larger for one group compared to another group. We declared an effect to be significant if the proportion was greater than 0.95 (*). Proportions greater than 0.99 are marked “**” and greater than 0.999 marked “***”. We performed this analysis for the whole recording: for the different time bins, we compared the conditioned approach probability of the different group sizes within a single time bin, not between them.
To test whether the latency to reach the CS+ or CS− depends on group size, we used a linear model (LM). The latency to the CS+ or to the CS− was the response variable, and the group size was used as the explanatory variables. We used the same methodology as previously used in the GLM to simulate values from the posterior distribution and generate the means and the 95 % credible intervals. To test for differences, we calculated the proportion of draws from the posterior distribution for which the mean of each draw was smaller in the experimental dataset than the mean of each draw of the simulated dataset. We declared an effect to be significant if the proportion was greater than 0.95.
To investigate whether grouped flies differ in the number of their inter-fly encounters from random (simulated data), we used an LM for each distance bin. The number of occurrences of that distance was the response variable, and the type of data (experimental or simulated data) was used as the explanatory variable. We used the same method as specified above to test for differences.
To investigate whether the encounter number and lengths were different to random (simulated data), we used an LM with either encounter number or encounter length as the response variable, and the type of data (experimental or simulated data) as the explanatory variables. We used the same method as specified above to test for differences.
To determine whether the mean encounter number per fly differed between group sizes, we randomly assigned pairs of experimental and simulated encounter numbers from different experimental runs for each group size (Figure 2F). For each pair, we then subtracted the simulated encounter number value from the real encounter number value (difference between encounters). This allowed us to compare between group sizes as by removing the simulated value, we remove the number of encounters that could be due to chance, which is correlated with group size. To test for differences between group sizes, we used an LM. The response variable was the “difference between encounters”. The explanatory variable was the different group size (“pair”, “small group” and “large group”). The large group was used as the reference level. We used the same method as specified above to draw inferences about the differences between the large group and the other two group sizes.
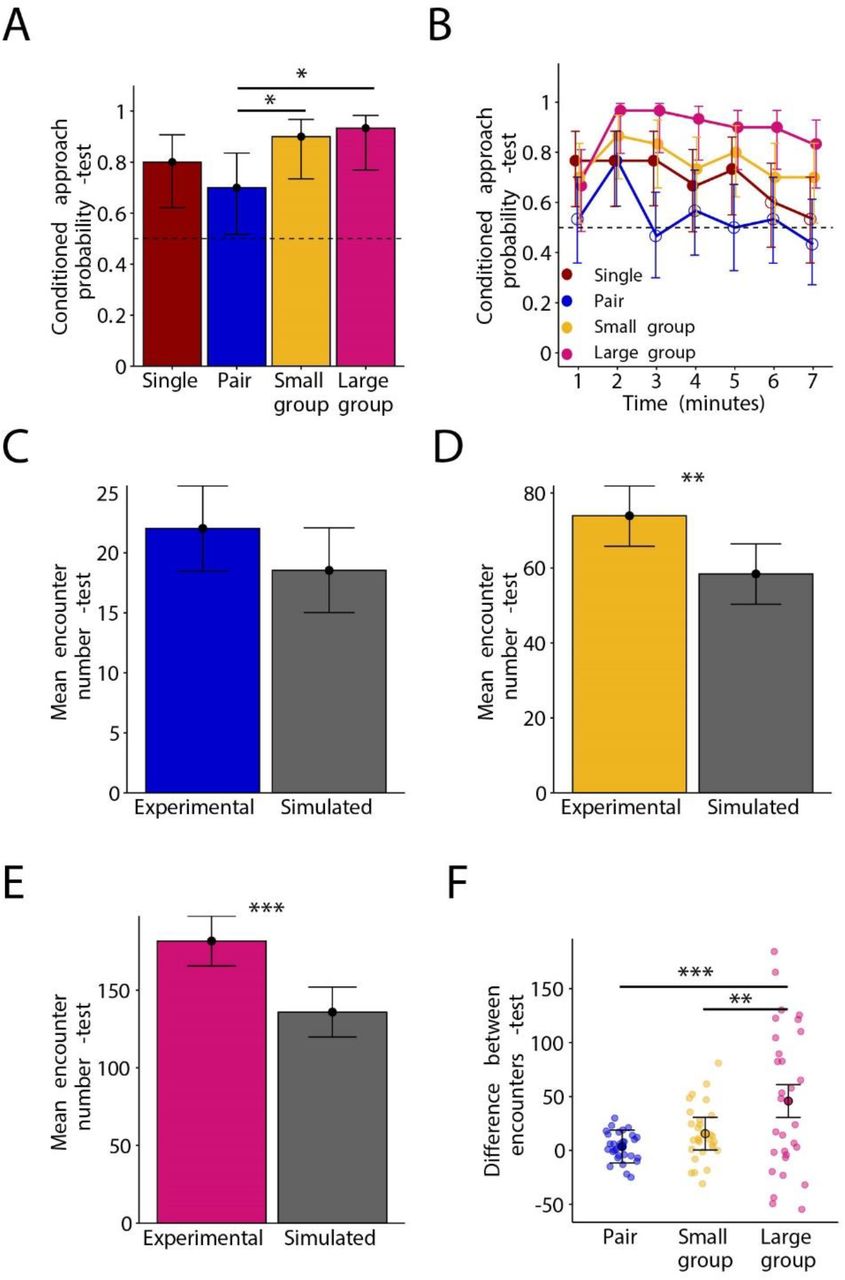
(A) Conditioned approach probability for the CS+ for the single fly group (red), the pair group (blue) the small group (yellow) and the large group (pink) during the test. Bars represent the mean binary score across all experimental runs. Whiskers represent the 95 % credible intervals. The dashed line indicates the conditioned approach probability due to chance (0.5). Stars represent significant differences in conditioned approach probability between groups.
(B) Conditioned approach probability for the CS+ over one-minute time bins during the test. Colors, dashed line and whiskers are the same as in (A). The points represent the mean binary score across all experimental runs within a time bin. Filled points are conditioned approach probabilities that are significantly different to chance, empty points are not significantly different to chance. For statistical comparisons between groups, see Table S1.
(C) Mean inter-fly encounter number per fly per experimental run for the pair (blue) and the simulated pair (grey). Bars represent the mean across experimental runs. Vertical lines represent the 95 % credible intervals.
(D) Same as (C) for the small group (yellow) and the simulated small group (grey).
(E) Same as (C) for the large group (pink) and the simulated large group (grey). Stars represent significant differences in mean encounter length between the real and simulated group (**: p(experimental > simulated) > 0.99).
(F) Paired differences between mean encounter numbers across experimental runs. Stars represent significant differences between groups (*: p(large group > small group) > 0.95, **: p(large group > pair) > 0.999). Black circles represent the mean difference in encounter number between experimental runs. Colors and whiskers are the same as in A.
RESULTS
To investigate whether group size affects associative odor-food memory in flies, we developed an automated conditioning assay to condition four groups of flies simultaneously (Figure 1A, B). The learning assay consisted of a computer-controlled rotating table platform with four concentric arenas. This design allowed us to transfer flies from conditioning to the test without anesthesia and with minimal mechanical disturbance, which can alter fruit flies’ behavior (Barron, 2000; Bartholomew et al., 2015; Trannoy et al., 2015). We compared four different sized groups of flies: one fly (single), two flies (pair), three or four flies (small group) and seven or eight flies (large group) (Figure 1C). Both the training phase and test phase lasted for 7 minutes. During the 7-minutes long conditioning, two odorants (2,3-butanedione and ethyl acetate) were presented at opposite sides of the arena; one odorant (conditioned stimulus, CS+) was paired with dried sucrose and the other odorant was not (CS−). During conditioning, flies were allowed to forage around the arena and find the food and odorant source.
Walking flies aggregate on the odorant-sucrose patch during conditioning and learn to associate the odorant with sucrose
Flies of all group sizes showed a high probability to approach the odorant (CS+)-sucrose patch, implying that they were feeding on the sucrose (mean approach probability over the last minute-single, small group and large group: >0.999, pair: 0.97) (Figure 1D). For a given experimental run the approach probability was 1 if the flies spent more time closer to the CS+ than to the CS− and 0 if the fly spent more time closer to the CS− than to the CS+. We did this for one-minute time bins, and took the mean for each bin across experimental runs to get a mean approach probability per group size.
Flies were transferred from the conditioning to the test by rotating the platform (Figure 1B). In between conditioning and test there was a pause, where the platform was rotated to a neutral segment where there were no odorants or sucrose present. The pause lasted 5 s, and then platform was rotated to the test segment. During the test, the positions of the CS+ and the CS− were switched and there was no sucrose, thus flies could not rely on remembering the location of the sucrose patch (Kim and Dickinson, 2017) and had to follow the olfactory CS+ to search for the expected food. To visualize conditioned approach to the CS+, we projected the flies’ trajectories on a plane and calculated the probability across flies to visit a particular pixel bin (Figure 1E). Throughout conditioning, flies of all group sizes showed highest visit probabilities to areas around the CS+. The increased visit probabilities around the CS+ persisted over the entire 7 minutes of the test, confirming that flies learned to associate the CS+ with food.
Flies conditioned and tested in groups exhibit extended associative odor-food memory compared to flies conditioned alone or in pairs
We next asked whether group size affects the expression of associative odor-food memory during the test and determined the conditioned approach probability for the CS+ (Figure 2A). We calculated the conditioned approach probability for the CS+ by the following steps: 1) If a fly spent more time near the CS+ than the CS−, it scored a one, otherwise it scored a zero. 2) If an experimental run had more flies scored with one than zero, the experimental run itself was scored as 1, otherwise zero. 3) We took the mean across experimental runs to get a conditioned approach probability per group size. During the test, all group sizes showed a conditioned approach probability for the CS+ that was significantly higher than chance (p(large group > 0.5) > 0.999, p(small group > 0.5) > 0.999, p(pair > 0.5) = 0.983, p(single > 0.5) > 0.999), showing that they had formed an associative odor-food memory (Figure 2A). Both the large group and the small group showed significantly higher conditioned approach probabilities than the pair group (p(large group > pair) = 0.983, p(small group > pair) = 0.968), however there were no differences between any of the other group sizes (see Table S1). There was no differences between group sizes for how quickly the flies approached the CS+ (Figure S1A), however the pair approached the CS− significantly faster than the single fly or the small group (p(single > pair) = 0.982, p(small group > pair) = 0.981) (Figure S1B).
To investigate the time course of memory expression, we calculated the conditioned approach probability over one-minute time bins (Figure 2B). During the first minute of the test, the single fly showed a higher conditioned approach probability than the pair (p(pair > single) = 0.031). Between the 2nd to 7th minutes, the large group showed higher conditioned approach probabilities than both the single fly group and the pair group throughout most other bins tested (Table S1). The large group also showed higher conditioned approach probability than the small group during the 4th minute and the 6th minute. The pair group showed the lowest conditioned approach probability which was only significantly different to chance during the second minute (2nd minute: p(pair > 0.5) = 0.997), and during the 3rd to 7th minutes, the paired group showed a significant lower approach probability than the large, small and single fly groups (Table S1, S2). These results suggest that flies conditioned and tested in a large group express a longer associative odor-food memory than flies conditioned and tested in smaller groups or single flies, and flies conditioned and tested in pairs express shorter associative odor-food memory than single flies or flies in groups.
Flies tested in groups – but not in pairs – exhibit more inter-fly encounters than random
We next asked whether flies socially interact, which could potentially allow them to share information with each other about the location of the predicted food source and thus could explain the extended associative memory of the large group. To assess whether group size affects the frequency of social interactions we measured the number of inter-fly distances and compared it with the number of expected random distances. We calculated the distances between all flies conditioned in groups in each video frame during conditioning to see if they approached each other. To determine whether these distance distributions could be explained merely due to flies randomly encountering each other in the arena, we simulated 30 new experimental runs by randomly sampling fly locations from all experimental runs for each video frame. We then calculated the distances between these simulated groups of flies in each video frame (Figure S2A, Table S3). For the large group there were more short inter-fly distances (0-5 and 5-10 mm) than for the simulated group.
We chose a distance of 5 mm between fly centers as a threshold for inter-fly encounters where flies could potentially socially interact. Flies in the small and large group made significantly more encounters (approached each other by 5 mm or less) than the simulated groups of flies, but not the pair (p(large group > simulated large group) > 0.999, p(small group > simulated small group) = 0.996, p(pair > simulated pair) = 0.917) (Figure 2C-E).
To compare encounter number across group sizes, we needed to correct for trivial differences in encounters that are just due to differences in the group sizes (in larger groups there is a higher chance for random inter-fly encounters). We corrected for these trivial differences in encounter number by the following procedure: We randomly took an experimental run from the experimental and simulated datasets and subtracted the number of encounters between the two experimental runs (Figure 2F). By subtracting the number of encounters in the simulated runs, we removed the number of encounters per experimental run that could be due to random encounters. The encounter number was significantly higher for the large group compared to the small group and the pair (p(large group > pair) > 0.999, p(large group > small group) = 0.996). There were no differences in encounter length between any group size and their simulated groups (Figure S2B).
The increased number of encounters in the larger group indicates that flies are more attracted to each other when they are in large groups than when they are in small groups or pairs. More encounters allow more opportunities for social interactions between flies, which in turn could underlie the longer associative memory expression of the large group as compared to smaller groups or single flies.
DISCUSSION
We developed an automated conditioning assay for walking fruit flies that allows analyzing the behavior of individual flies during foraging. We used this assay to investigate how social interactions affect odor-food learning in single flies and in groups of flies. Flies in groups showed extended expression of the associative odor-food memory as compared to single flies or pairs of flies. Moreover, flies in larger groups were more attracted to each other than flies in smaller groups. These data suggest that foraging in groups of more than two flies facilitates social information transfer about the quality of a food source (during odor-food learning) or about the location of the predicted food source (during odor-guided food search).
Social information transfer during foraging
Fruit flies accumulate on fermenting fruit which they find by following the odorants released by fermenting fruit (Becher et al., 2012; Kellogg et al., 1962; Semmelhack and Wang, 2009) and by following aggregation pheromones released by males (Bartelt et al., 1985; Lin et al., 2015; Mercier et al., 2018) and females (Lebreton et al., 2017). In the group, fruit flies transfer information to other flies about their internal state, such as stress (Suh et al., 2004) and about the location and quality of resources during mate choice (Danchin et al., 2018; Mery et al., 2009), egg laying (Battesti et al., 2012b; Durisko and Dukas, 2013; Lin et al., 2015; Sarin and Dukas, 2009), and foraging (Lihoreau et al., 2016; Tinette et al., 2004). During foraging, primer flies search for the most favorable food patch and other flies aggregate at those food patches after socially interacting with the primer flies (Tinette et al., 2004), thus through local enhancement of food patches, the entire group of flies appears to benefit from the transmitted information from primer flies.
Since fruit flies forage, lay eggs and mate during aggregation, it is plausible that they have adapted to transmit information to each other about the environment through social interactions. Our finding of extended expression of associative odor-food memories in groups together with the positive correlation between group size and inter-fly attraction suggests that associative odor-food learning or memory expression also benefits from social information transfer during aggregation. The positive correlation between group size and inter-fly attraction that we found is in line with a previous study where the number of inter-fly attraction was higher in larger than in smaller groups (20-40 versus 10 flies) (Simon et al., 2012). To our knowledge, such an increase in inter-animal attraction with increasing group size has not yet been reported in vertebrates (Miller and Stephen, 1966).
Social effects on odor-food learning
While we found extended memory expression in larger groups, we found shorter memory expression in pairs of flies as compared to single flies or groups of 4 or 8 flies. This finding was surprising, and we have no good explanation for this phenomenon. We will therefore constrain our discussion the social effects on odor-food learning and memory in groups larger than two.
The extended expression of associative odor-food memory in groups of flies could be a result of social information transfer during the formation of the odor-food memory (during conditioning) or during the retrieval of the odor-food memory (during the memory test). Since our experiments were performed in the dark, flies could have transferred information socially via olfactory stimuli (Jallon, 1984; Keesey et al., 2016; Lebreton et al., 2017; Lin et al., 2015), gustatory stimuli (Schneider et al., 2012) sound (Tauber and Eberl, 2003), substrate-borne vibration (Fabre et al., 2012) and touch (Ramdya et al., 2014), but not via visual cues (Danchin et al., 2018; Ferreira and Moita, 2019; Golden and Dukas, 2014; Mery et al., 2009; Sarin and Dukas, 2009).
During conditioning, the presence of other flies at the sucrose patch could increase the reinforcing strength of the sucrose since the presence of other flies indicates that the food patch is good. Indeed, flies prefer food sources with other flies present over food sources without any flies (Lihoreau et al., 2016; Tinette et al., 2004). Alternatively, the presence of other flies at the sucrose patch may be an additional appetitive reinforcing stimulus. The role of conspecifics as a positive reinforcer has been previously demonstrated in honey bees, where antennal touching of a nestmate acts as positive reinforcer during odor conditioning (Cholé et al., 2019). The fact that fruit flies are attracted to each other (Lefranc et al., 2001; Simon et al., 2012; Tinette et al., 2004) makes it plausible to assume that flies could also act as an additional positive reinforcer at the sucrose patch.
The reinforcing function of other flies could be mediated by dopaminergic neurons, because dopaminergic neurons mediate the reinforcing function of sucrose (Liu et al., 2012) and because dopamine itself has an effect on the sociality of flies: inter-fly attraction decreases in flies that have a deficiency in dopamine released from neurons and hypodermal cells (Fernandez et al., 2017).
Social effects on odor-food memory expression
Besides there being a learning effect, the extended odor-food memory expression could be a memory retrieval effect. Memory retrieval could be affected by the social interactions during the memory test, as flies that had learned the association between CS+ and sucrose could transfer information about the location of the predicted sucrose patch to flies that have failed to learn. Information transfer from experienced to naïve flies can affect group level behavior during odor avoidance (Ramdya et al., 2014), aversive memory retrieval (Chabaud et al., 2009), mate choice (Danchin et al., 2018; Mery et al., 2009), oviposition site choice (Battesti et al., 2012b; Sarin and Dukas, 2009) and predator-induced egg-retention (Kacsoh et al., 2015). Moreover, a theoretical study predicted that social interactions can increase performance during odor-guided foraging (Torney et al., 2009).
Alternatively, flies that located the CS+ first during the test could serve as an attractive reinforcing stimulus (see discussion above and (Lihoreau et al., 2016; Tinette et al., 2004)), thus appetitive learning of the CS+ could continue throughout the test. This ongoing appetitive learning of the CS+ during the test would appear as extended associative memory expression in our study.
Another possible explanation for the extended memory expression could be reduced memory extinction due to social interaction at the CS+. Memories can be extinguished when the CS+ is presented without reinforcement (Lagasse et al., 2009; Schwaerzel et al., 2002), which is effectively what occurs throughout the test in our study. In flies, extinction of odor-sucrose memories is mediated by dopaminergic neurons that encode reinforcement during aversive odor learning (Felsenberg et al., 2017): lack of reward during CS+ induced memory retrieval activates those dopaminergic neurons, and this activation counteracts the associative odor-food memory. The presence of other flies at the CS+ could provide an appetitive stimulus and thereby prevent the activation of these extinction mediating dopaminergic neurons.
Technical considerations and outlook
We analyzed the walking behavior of individual flies during the memory test, but not during the conditioning because we could not separate flies from each other when they clustered at the sucrose patch due to a lack of spatial resolution. By using cameras with higher spatial resolution, this assay can be extended to a high-throughput assay for multiple parallel fly groups that would allow automatic tracking of all individuals, classifying of patterns of pairwise and higher-order interactions between individuals, as well as stereotyped behaviors in individuals (Berman et al., 2016; Branson et al., 2009). This assay could help reveal external factors (e.g., fly density, the ratio of informed to uninformed flies) and internal factors (e.g., metabolic, genetic, or circadian states) that influence learning in social contexts, and it would also allow studying the neural basis of social effects on foraging, by disentangling sensory processing and memory formation. To identify the sensory bases of information transmission between flies, one could test the effect of temporarily perturbing their ability to smell, see and mechanosense by expressing a temperature-sensitive switch for synaptic transmission in defined neuron populations (Kitamoto, 2001). Likewise, neuronal perturbation experiments would help identifying the neurons that encode the valence of social information and reveal how these neurons integrate with the neurons known to encode the hedonic and caloric value of food (Huetteroth et al., 2015). Moreover, to investigate whether information transmission during foraging is affected by the fly’s predisposition to forage, one could use the two naturally occurring foraging gene Drosophila mutants. “Rovers” move more during foraging and demonstrate improved short term memory, whereas “sitters” move less and show an improved long term memory (Mery et al., 2007; Osborne et al., 1997). Since both foraging and aversive memory expression are affected by social context (Kohn et al., 2013), experiments using these morphs would help to assess whether improved memory expression or learning during foraging in groups is genetically predetermined.
CONFLICT OF INTEREST
The authors declare that the research was conducted in the absence of any commercial or financial relationships that could be construed as a potential conflict of interest.
AUTHOR CONTRIBUTIONS
PS conceptualized and designed the study. CT performed the data collection. CT and YM performed the pilot experiments. AS, CT and YM prepared the video data for analysis. AS performed the statistical analysis. AS, PS and YM wrote the manuscript. PS supervised the study.
ACKNOWLEDGEMENTS
We thank C. Giovanni Galizia for discussions initiating this research, Stefanie Neupert for programming the acquisition software and comments on the manuscript, Jana Hörsch for contributing to pilot experiments and comments on the manuscript, Charles Ellen for comments on the manuscript, FIBERFLON (Konstanz) for donating Teflon-coated fiberglass fabric.
REFERENCES


