

Abstract
Treatment strategies for infectious disease often aim to rapidly clear the pathogen population in hopes of minimizing the potential for antibiotic resistance. However, a number of recent studies highlight the potential of alternative strategies that attempt to inhibit the growth of resistant pathogens by maintaining a competing population of drug-sensitive cells. Unfortunately, to date there is little direct experimental evidence that drug sensitive cells can be leveraged to enhance antibiotic containment strategies. In this work, we combine in vitro experiments in computer-controlled bioreactors with simple mathematical models to show that drug-sensitive cells can enhance our ability to control bacterial populations with antibiotics. To do so, we measured the “escape time” required for drug-resistant E. coli populations to eclipse a threshold density maintained by adaptive antibiotic dosing. While populations containing only resistant cells rapidly escape containment, we found that matched populations with sensitive cells added could be contained for significantly longer. The increase in escape time occurs only when the threshold density–the acceptable bacterial burden–is sufficiently high, an effect that mathematical models attribute to increased competition. The results provide direct experimental evidence linking the presence of sensitive cells to improved control of microbial populations.
Introduction
Our ability to successfully treat disease is often determined by our capacity to manage drug resistance [1–6]. To minimize the risk of resistance evolution, treatment is often aimed at rapidly reducing – and hopefully clearing – the pathogen population [7–17]. This principle dominates our approach to both infectious disease and cancer, where treatment is often aimed at achieving rapid and dramatic reductions in tumor burden [18–29]. Unfortunately, the increasing number of treatment failures associated with drug resistance suggests that this aggressive approach may not be optimal in all cases [1, 4–6].
In fact, recent work suggests that aggressive treatment strategies can hasten the emergence and spread of resistance [30–41]. In addition, numerous studies, both ex-perimental and theoretical, provide evidence that less aggressive treatment strategies may be called for under some conditions [42–50], while several clinical trials have also demonstrated advantages of lower dose therapies [50–58]. The most frequently cited advantages of less aggressive therapies are reduced off-target selection for resistance and fewer adverse effects for the patient. However, the less aggressive approach may also provide benefits by directly improving our ability to control evolving pathogen populations [34, 59]. More specifically, because drug-sensitive and drug-resistant cells compete for resources, aggressive treatments that eliminate sensitive cells may remove competitive barriers that slow the growth of resistant cells (Figure 1) [60].

A. Aggressive treatment uses high drug concentrations (lightning flashes), which eliminates sensitive cells (blue) but may fail when resistant cells (red) emerge and the population exceeds the failure threshold (“acceptable burden”, light blue circle). B. Containment strategies attempt to maintain the population just below the failure threshold by using lower drug concentrations, leveraging competition between sensitive (blue) and emergent resistant (red) cells to potentially prolong time to failure. C. Schematic of potential feedback between growth processes in mixed populations. Drug (lightning flash) inhibits sensitive cells (blue), which in turn inhibit resistant cells (red) through competition but may also contribute to the resistant population via mutation.
Maintaining a sensitive population during treatment comes with both a cost and a benefit [49]. Drug sensitive cells are costly because they are a source for de novo resistance, yet they may also be beneficial because they can competitively suppress growth of the resistant population. In theory, the benefits of competition dominate under some conditions–for example, when sufficiently high pathogen densities can be tolerated. In these cases, treatments designed to maintain a sensitive population should outperform aggressive therapies. Although there is increasing interest in the idea of using sensitive cells to manage resistance, experimental support for this idea remains scarce and is often indirect – involving a comparison of different treatment strategies as opposed to comparing the presence versus absence of sensitive cells [35, 43–48, 50, 61–63].
In this work, we combine in-vitro experiments in computer-controlled bioreactors with simple mathematical models to show that drug-sensitive cells can enhance our ability to control bacterial populations with antibiotics. Specifically, we measured the “escape time” required for different E. coli populations to eclipse a threshold density when exposed to adaptive drug dosing designed to maintain a constant cell density using a minimal amount of drug. Surprisingly, we found that adding sensitive cells led to longer escapes times. The increased escape time in mixed populations (resistant populations with sensitive cells added) occurs only when cells can be maintained at a sufficiently high total density–that is, when the “acceptable bacterial burden” (here called Pmax) is large enough to allow for competition between cells. The results provide, to our knowledge, the first direct experimental evidence linking the presence of sensitive cells to improved control of microbial populations. The findings are particularly striking because they occur in well mixed populations with a continual renewal of resources–conditions not typically associated with strong competition–indicating that similar control schemes may be broadly applicable.
Results
Our primary goal is to investigate whether drug sensitive populations of E.coli can suppress the growth of drug resistant E.coli in the presence of antibiotics. To do so, we grew bacterial populations in well mixed bioreactors where environmental conditions, including drug concentration and nutrient levels, can be modulated using a series of computer-controlled peristaltic pumps. Population size is measured using light scattering (optical density, OD), and drug concentration can be adjusted in real time in response to population dynamics or predetermined protocols (Figure S1).
As a model system, we chose E. coli strains REL606 and REL607, which are well-characterized ancestral strains used in the celebrated long term evolution experiment in E. coli [64]. The strains differ by a single point mutation in araA which serves as a neutral marker for competition experiments; REL 606 (REL 607) appears red (pink) when grown on tetrazolium arabinose (TA) plates. In the absence of environmental input (i.e. no influx or outflow), these E. coli exhibit standard logistic growth in the bioreactors (Figure S2), suggesting that competition does occur at high cell densities. Despite this implicit evidence of competition within a single population, it is not clear whether competition significantly impacts resistance dynamics in mixed populations or in the presence of antibiotics.
To answer this question, we first characterized the response of both drug-sensitive and drug-resistant E.coli isolates to doxycyline, a frequently used protein synthesis inhibitor. To isolate a doxycycline-resistant mutant, we exposed populations of REL606 strains to increasing concentrations of doxycyline over several days using standard laboratory evolution with daily dilutions and isolated a single colony (“resistant mutant”) from the resulting population (Methods). To quantify the responses of the drug-sensitive (REL607) and drug-resistant (REL606-derived mutant) cells to doxycylcline, we measured real-time per capita growth rate for isogenic populations of each strain exposed to different concentrations of drug (Figure 2). Briefly, growth rate was estimated using influx rate of media required to maintain populations at a constant density (Methods). The resistant isolate exhibits both increased resistance to doxycycline (increased half maximal inhibitory concentration) as well as a 10% fitness cost in the absence of drug (Figure 2). We note in the experiments that follow, drug concentrations are sufficiently high that resistant cells always have a selective advantage over sensitive cells, despite this fitness cost.
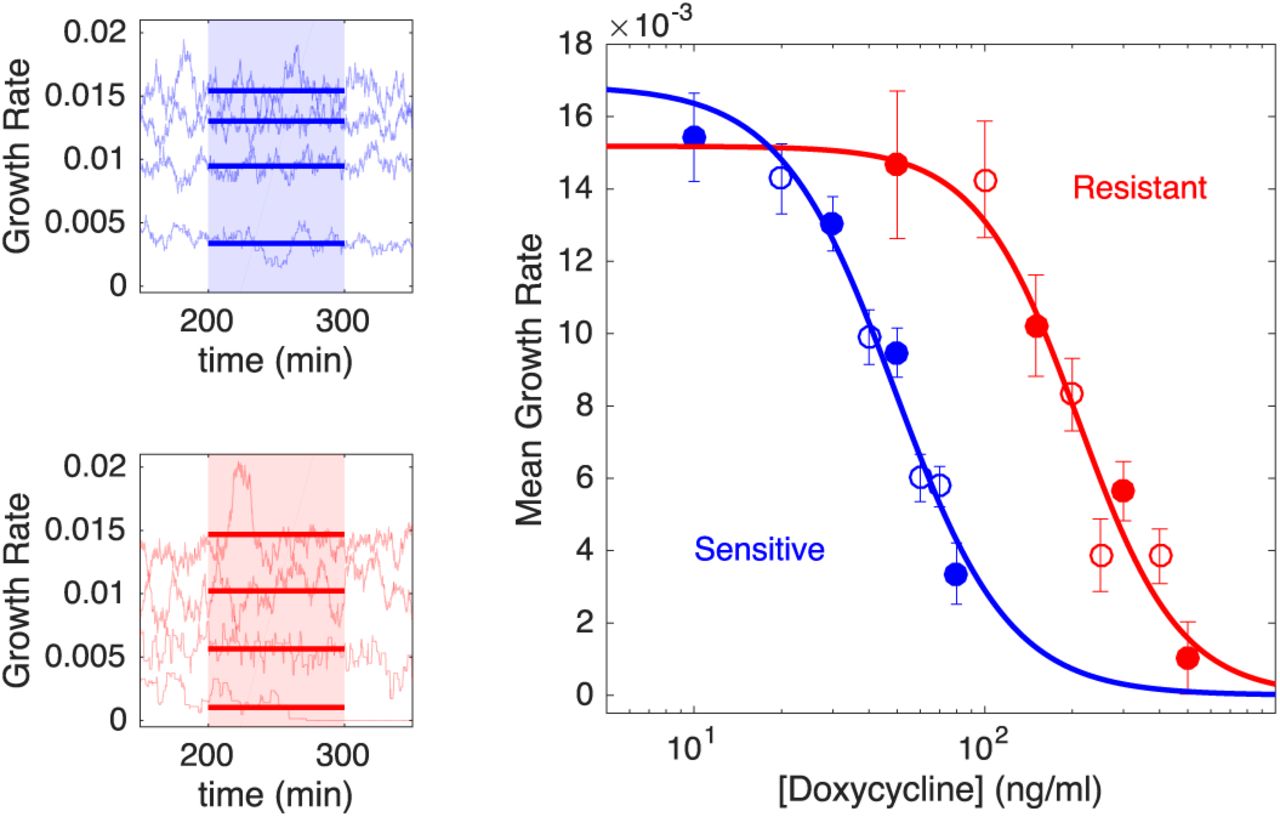
Left panels: per capita growth rate in bioreactors for ancestral (sensitive, blue) and resistant (red) populations exposed to increasing concentrations of doxycycline (top to bottom in each panel). Real time per capita growth rate (light blue or red curves) is estimated from flow rates required to maintain constant cell density at each drug concentration (Methods). Mean growth rate (thick solid lines) is estimated between 200-300 minutes post drug addition (shaded regions), when the system has reached steady state. Doxycyline concentrations are 10, 30, 50, and 80 ng/mL (top panel, top to bottom) and 50, 150, 300, and 500 ng/mL (bottom panel, top to bottom). Right panel: dose response curve for sensitive (blue) and resistant (red) populations. Filled circles correspond to curves shown in left panels, with error bars corresponding to ± one standard deviation over the measured interval. Solid lines, fit to Hill-like dose response function r = r0(1 + (D/h)k)-1, with r the growth rate, D the drug concentration, r0the growth in the absence of drug, h the half-maximal inhibitory concentration (IC50), and k the Hill coefficient. Half-maximal inhibitory concentrations are estimated to be h = 49 ng/mL (sensitive cells) and h = 210 ng/mL (resistant cells). Resistant cells also exhibit a fitness cost of approximately 10% in the absence of drug.
To test our primary hypothesis–that the presence of sensitive cells can enhance the efficacy of antibiotic control strategies–we designed a simple experiment that directly compares identical “treatment” regimens in three different populations: one seeded with a large number of sensitive cells, one seeded with only a small number of resistant cells, and one mixed population combining a large sensitive population and small resistant population (Figure 3A). Because high concentrations of drug are expected to completely inhibit growth of sensitive cells and therefore eliminate any potential competition, we designed an adaptive drug dosing protocol intended to maintain the mixed population at a fixed density (Pmax) using minimal drug. The adaptive protocol uses simple feedback control to adjust the drug concentration in real time in response to changes in population density (Figure 3A, Methods). Because drug is restricted to a finite range (0-125 ng/mL), populations containing resistant cells cannot be contained indefinitely and will eventually eclipse the target density (Pmax). The time required for this crossover is defined as the escape time, and the goal of the experiment is to compare escape times–which correspond, intuitively, to times of treatment failure–for different populations exposed to the same drug dosing.

A. Schematic of experiment. Three different populations (sensitive only, resistant only, and mixed) were exposed to identical antibiotic treatments in separate bioreactors. The media in each bioreactor was also refreshed at a constant rate of  . The drug treatment was determined in real time by measuring the density (OD) of the mixed population and adjusting drug influx to maintain a constant density (Pmax) while minimizing drug used (Methods). While the dynamics of the mixed population fully determine the temporal profile of the drug dosing, all 3 populations then receive identical treatments. In the high density experiment, mixed populations started at an OD of Pmax = 0.2, with a 90-10 ratio of sensitive to resistant cells. The initial OD of resistant cells is therefore 0.02. Resistant-only populations started from an initial density of 0.02 and contained no sensitive cells, while sensitive-only populations started from an initial density of 0.18 and contained no resistant cells. In the low density experiment, mixed populations started at an OD of Pmax = 0.1, and the initial OD of resistant cells was unchanged (OD=0.02). Therefore, the starting conditions of the high and low density experiments differ only in the number of sensitive cells. B and C. Experiments (left) and model (right) in high density (Pmax = 0.2, B) and low density (Pmax = 0.1, C) regimes. Red curves are resistant only, blue are sensitive only, and black are the mixed populations. Lightly shaded curves correspond to individual experiments, dark curves show the median across experiments. Horizontal dashed lines show the treatment failure threshold Pmax + 0.025, where the 0.025 term allows for small experimental fluctuations without triggering a threshold crossing event.
Specifically, we applied the adaptive dosing protocol to a mixed population of sensitive (90%) and resistant (10%) cells with an initial density just below the threshold Pmax. In parallel, we also applied an identical drug dosing protocol to matched populations of resistant-only and sensitive-only cells. The initial density of the resistant-only (sensitive-only) population was set to 0.1Pmax (0.9Pmax) to match the density of the resistant (sensitive) sub-population in the mixed population. We stress that while the temporal dynamics of the mixed population–but not the other populations–completely determine the dosing protocol, all three populations receive identical drug dosing and therefore experience identical drug concentrations over time.
This experimental design tests the effect of sensitive cells by comparing escape time in two extreme scenarios: 1) in the absence of sensitive cells, and 2) in the presence of the largest possible sensitive population (subject to the threshold constraint). In the absence of competition or other intercellular interactions, the dynamics of the mixed population should be a simple sum of the dynamics in the two single-species populations. As a result, escape times for both the resistant-only (scenario 1) and mixed (scenario 2) populations should be approximately equal. Intuitively, the drug is expected to inhibit the sensitive cells but have minimal effect on resistant cells, which determine the escape time. On the other hand, if competition suppresses the growth of resistant cells, one would expect the escape time of the mixed population to exceed that of the resistant-only population.
To quantitatively guide our experiments and refine this intuition, we developed a simple mathematical model for population growth in the bioreactors in the presence of an adaptive therapy (Methods). The model implicitly incorporates competition via a logistic growth term, similar to the classic Lotka-Volterra model. The model parameters are fully determined by independent experiments, such as those in Figure 2, that characterize the response of individual populations (sensitive only or resistant only) to fixed drug concentrations (see Table 1 and Methods for a detailed description of the model). As intuition suggests, the model predicts that escape times for the mixed population will be extended relative to the those for the resistant-only population only when the threshold density–the acceptable burden, Pmax–is sufficiently large.
Model Parameter Description
To test these predictions, we first performed the experiment at Pmax = 0.2 (Figure 3B), a threshold density which the model predicts will lead to competitive inhibition. Note that this density falls in the range of exponential growth and falls below the stationary phase limit in unperturbed populations (Figure S2). To account for batch effects and day-to-day experimental fluctuations, we repeated the experiment multiple times across different days, using different media and drug preparations. Unsurprisingly, the experiments confirm that sensitive only populations are significantly inhibited under this treatment protocol and never reach the containment threshold; in fact, the overall density decreases slowly over time due to a combination of strong drug inhibition and effluent flow (Figure 3B, blue curves). By contrast, the resistant-only population grows steadily and eclipses the threshold in 6-9 hours (Figure 3B, red curves). Remarkably, however, the mixed population (black curves) is contained below threshold–in almost all cases–for the entire length of the experiment, which spans more than 18 hours. At the end of the experiment, we plated representative examples of resistant only and mixed populations (Figure S3), which confirmed that the mixed vial was predominantly resistant at the end of the experiment. Matched drug-free controls indicate that containment in the mixed vial is due to drug, not artifacts from media inflow or outflow (Figure S3). The experiments also show remarkable agreement with the model (with no adjustable parameters; compare left and right panels in Figure 3B).
If competition were driving the increased escape time, one would expect the effect to be reduced as the threshold density (Pmax) is decreased. To test this hypothesis, we repeated the experiments at Pmax = 0.1 (Figure 3C). As before, the sensitive-only population is strongly inhibited by the drug and decreases in size over time (blue). Also as before, the resistant-only population (red) escapes the containment threshold, typically between 5-8 hours (faster than in the high Pmax experiment due to the lower threshold). In contrast to the previous experiment, however, the mixed population also escapes the containment threshold, and furthermore, it does so on similar timescales as the resistant-only population. Again, the agreement between model and experiment is quite good, though the model does predict a slightly longer escape time in the mixed population. The small discrepancy between the model and the experiment suggests that competition may decrease even more rapidly as density is lowered than the model assumes.
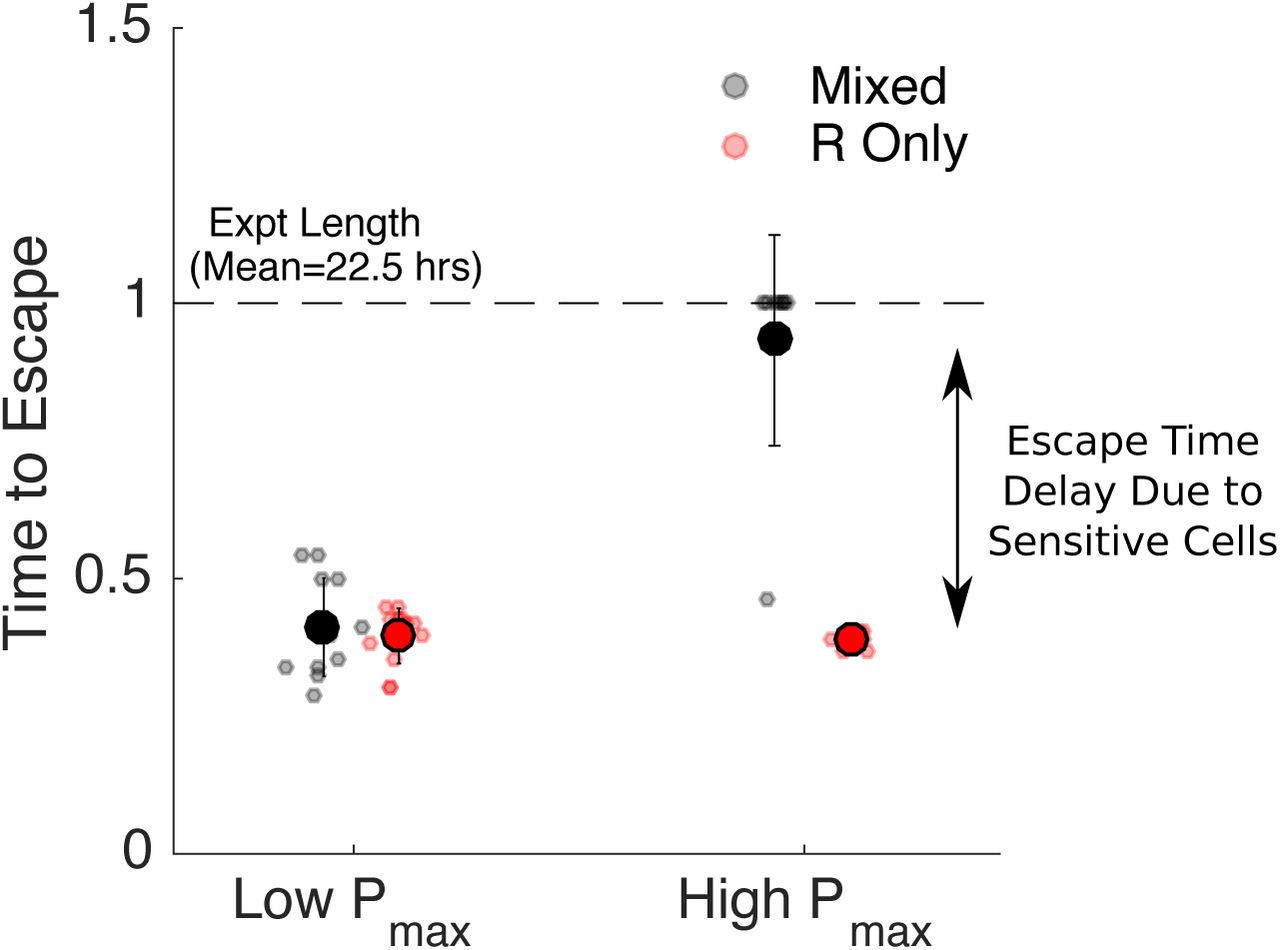
To quantify these results, we calculated the time to escape for each experiment. We defined time to escape for a particular experiment as the first time at which the growth curve (OD) exceeded the threshold density Pmax by at least 0.025 OD units (note that the 0.025 was chosen to allow for noise fluctuations in the OD time series without triggering a threshold crossing event). For low values of acceptable burden (Pmax), the escape times for resistant-only and mixed populations are nearly identical (Figure 4, left). By contrast, at higher values of Pmax, the escape time is dramatically increased in the mixed population relative to the resistant-only population (Figure 4, right), even though both receive identical drug treatment and start with identically sized resistant populations.
Time to escape for populations maintained at low (Pmax = 0.1, left) and high (Pmax=0.2, right) threshold densities (“acceptable burdens”). Small circles: escape times for individual experiments in mixed (black) or resistant-only (red) populations. Large circles: mean escape time across experiments, with error bars corresponding to ± one standard deviation. Time to escape is defined as the time at which the population exceeds the threshold OD of Pmax + 0.025, where the 0.025 is padding provided to account for experimental fluctuations. Time to escape is normalized by the total length of the experiment (mean length 22.5 hours). Note that in the high Pmax case (right), the mixed population (black) reached the threshold density during the course of the experiment in only one case, so the escape times are set to 1 in all other cases.
We note that previous theoretical work [49] indicates that sensitive cells may also come with a cost because they serve as a potential reservoir for de novo resistance. In fact, one can show that for our experimental system, the effect of mutations is expected to be negligible for biologically relevant mutation rates (see SI, Methods). As a result, we neglect mutation in the current model. Importantly, our experiments suggest that sensitive cells are beneficial at high values of Pmax and have little effect at low Pmax, consistent with the assumption that mutation-driven costs of sensitive cells in our system are negligible.
Discussion
In this work, we provide direct experimental evidence that the presence of drug-sensitive cells can lead to improved antibiotic-driven control of bacterial populations in vitro. Specifically, we show that adaptive antibiotic dosing strategies can contain mixed populations of sensitive and resistant cells below a threshold density for significantly longer than matched populations containing only resistant cells. The increase in escape time occurs only when the threshold density is sufficiently high that competition is significant. The findings are particularly remarkable given that experiments are performed in well mixed bioreactors with continuous resource renewal, and even the highest density thresholds occur in the exponential growth regime for unperturbed populations. The surprisingly strong effect of competition under these conditions suggests that similar approaches may yield even more dramatic results in natural environments, where spatial heterogeneity and limited diffusion may enhance competition [65–67].
Notably, our experiments do not uncover scenarios where sensitive cells may actually be detrimental and accelerate resistance emergence. Theory suggests that these scenarios do indeed exist [49], but because of the typical mutation rates observed in bacteria, they cannot be reliably produced with our experimental system (see SI for extended discussion).
It is important to keep in mind several technical limitations of our study. First, we measured population density using light scattering (OD), which is a widely used experimental surrogate for microbial population size but is sensitive to changes in cell shape [68]. Because we use protein synthesis inhibitors primarily at sub-MIC concentrations, we do not anticipate significant artifacts from this limitation, though it may pose challenges when trying to extend these results to drugs such as fluorquinolones, which are known to induce filamentation [69,70]. In addition, in the absence of cell lysis, OD can not distinguish between dead and living cells. However, our experiments include a slow background flow that adds fresh media and removes waste, leading to a clear distinction between non-growing and growing populations. Under these conditions, fully inhibited (or dead) populations would experience a decrease in OD over time, while populations maintained at a constant density are required to divide at an effective rate equal to this background refresh rate.
Most importantly, our results are based entirely on in-vitro experiments, which allow for precise environmental control and quantitative measurements but clearly lack important complexities of realistic in-vivo and clinical scenarios. Developing drug protocols for clinical use is an extremely challenging problem spanning multiple length and time scales. Our goal was not to design clinically realistic adaptive therapies, but instead to provide direct experimental evidence that sensitive cells can improve drug-driven control protocols in a tractable setting. The use of drug sensitive cells to manage resistance will (and should) remain controversial, particularly in the absence of detailed in-vivo investigations. Containment-based strategies come with a number of potentially dangerous drawbacks–including the possibility of increased resistance–from maintaining larger pathogen loads. At the same time, there are proposed benefits of less aggressive strategies, including fewer adverse effects for the patient. Our results are compelling because they provide empirical evidence that competitive suppression can enhance containment of resistant cells in-vitro, raising the question of whether similar competitive dynamics may play out in-vivo. We therefore hope they will motivate continued experimental, theoretical, and perhaps even clinical investigations.
Methods
Bacterial Strains, Media, and Growth Conditions
Experiments were performed with Escherichia coli strains REL 606 and 607 [64]. Resistant strains were isolated from lab-evolved populations of REL606 undergoing daily dilutions (200X) into fresh media with increasing doxycycline (Research Products International) concentrations for 3 days. A single resistant isolate was used for all experiments. Stock solutions were frozen at −80C in 30 percent glycerol and streaked onto fresh agar plates (Davis Minimal Media (Sigma) with 2000 µg/ml glucose) as needed. Overnight cultures of resistant and sensitive cells for each experiment were grown from single colonies and then incubated in sterile Davis Minimal Media with 1000 µg/ml glucose liquid media overnight at 30C while rotating at 240 rpm. All bioreactor experiments were performed in a temperature controlled warm room at 30C.
Continuous Culture Bioreactors
Experiments were performed in custom-built, computer-controlled bioreactors as described in [71], which are based, in part, on similar designs from [72,73]. Briefly, constant volume bacterial cultures (17 mL) are grown in glass vials with customized Teflon tops that allow inflow and outflow of fluid via silicone tubing. Flow is managed by a series of computer-controlled peristaltic pumps—up to 6 per vial—which are connected to media and drug reservoirs and allow for precise control of various environmental conditions. Cell density is monitored by light scattering using infrared LED/Detector pairs on the side of each vial holder. Voltage readings are converted to optical density (OD) using a calibration curve based on separate readings with a table top OD reader. Up to 9 cultures can be grown simultaneously using a series of multi-position magnetic stirrers. The entire system is controlled by custom Matlab software.
Experimental Mixtures and Set up
Before the experiments begin, vials are seeded with sensitive or resistant strains of E. coli and allowed to grow to the desired density in the bioreactor vials. Cells were then mixed (to create the desired population compositions) and diluted as appropriate to achieve the desired starting densities. Each vial is connected to 1) a drug reservoir containing media and doxycycline (500 µg/ml), 2) a drug-free media reservoir that provides constant renewal of media, 3) an effluent waste reservoir. Flow from reservoir 1 (drug reservoir) is determined in real-time according to a simple feedback algorithm intended to maintain cells at a constant target density with minimal drug. Flow to/from reservoirs 2 and 3 provides a slow renewal of media and nutrients while maintaining a constant culture volume in each vial.
Drug Dosing Protocols
To determine the appropriate antibiotic dosing strategy the computer records the optical density in each vial every 3 seconds. Every 3 minutes, the computer computes:(i) the average optical density ODavg in the mixed vial over the last 30 seconds and (ii) the current drug concentration in the vial. If ODavg is greater than Pmax, the desired containment density, and the current drug concentration is less than  then drug and media will be added to the vial for 21 seconds at a flow rate of 1 mL/min. In a typical experiment, this control algorithm is applied to one of the mixed populations to determine, in real time, the drug dosing protocol (i.e. influx of drug solution over time). The exact same drug dosing protocol is then simultaneously applied to all experimental populations (mixed, resistant-only, sensitive-only, Figure 3). In parallel, an identical dosing protocol is applied to a series of control populations, but in these populations, the drug solution is replaced by drug-free media (Figure S3).
Mathematical Model
The mathematical model used in the simulations is
 where S and R are the drug-sensitive and drug-resistant densities in mixed vial, Ronly is the bacterial density in the vial that contains only drug-resistant bacteria, Sonly is the bacterial density in the vial that contains only drug-sensitive bacteria and D is the drug concentration in the vials,. The initial conditions for the simulations (and experiments) are given in Table 2. The effect of drug on growth rate is modeled as a hill function with parameters rS, kS and hS for the sensitive strain and parameters rR, kR and hR for the resistant strain. There is also a time-delay associated with the effect of drug (denoted by τS for the sensitive strain and ?R for the resistant strain). Competition in the model is captured by using a logistic growth term with carrying capacity C. It is assumed that the sensitive and resistant strains have similar carrying capacities. Finally, the bioreactor has a continual efflux to maintain constant volume. The rate of this outflow is the sum of the constant background nutrient flow FN and any additional outflow required to compensate for the inflow of drug which enters at a rate FDχD. FD is a constant rate and χD is an indicator function which is 1 when drug is being added to the vials and 0 when it is not. In the simulations, the decision of when to add drug is based on the same control algorithm that was used in the actual experiment (see Methods: Drug Dosing Protocols). Since Model (1) describes the rate of change of bacterial density, the total efflux (FN + FD χD) is divided by the volume of the vials V. The drug concentration in the vials is determined by the rate of drug flow into the vials (FDχDDin, where Din is the concentration of drug in the reservoir) and the rate of efflux out of the vials (FDxD + FN). The values of Din, V, FD and FN were chosen to match the associated values in the experimental system, all other parameters in the model where fit using independent experimental data (see SI for details) and are given in Table 1.
Initial Optical Densities for Simulations and Experiments
Acknowledgements
This work is supported by the National Science Foundation (NSF No. 1553028 to KW), the National Institutes of Health (NIH No. 1R35GM124875-01 to KW; NIH No. R01 GM089932 to AFR; NIH K08 AI119182 to RW), and the Eberly Family (to AFR). The funders had no role in study design, data collection and analysis, decision to publish, or preparation of the manuscript. The format of the preprint is based on a modified PLoS latex template provided on Overleaf.com.
References


