

Abstract
Studying relationships among gene-product expression profiles is a common approach in systems biology. Many studies have generalized this subject to different levels of the central dogma information flow and assumed correlation of transcript and protein expression levels. All these efforts have updated the signaling network models and expanded the current signaling databases, which include interactions among the gene-products extracted based on either the literature or direct and indirect experiments. In fact, due to unavailability or high-cost of the experiments, most of the studies do not look for the direct interactions (gene-protein or protein-protein) and some of them are contradictory. In addition, it is now a standard practice to undertake enrichment analysis on biological annotations especially in omics research to make claims about the potentially implicated biological pathways in disease. Specifically, upon identifying differentially expressed genes, molecular mechanistic insights are proposed based on statistically enriched biological processes for disease etiology and drug discovery. However, it remains to be demonstrated that expression data may be used as a reliable source to infer causal relationships among gene pairs. In this study, using four common and comprehensive databases i.e. GEO, GDSC, KEGG, and OmniPath, we extracted all relevant gene expression data and all relationships among directly linked gene pairs in order to evaluate the rate of coherency or sign consistency. We illustrated that the signaling network was not more consistent or coherent with the measured expression profile compare to random relationships. Finally, we provided the pieces of evidence and concluded that gene-product expression data, especially at the transcript level, are not reliable or at least insufficient to infer biological relationships among genes and in turn describe cellular behavior.
1. Introduction
In network biology, defining relationships among nodes is crucial for the downstream analysis (1). The most available high-throughput data to infer molecular relationships are arguably whole-transcriptome expression profiles analyzed with statistical models (2). A main challenge is extrapolating causality in signaling and regulatory mechanisms from a significant correlation between any given gene pair. A lot of spurious correlations among gene pairs may occur without any causal relationship that could happen indirectly or stochastically (3). Reverse engineering algorithms are developed to tackle this challenge and to infer gene networks and regulatory interactions from expression profiles (4).
When considering signaling networks, their main players are proteins whose activity is often regulated by post-translational modifications such as phosphorylation. Hence, inference of signaling networks can be directly inferred from (Phospho)proteomic and protein-protein interaction data (5). This data is hard and expensive to acquire. Given the correlation between protein and gene expression, a common alternative approach is to use gene expression to estimate interactions between proteins. However, in general, the gene expression or transcriptomics discuss about what appears to happen in a biological system, while the signaling network exhaust to what makes it happens and has happened in a complex view of the system (6). This therefore begs the question whether gene expression profiles strengthen the logic i.e. activatory/inhibitory mechanism of signaling circuits.
In this study, we aimed to examine the coherency between expression profiles and the type of relationship, in signaling networks, for all possible gene pairs. Imagine in a gene pair (A, B) where gene A activates gene B. If the expression profiles of both were correlated positively, we infer that expression data strengthen the logic of this signaling relationship and are thus coherent. In contrast, let gene A inhibit gene B. In this case, the coherent gene pairs are negatively correlated. If gene A activates gene B and there is negative correlation between them or if gene A inhibits gene B and there is positive correlation between them, we called an incoherent relationship between the gene pairs. In addition to these simple scenarios, we have also considered more complicated subgraphs in a signaling network (See Table 1) to answer the question raised above.
Details of different subgraphs present in all biological signaling networks. The dashed lines indicate multiple edges between nodes. The last two columns provide the number of each subgraph in the two signaling databases.
For this, we used expression datasets in the Gene Expression Omnibus (GEO) (7) and Genomics of Drug Sensitivity in Cancer (GDSC) (8) to extract all relevant gene expression profiles. Two literature-curated databases for signaling pathways, namely the Kyoto Encyclopedia of Genes and Genomes (KEGG) (9) and OmniPath (10) were used to extract the type of relationships among directly linked gene pairs. Therefore, coherency analysis was undertaken independently for all four combinations of databases in parallel (see Fig. 1).

Visual overview of how information from different databases was integrated to analyze the coherency. An edge list was constructed from KEGG and OmniPath databases. All the gene expression profiles for the edge list genes were then downloaded from GEO and GDSC databases. Next, data were preprocessed and a suitable structure, namely SignalingNet, was created for correlation analysis among the gene pairs. By interpreting the information from correlation tests and statistical proportional tests, coherency analysis was implemented on different forms of subgraphs. There is a total of four coherent conditions in panel A and four incoherent conditions in panel B. For instance, in panel A, if gene1 is up-regulated and there is an activation between the gene pair, gene2 must be upregulated. In panel B, if gene1 is up-regulated and there is an inhibitory relationship between the gene pair, gene2 is expected to be up-regulated.
2. Materials and Methods
In this study, four independent analyses were performed based on two gene expression databases i.e. GEO and GDSC and two signaling pathway databases i.e. KEGG and OmniPath (which integrates literature-curated human signaling pathway of 34 resources) in parallel (Fig. 1). Thus, the signaling pathway databases were independently used to reconstruct a whole signaling network and the gene expression databases were separately used to apply correlation analysis on each gene pair in the pathways to do and compare GEO/KEGG, GDSC/KEGG, GEO/OmniPath, and GDSC/OmniPath distinct analysis and findings. To briefly introduce the used databases, GEO is an NCBI international public repository that archives microarray and next-generation sequencing expression data. The GDSC database is the largest public repository that archives information about drug sensitivity in cancer cells and biomarkers of drug response in these cells. In this work, gene expression profiles from GDSC cell lines and GEO studies were used to extract pairwise association between genes.
2.1 Signaling network reconstruction
Here, we focused on human signaling pathways based on available datasets. All human-related signaling pathways were downloaded from the KEGG database. Using the KEGGgraph package (11), these pathways were imported into R (12). Edge information was extracted and each graph was converted to an edge list. Next, all edges were merged and a directed signed signaling network was reconstructed (Supplementary file 1, section 1 and Supplementary file 4). Eligible edges (see section 3.1) were then selected and correlation analysis was undertaken on eligible gene pairs. The pypath python module (10) was used to create an edge list based on the OmniPath database (see Supplementary file 4). This edge list was imported into R for other downstream statistical analysis on the gene pairs.
2.2 Gene expression profiles extraction
The standard GEO query format was used to identify all up- and down-regulated genes which were present in the KEGG and/or OmniPath edge lists. Gene expression profiles available in GDSC were downloaded for both edge lists, followed by preprocessing to remove repeated samples and non-informative datasets. Finally, for both GEO and GDCS, an expression matrix of XX genes and YY conditions? was created for all the edge list genes (Supplementary file1 sections 2 and 3. Supplementary files 5).
2.3 Mutual association analysis
In the next step, for storing, manipulating and analyzing these data, an R list object was created containing all the gene expression profiles. Each element of this list represent an edge in the edge list comprising two rows for the source and target genes and multiple columns for the samples which contain normalized expression values for both (Supplementary files 6).
To detect any inconsistency among the samples collected from diverse datasets, each element of SignalingNet was split into distinct elements based on the origin of datasets. It means that the correlation analysis was not performed on mixed heterogenous values and in this step, the relevant values were separately considered to do the following analysis. After outlier detection, the Pearson correlation analysis was undertaken on each element of the SignalingNet. According to the statistical significance and the sign of the correlation coefficient, the coherent and incoherent edges were inferred (Supplementary file 1 sections 4 and 5).
2.4 Randomly selected unconnected gene pairs
The edge lists obtained in the previous step were converted into adjacency matrices using igraph package in R (13). Then, the adjacency matrix was self-multiplied more than the diameter of the network. After that, we randomly selected 1000 unconnected gene pairs for which the corresponding elements in the matrix were zero (gene pairs with no direct immediate and non-immediate interactions). For these gene pairs, that we call unconnected gene pairs (UGPs), the same downstream analyses were implemented to compare significance and sign of correlation for all types of connected gene pairs (Supplementary file 1 section 6, Supplementary files 7).
2.5 Complex subgraphs
We extracted specific subgraphs from the signaling networks to investigate any relationship between gene expression profiles and complex structure of gene pairs. DNFBL, DPFBL1, and DPFBL2 are subgraphs of gene pairs which influence each other directly twice (see Table 1). These pairs are readily found by checking the source and target nodes in the edge lists (or upper and lower triangles in adjacency matrices). We then focused on connected gene pairs which also influence each other indirectly by a sequence of intermediate nodes. Using matrix self-multiplication, the weighted and un-weighted adjacency matrices of the component of eligible edges in signaling network are powered by the network radius magnitude. Considering that the network is directed and the adjacency matrix is not symmetric, the feed-forward and feed-back loops i.e. MNFBL1-2, MPFBL1-2, MFFL1-2, and MNFFL1-2 are determined (Table 1). For more detailed explanation, see Supplementary File 1 sections 7 and 8.
3. Results
Table 2 provides overall details of the four parallel coherency analyses presented here including the dimension of the expression matrices generated from whole-transcriptome expression profiles, and the size and diameter of the giant component in each analysis. Of note, the number of unique edge list genes was higher in OmniPath than KEGG. In addition, the ratio of genes common to the edge list and gene expression profiles was also greater in OmniPath.
General properties and date retrieved of the signaling networks. The number of differentially expressed genes (DEGs) are also given, which are those common between the edge list genes and gene expression profile genes and identified by the GEO/GDSC database either up- or down-regulated. Samples are all the samples in GEO and GDSC databases for which expression data were available for the given gene pair. The size of the giant component, the diameter of the network and the ratio of common genes between edge list genes and gene-expression-profile genes are presented in the last three columns respectively.
3.1 Eligibility of the edges
For correlation analysis between any gene pair, we only considered gene expression datasets which have more than two samples. These gene pairs were considered as eligible edges for downstream statistical analysis.
The ratio of eligible edges to all edges was calculated for all four analyses (see Fig. 2B). The ratio of eligible edges in the OmniPath edge list was greater than KEGG based on both GDSC and GEO databases. Also, the ratio of eligible edges was greater in GDSC compared with GEO.

(A) The proportion of eligible and ineligible edges in the four parallel analyses. The numbers around each chart represent the number of edges at that point. (B) An exemplary of relationship between gene pair expression. These scatter plots contain Pearson coefficient correlations and fitted linear regression line. The X-axis and Y-axis values differ according to the expression profile of this gene pair in different gene expression dataset. Panel A depicts the gene expression profiles of this exemplary gene pairs in the edge list before pre-processing. In panel B, the same gene pair’s expression profiles firstly separated to the four relevant datasets, then analyzed and depicted independently.
3.2 Pre-processing of expression data
Samples with expression data for the gene pairs may have come from different datasets and therefore should be separated and analyzed independently. Fig. 2A represents the effect of this preprocessing on a gene pair in our dataset. Briefly, in Fig. 2A, one of the non-preprocessed datasets contains four different datasets with different sample size. The correlation coefficient is calculated to be 0.46. The same dataset has been separated into its 4 constituent datasets and correlation analysis was done on each set individually. Different correlation values (including negative) are observable. Therefore, the sample heterogeneity can easily affect any pairwise relationship. An edge is therefore considered as homogeneous if the correlation sign is consistent across all. These homogeneous edges were used for correlation analysis.
3.3 defining coherency for each edge
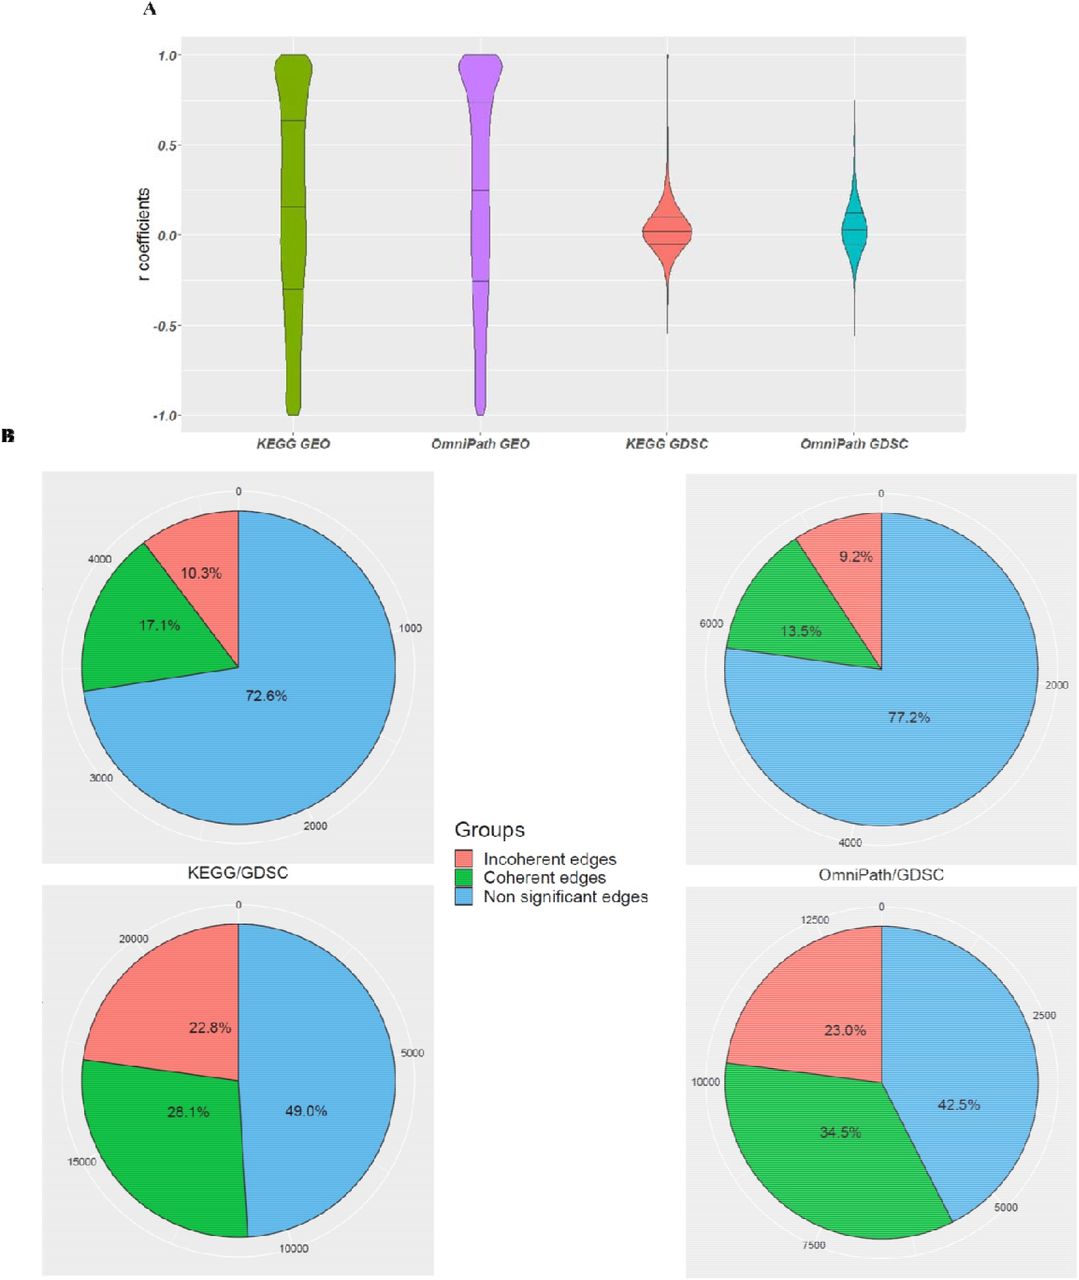
After filtering out heterogeneous edges, a large list of homogeneous edges was constructed (Supplementary file 1 sections 3.5 - 3.7 and Supplementary files 6) for correlation analysis. The violin plots of Pearson correlation coefficients for each analysis are shown in Fig. 3A. The distribution of the coefficients shows a nearly uniform distribution for KEGG/GEO and OmniPath/GEO while for KEGG/GDSC and OmniPath/GDSC, it follows a normal distribution with the median at approximately zero. In addition to the issue of different sample size in GEO and GDSC, this suggests that for GDSC-based edges, correlations between the expression profiles of the gene pairs do not tend to show high positive or negative correlation. This means that for a given gene pair (A, B), over-expression or under-expression of A does not have a large effect on the expression of B regardless of the edge type.

(A) Distribution of Pearson correlation-coefficient values for the four parallel coherency analyses. (B) The ratio of coherent, incoherent and NA edges. The values around each pie chart represent the exact numbers.
Fig. 3B depicts the ratios of coherent and incoherent edges along with the number of NAs which have the FDR-adjusted p-values larger than 0.05 and we could not declare about the coherency status by a likelihood greater than or equal to 95%. In addition, sum of the ratio of incoherent edges and NA edges are more than the ratio of coherent edges in all four analyses. The ratio of coherent edges in OmniPath is totally more than KEGG. Also, the ratio of coherent edges in GDSC database is more than GEO.
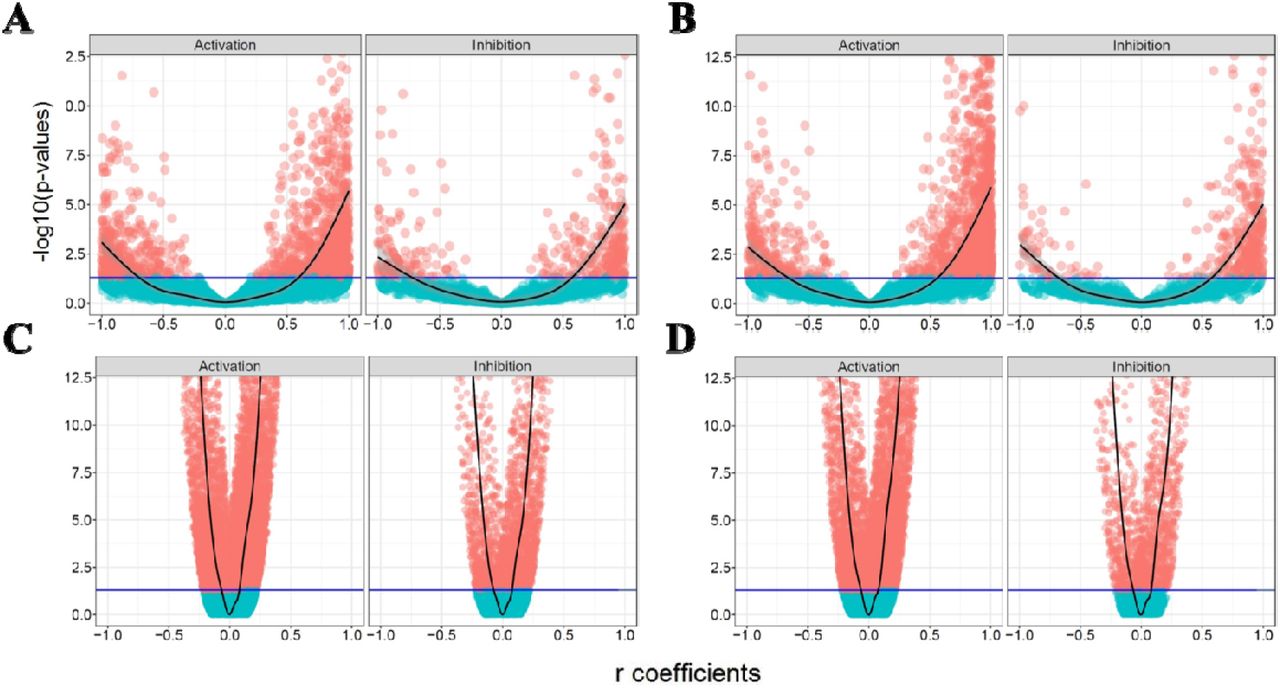
Fig. 4 shows the FDR-adjusted P-vlaues versus r correlation coefficients of activation and inhibition edges in all four analysis. A symmetric pattern of coefficients is recognizable for both of activation and inhibition edges in all four analyses. This suggests that the correlation between a given gene pair is not largely affected by the sign of the interaction. In the other word, even activation edges illustrate an overrepresentation of strong positively correlated gene pairs in all four analysis, the inhibition edges do not display any enrichment in strong negative side of plots compared to strong positive side. It also shows that the majority of coherent gene pairs are related to activation not inhibition edges. In the next step, we tried to explore more and provide reasoning about the incoherent edges by focusing on more complex subgraphs in signaling network.

The volcano plots of the activation and inhibition edges. The horizontal axis is the Pearson correlation coefficient and vertical axis shows log transformed FDR-adjusted P-values. The threshold line (blue) represents the significance cut-off value of 0.05. (A) and (B) are KEGG/GEO and OmniPath/GEO plots, and (C) and (D) plots correspond to KEGG/GDSC and OmniPath/GDSC analyses.
3.4 Correlation and coherency analysis on different subgraphs
In this step, we explored whether more complex subgraphs are more coherent comparing with considering single edges. Otherwise speaking, we assumed that observing some incoherency of activation and inhibition edges depend on complex structure of signaling network and logical behavior of larger subgraphs should be considered to infer coherency (see Table 3).
The ratio of eligible edges participating in different kinds of subgraphs for the KEGG/GEO analysis. Columns 3 to 5 are ratio of homogeneous edges with the specified p-value and Pearson correlation coefficient. Column 6 is the ratio of heterogeneous edges.
Similar to the simple activation or inhibition edges, correlations are computed and categorized considering the correlation sign for each mentioned subgraph and the calculated P-values. These data are available in Supplementary file 2 for all four analyses. The ratio of subgraphs for KEGG/GEO analysis are presented in Table 3.
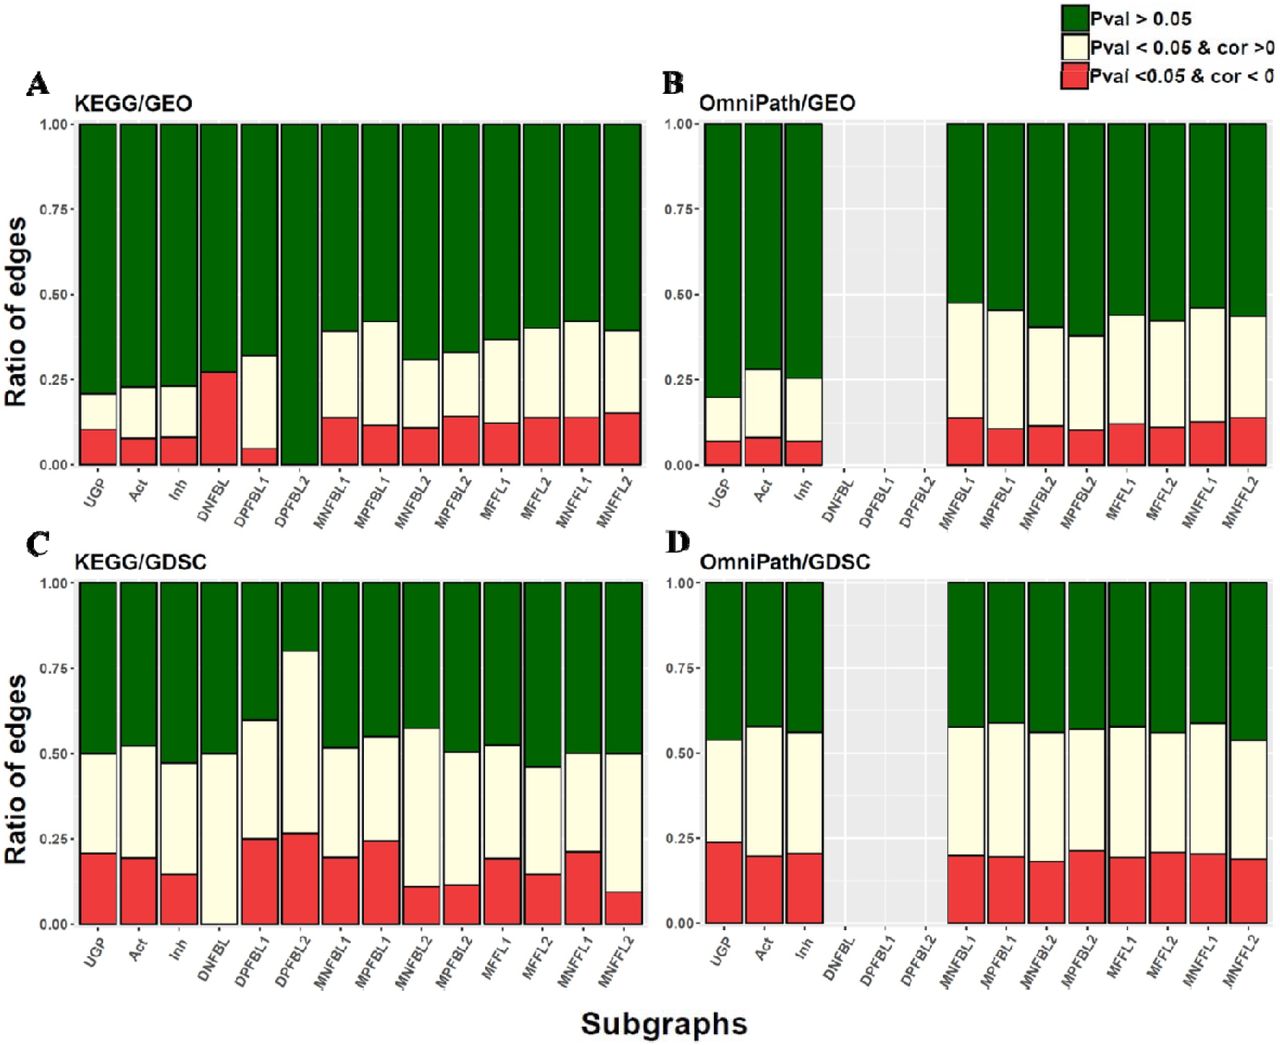
To statistically compare, the correlation analysis was also implemented on multiple sets of 1,000 randomly unconnected gene pairs (UGP) and Mann-Whitney proportion test was then computed to compare all of the proportions illustrated in Table 3 and Fig. 5. Although the proportions of UGP are statistically different with the proportions of activation and inhibition, there is not any statistical differences between activatory and inhibitory interaction proportions (Supplementary File 3). It means that the connected genes are affected each other in respect to UGP but it may happen in a more complex way that it is not inferred by correlation analysis. The ratios of activation and inhibition edges are almost similar for all three small subgraphs i.e. DNFBL, DPFBL1 and DPFBL2 (see Fig. 5). Since the number of edges are very low, we aimed to continue our search for coherency in larger structure of subgraphs. We therefore investigated the large subgraphs which contain more than two edges i.e. MNFBLs, MPFBLs, MFFLs and MNFFLs. However, we did not observe any strong coherent relationship among the gene pairs again, suggesting that, depending on the structure of the subgraph, gene expression profiles do not match the logic of signaling circuits.

The ratio of eligible and homogeneous edges involved in different subgraphs are represented by stacker bar plots for all four analyses. (A) and (B) are KEGG/GEO and OmniPath/GEO plots, and (C) and (D) plots correspond to KEGG/GDSC and OmniPath/GDSC.
Note that the ratios for the analysis based on OmniPath and GDSC is more uniformly distributed hold a candle to others and there is not any kind of dual feedback loop structures i.e. DNFBL and DPFBLs in OmniPath signaling network which can be controversy (Fig. 5).
4. Discussion
Recent high-throughput technologies, such as next-generation sequencing and mass spectrometry proteomics has uncovered the amount of expression in mRNA and protein levels (14). There is an obvious correspondence between mRNA and protein concentrations. Nonetheless, more than fifty percent of protein variation cannot be explained by variation in mRNA concentration (15). These unexplained variations come from organism-specific translational and post-translational regulations including protein degradation and gene sequence features. The correlation between mRNA and protein concentrations are highly considerable for some genes, but in some eukaryotes, it is very poor for genes of signal transduction and transcriptional regulation. These findings are true for worm and fly but are different for yeast. In yeast, genes engaged in signal transduction have high correlations between mRNA and protein concentrations (16). Recently, Larsen et al. demonstrated that there is not any causal relationship between the expression of transcription factors and their targets in the gene regulatory network of E. coli and thereupon the transcriptional regulation cannot be adequately addressed by the current static gene regulatory networks (17). Regulation of gene expression results in a certain concentration of proteins. These proteins may be involved in different signaling networks and they determine the cell’s fate and behavior of the system (18). Transcription regulation is very important, although it is not sufficient to completely describe protein abundances because each gene has many features and regulatory elements (19).The data in different studies have discovered the roles of post-transcriptional, post-translational and protein degradation regulations in controlling steady states of gene product abundances (20). These modifications apparently have shown their impacts in this study when we illustrated that there is a poor coherency in transducing the signals with the gene expression. As a result, Inferring a gene regulatory from transcript data is a difficult but important task (21). Only in some cases, the results are more reliable for constructing gene regulatory networks if the components of the system are mostly kinases and transition of the signals are related to the phosphorylation process (22).
Although there is a general assumption that the expression level could strengthen or weaken the signal to transduce in signaling pathway, but we illustrated that in many instances, there is not a noticeable coherency between the mRNA level of gene pairs and the way (i.e. logic) they manipulate one another (Fig. 5). However, we also showed that there is a sort of association between the structure of the subgraphs and gene pair expression profiles. Expression profiles of the unconnected gene pairs were statistically more independent than connected ones. To support this idea, two signaling databases and two gene expression databases were used and the similar results acquired in the analysis of all four combinations.
Based on the correlation results in Fig. 3A, the volcano plots in Fig. 4 which exhibit no significant difference between activation and inhibition edges, the ratios in table 3 and Fig. 5, causal correlation can be inferred poorly at the transcript level at least in a multicellular eukaryotic such as human. Proportional tests in supplementary file 3, suggest that there is a statistical difference between UGP and other subgraphs and this demonstrates that structure of subgraphs affect the coherency. It is also strongly advocated to use information in signaling networks, or define relationships between the genes, assess the gene expression at both transcript and protein level or look for the direct inteartions.
In this study, we aimed to focus on the impact of the relationship logic on the destination of any given stimulated signaling pathway which usually ignored in functional genomic studies. We demonstrated that differentially expressed genes have only a little information of the whole story of associated mechanism. Most of these kinds of altred expression are disappeared gradually and ignored by the whole system of signaling network either stimulated endogenously or exogenously.
Supplementary file legends
Supplementary file 1: The experimental procedure based on KEGG/GEO analysis in detail. This file contains 9 sections. The first section describes how KEGG edge list with 26,490 edges was built. Next, in the second section, downloading and merging the up-down gene expression profiles was explained for KEGG genes. Section three walks you through preprocessing of the expression profiles. In this step, a large list containing 1,969 experiments (GDS) was built. A large expression matrix called Exprtable with 40,903 samples in column and 3,187 genes in row was constructed. From this matrix a list called SignalingNet constructed having an element for each gene pair in the KEGG edge list. In the fourth section, each element of SignalingNet contains the expression values and correlation information for the source and the target genes. Section five includes the information for coherency of the edges and the number of activation and inhibition edges having specific p-value and correlation coefficient. Then, in the sixth section, 10 sets of 1,000 unconnected node pairs were built in which the genes never reach one another (based on KEGG information). The correlation analysis was also performed on these node pairs. In the seventh section, number of edges having specific p-value and correlation coefficient engaged in two-edge subgraphs were computed. Afterwards, in the eighth section, number of edges having specific p-value and correlation coefficient engaged in multiple-edge subgraphs were computed. Finally, in the ninth section, the results were summarized in some tables.
Supplementary file 2: Correlation analysis of all four analyses. Results are the number of edges having specific p-values and correlations in different subgraphs.
Supplementary file 3: The proportional statistical tests between the rows in the tables in supplementary file 2 for all four analysis in separate sheets.
Supplementary file 4: The KEGG and OmniPath edge lists.
Supplementary file 5: The large expression matrices constructed based on four analysis analyses.
Supplementary file 6: The SignalingNet list for the four analyses.
Supplementary file 7: The unconnected SignalingNet list for the four analyses.
Acknowledgement
The authors would like to thank Dr. Julio Saez-Rodriguez and Bence Szalai for their valuable comments and discussions.
Footnotes
author affiliations updated A link to the full Supplemental files provided
https://drive.google.com/open?id=1VL6slpMBRaxzza64t7m2Gwj6xLlIf_Gf
5. References


