

Abstract
Metabolomics examines the small molecules involved in cellular metabolism. Approximately 50% of total phenotypic differences in metabolite levels is due to genetic variance, but heritability estimates differ across metabolite classes and lipid species. From the literature we aggregate > 800 class-specific metabolite loci that influence metabolite levels. In a twin-family cohort (N = 5,117) these metabolite loci were leveraged to simultaneously estimate total heritability (h2total), SNP-based heritability (h2SNP) and the proportion of heritability captured by known metabolite loci (h2GW-loci) for 309 lipids and 52 organic acids. Our study revealed significant differences in h2SNP and h2GW-loci among different classes of lipids and organic acids. Furthermore, phosphatidylcholines with a higher degree of unsaturation had higher h2GW-loci estimates. This study highlights the importance of common genetic variants for metabolite levels and elucidates the genetic architecture of metabolite classes and lipid species.
Metabolites are the small molecules involved in cellular metabolism, while the metabolome is typically defined as the collection of metabolites produced by cells1. Metabolomics aims at providing a holistic overview of the metabolome1, and allows for the elucidation of underlying biological mechanisms and metabolic disturbances in diseases. At the same time metabolomics may offer potential new therapeutic targets or new biomarkers for disease diagnosis2. Variation in metabolite levels can arise due to gender3, and age4, as well as physiologic effects, behavior, and lifestyle, such as diet5. Genetic differences may be a source of direct variation in metabolomics profiles or may exert their effects on metabolite profiles through the genetic influences on behavior or physiology.
Systematic investigations of common genetic variants in human metabolism by genome- and metabolome-wide analysis successfully identified genetically influenced metabotypes (GIMs)6. The first genome-wide association study (GWAS) in 2008 (N = 284 participants) identified four genetic variants associated with metabolite levels7. Thereafter, GWAS with increasing sample sizes, and in diverse populations, have resulted in the identification of hundreds of Single Nucleotide Polymorphism (SNP) associations with metabolites from a wide range of metabolite classes6. Additional metabolite loci have been identified by leveraging low-frequency and rare-variant analyses using (exome-) sequencing. We conducted a comprehensive review of all quantitative trait locus (QTL) discovery for metabolites and supply the complete reference list in Supplementary Note 1.
Twin and family studies estimated the heritability (h2; proportion of phenotypic variance due to genetic variance) for metabolite levels at around 50%, ranging from a heritability of 0% to 80% 5,8–15. Several studies reported differences in heritability estimates among different classes of lipid species12,14 or lipoprotein subclasses13. For example, Rhee et al. (2013) reported higher heritability estimates for amino acids than for lipids11. Essential amino acids, which cannot be synthesized by an organism de novo16, had lower heritability than non-essential amino acids11 that are synthesized within the body16. Intriguingly, phosphatidylcholines10 and triglycerides (TGs)15 show increasing heritability as the number of carbon atoms and/or double bonds in their fatty acyl side chains increases. Draisma et. al speculated this might be attributed to differences in the number of metabolic conversion rounds for phosphatidylcholines or TGs with a variable number of carbon atoms10.
An improved understanding of the genetic architecture of intermediate phenotypes such as metabolites may benefit insight into the aetiology of diseases and traits, such as cardiometabolic diseases17, migraine18, psychiatric disorders19, and cognition20. We aim to expand our understanding of the contribution of genetic factors to variation in fasting blood metabolic measures (referred to as metabolites in the remainder of the text for brevity) and analyzed data from multiple metabolomics platforms from a large cohort of twins and family members (N = 5,117). Combining SNP and family data allows for the simultaneous estimation of SNP heritability (h2SNP) and total heritability (h2total)21. We further extended this approach to estimate the proportion of variance explained by metabolite loci identified by GWAS or rare-variant analysis (h2GW-loci; Supplementary Data 1). The h2GW-loci consisted of two sub-fractions, a fraction composed of all metabolite loci associated with metabolites of a specific superclass (h2GW-Class) and a fraction composed of all other metabolite loci (h2GW-Notclass).
After characterizing all published metabolite-SNP associations by metabolite classification, we present the h2total, h2SNP and h2GW-loci results for 361 metabolites (Figure 1). Next, we further expand on the current knowledge of the genetic aetiology of metabolite classes by employing mixed-effect meta-regression models to test for differences in heritability estimates among metabolite classes and among lipid species. To distinguish between the effects of the number of carbon atoms or number of double bonds in the fatty acyl side chains of phosphatidylcholines and TGs additional univariate follow-up analyses were conducted.
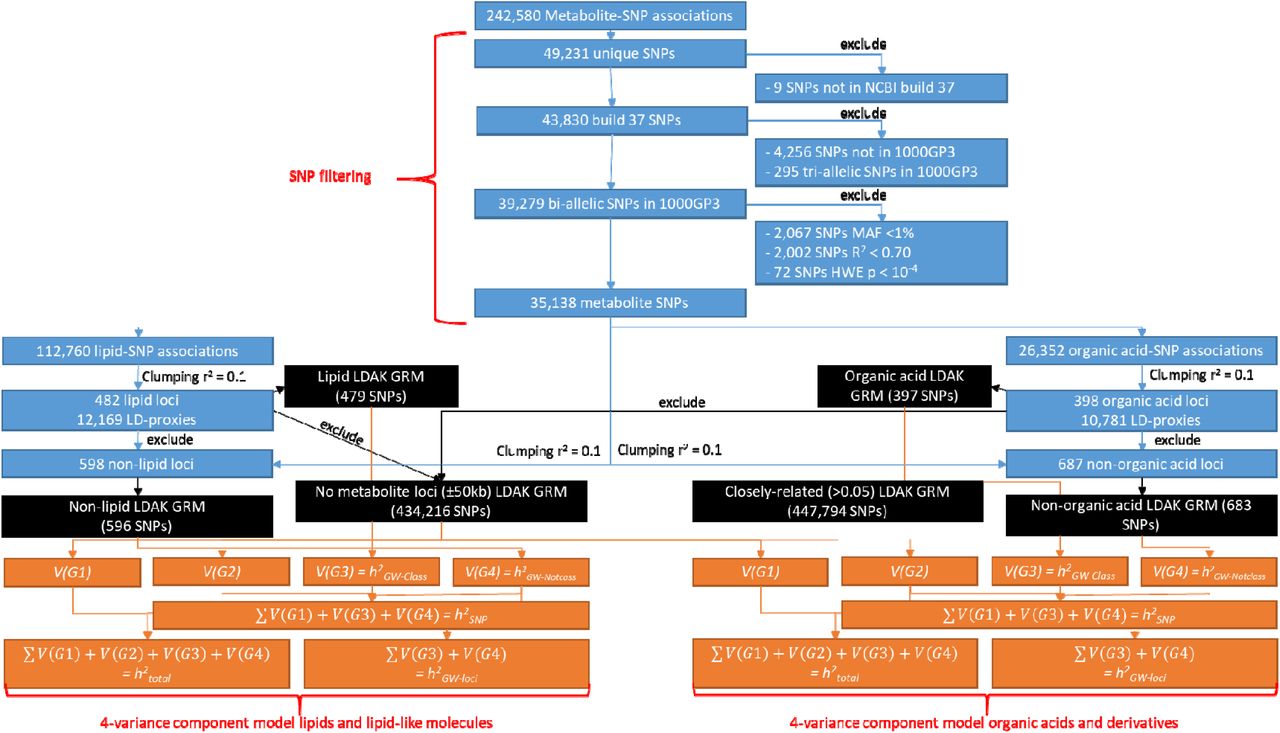
Flowchart describing the filtering of metabolite SNPs, GRM construction and 4-variance component models. This flowchart describes how the 242,580 metabolite-SNP associations as identified from GWA and rare-variant analyses (Supplementary Note 1; Supplementary Data 1) were converted to NCBI build 37, extracted for NTR participants from the 1000GP3 imputed data and filtered on MAF, HWE and R2 (blue boxes at top of the figure indicated by the red curly bracket). The metabolite-SNP associations of the filtered SNPs were clumped (r2 = 0.10) to obtain the metabolite loci and LD-proxies of the lipid and the organic acids, respectively (blue). To obtain the non-superclass loci, the superclass-specific loci and LD-proxies were removed from the overall list of metabolite-SNP associations and prior to clumping (blue). The lipid-loci, not-lipid loci, organic acid loci and not-organic acid loci give rise to four GRMs, respectively, as indicated by the black boxes and arrows in the flowchart. The two additional GRMs included in the 4-variance component GREML models are based on the cross-platform imputed SNPs (see Methods), where the lipid and organic acid loci, LD-proxies and 50 kb surrounding these SNPs have been removed from one of the cross-platform GRMs (black boxes in flowchart). The bottom part (in orange) of the flowchart describes the 4-variance component GREML model separately for the lipid and organic acid analyses (indicated by red curly brackets). To indicate which GRMs are used to calculate which variance components orange arrows have been drawn from the GRMs to the variance components. The different (combinations) of variance components give rise to the five different heritability estimates (h2total, h2SNP, h2GW-Class, h2GW-Notclass and h2GW-loci), the final part of the flowcharts provides an overview of how these heritability estimates are derived (orange).
Results
Metabolite classification
In the period of November 2008 to October 2018, 40 GWA and (exome-) sequencing studies have identified 242,580 metabolite-SNP or metabolite ratio-SNP associations (see Supplementary Note 1). These associations included 1,804 unique metabolites or ratios and 49,231 unique SNPs (43,830 after converting all SNPs to build 37; Supplementary Data 1). For all metabolites their Human Metabolome Database (HMDB)22–24 identifiers were retrieved in order to extract information with regards to their hydrophobicity and chemical classification (see Methods). Excluding the ratios and unidentified metabolites, 953 metabolites could be classified into 12 ‘super classes’ (Table 1), 43 ‘classes’, or 77 ‘subclasses’ based on the HMDB classification (Supplementary Data 1). The majority of the metabolites were classified as ‘lipids’ and ‘organic acids’. The ‘lipids’ could be subdivided into 8 classes, with 1 to 95,795 metabolite-SNP associations per class (mean = 17,589; SD = 32,553), and in 32 subclasses, with 1-40,440 metabolites-SNP associations of per subclass (mean = 4,673; SD = 9,124). The ‘organic acids and derivatives’ could be divided in 9 classes, with 1 to 26,832 metabolite-SNP associations per class (mean = 3,374; SD = 8,832), and 17 ‘organic acid’ subclasses, including 1 to 26,448 metabolite-SNP associations per subclass (mean = 1,786; SD = 6,371; Supplementary Data 1).
Overview of the number of unique metabolites, for which significant SNP-metabolite associations have been published, per Human Metabolome Database22–24 ‘super class’. See Supplementary Data 1 for an overview of the exact metabolites classified per ‘super class’, ‘class’ and ‘subclass’, as well as the SNPs associated with each metabolite.
For 5,117 individuals, data were available from four different metabolomics platforms: the Nightingale Health 1H-NMR platform, a UPLC-MS Lipidomics platform, the Leiden 1H-NMR platform and the Biocrates Absolute-IDQ™ p150 platform. All participants were registered with the Netherlands Twin Register (NTR)25 and came from 2,445 nuclear families. Metabolomics and SNP data were available for all participants. Background and demographic characteristics for the sample can be found in Table 2. Across all four platforms 427 metabolites were assessed. After excluding the ratios (17) and the metabolites of super classes not included in the curated metabolite-SNP association list (8), data were available for 402 metabolites. The 402 metabolites could be classified as 336 ‘lipids’, 53 ‘organic acids’, 9 ‘organic oxygen compounds’, 3 ‘proteins’ and one ‘organic nitrogen compound’. In the remainder of this paper we solely focus on the 369 metabolites classified as ‘lipids’ or ‘organic acids and derivatives’. The full list of metabolites, with their classifications and the quartile values of the untransformed levels, are included in Supplementary Table 1.
Participant characteristics after preprocessing per metabolomics platform. This table gives an overview of the number of individuals (N) per platform, specifies the number of families these individuals belong to and the percentage of females and twins in each dataset. In addition, for each platform the mean and standard deviation (SD) of the age at blood draw in years, the body-mass-index (BMI), the cholesterol level in mmol/l, the low-density lipoprotein cholesterol (LDL) levels in mmol/l and the highdensity lipoprotein cholesterol (HDL) levels in mmol/l are given.
Characterization of the heritable influences on lipid and organic acid levels
For the 369 metabolites that passed QC, we estimated total heritability (h2total), the proportion of phenotypic variance explained by measured SNPs (h2SNP), the proportion attributable to metabolite superclass-specific loci (h2GW-Class) and the proportion of variance attributable to non-superclass metabolite loci (h2GW-Notclass) in twin and family members. The four-variance component analyses were performed in the genome-wide complex trait analysis (GCTA) software26. The analyses were performed separately for ‘lipids’ and ‘organic acids’, using unique superclass-specific and non-superclass genetic relationship matrices (GRMs; created in LDAK27,28) in both sets of analyses (Figure 1). The ‘lipid’ analyses employed a superclass-specific GRM of 479 ‘lipid’ loci and a non-superclass GRM including 596 SNPs (Figure 1). The ‘organic acid’ analyses included a superclass-specific GRM with 397 loci and a non-superclass GRM with 683 SNPs (Figure 1). Before analyses, the metabolite data were normalized (log-normal or inverse rank; see Methods). All models included age at blood draw, sex, the first 10 principal components (PCs) from SNP genotype data, genotyping chip and metabolomics measurement batch as covariates.
Supplementary Table 2 includes the estimates for h2total, h2SNP, and h2GW-loci from the four-variance genetic component model for all 369 metabolites. The genomic relatedness matrix residual maximum likelihood (GREML) algorithm converged successfully for 361 (97.8%) of the 53 ‘organic acids’ and 316 ‘lipids’. Poor convergence of the GREML algorithm was observed for 6 metabolites (1.6%). The analyses for 2 metabolites (0.5%) were not completed due to non-invertible variance-covariance matrices. The estimates for h2total of the 309 ‘lipids’ ranged from 0.11 to 0.66 (mean = 0.47; mean s.e. = 0.04). The h2SNP estimates ranged from −0.54 to 0.71 (mean = 0.05; mean s.e. = 0.24). The estimates for h2GW-loci ranged from −0.05 to 0.16 (mean = 0.06; mean s.e. = 0.03; Table 3). The 52 ‘organic acids’ had h2total estimates ranging from 0.14 to 0.72 (mean = 0.41; mean s.e. = 0.04). The estimates for h2SNP ranged from −0.42 to 0.46 (mean = 0.05; mean s.e. = 0.24) and for h2GW-loci ranged from −0.08 to 0.11 (mean = 0.01; mean s.e. = 0.02; Table 3). On average, for both ‘lipids’ and ‘organic acids’ the h2class was higher than the h2Notclass, with h2GW-Class ranging from −0.02 to 0.16 (0.06; mean s.e. = 0.02) for ‘lipids’ and from −0.04 to 0.14 for ‘organic acids’ (mean = 0.01; mean s.e. = 0.02). For both ‘lipids’ and ‘organic acids’ h2GW-Notclass was zero (mean s.e. = 0.02), ranging from −0.06 to 0.12 for ‘lipids’ and from −0.06 to 0.05 for ‘organic acids’ (Table 3).
Summary of the heritability estimates of the four-variance component models for the 309 ‘lipids’ and the 52 ‘organic acids’ analyzed across all four metabolomics platforms. The mean, median and range of the total heritability (h2total), SNP heritability (h2snp), heritability based on the 479 significant metabolite loci for the ‘lipids’ or the 397 significant metabolite loci for the ‘organic acids’ (h2GW-Class), the 596-683 significant metabolite loci not belonging to these classes (h2GW-Notclass) and the total heritability explained by metabolite loci (e.g., sum of h2GW-Class and h2GW-Notclass: h2GW-loci), as well as their standard errors (s.e.’s), are depicted for all 361 successfully analyzed metabolites as included on all platforms. Supplementary Table 1 denotes which metabolites belong to each class.
Including multiple metabolomics platforms allowed for a comparison of metabolites as measured on multiple platforms. An earlier study showed 29 out of 43 overlapping metabolites across two platforms to exhibit moderate heritability on both platforms29. In the current study, 61 metabolites were measured on multiple platforms, with moderate h2total on each of the platforms and on average a medium positive correlation between the h2total of the same metabolite assessed on different platforms (mean r h2total = 0.36; Supplementary Table 3).
Differential heritability among metabolite classes and lipid-species
Figure 2 shows variation in median heritability among the different classes of ‘organic acids’: ‘keto acids’, ‘hydroxy acids’ and ‘carboxylic acids’ (see Supplementary Table 1 for metabolites per class). ‘Keto acids’, followed by ‘carboxylic acids’, had the highest median h2total, h2SNP and h2GW-Class estimates (Figure 2). While ‘hydroxy acids’ had the highest median h2GW-Notclass and h2GW-loci estimates, the lowest median h2total, h2SNP and h2GW-Class estimates were observed for these metabolites (Figure 2). To investigate whether heritability differs significantly among classes of ‘organic acids’, we applied multivariate mixed-effect meta-regression, corrected for metabolite platform effects (see Methods). The multivariate mixed-effect meta-regression models showed that h2total and h2GW-Class for the ‘organic acid’ classes did not differ significantly. Significant differences among the ‘organic acid’ classes, though, were observed for the h2SNP estimates (F(4, 47) = 7.48, FDR-adjusted p-value = 0.02), the h2GW-loci estimates (F(4, 47) = 3.44, FDR-adjusted p-value = 0.03), and the h2GW-Notclass estimates (F(4,47) = 19.95, FDR-adjusted p-value = 1.25×10−08; Supplementary Table 4).

Heritability of all 52 ‘carboxylic acids and derivatives’ successfully analyzed across all four metabolomics platforms by class. Box- and dotplots of the h2total, h2SNP and h2GW-loci for all 52 successfully analyzed ‘carboxylic acids and derivatives’ by class. The left-hand side of the figure is a close-up of the −0.08 – 0.15 part of the heritability range, focusing on the h2GW-Class and h2GW-NotClass estimates. The boxes denote the 25th and 75th percentile (bottom and top of box), and median value (horizontal band inside box). The whiskers indicate the values observed within up to 1.5 times the interquartile range above and below the box.
The multivariate mixed-effect meta-regressions were also applied to assess the significance of heritability differences among essential and non-essential amino acids (subdivision of ‘carboxylic acids’; see Supplementary Table 5) and among ‘lipid’ classes (see Supplementary Table 1 for metabolites per ‘lipid’ class). None of the observed mean differences among essential and non-essential amino acids (Table 4) were significant in the meta-regressions (Supplementary Table 4). Small but significant median heritability differences were observed among the different classes of ‘lipids’ (Figure 3). For ‘lipid’ classes the h2GW-loci estimates differed significantly (F(8, 300) = 8.47; FDR-adjusted p-value = 0.004; Supplementary Table 4).
Summary of the heritability estimates of the four-variance component models for the 17 essential and the 14 non-essential amino acids analyzed across all four metabolomics platforms. The mean, median and range of the total heritability (h2total), SNP heritability (h2snp) and heritability based on the 397 significant metabolite loci for the ‘organic acids’ (h2GW-Class), the 683 significant metabolite loci not belonging to this class (h2GW-Notclass) and the total heritability explained by metabolite loci (e.g., sum of h2GW-Class and h2GW-Notclass: h2GW-loci), as well as their standard errors (s.e.’s), are depicted for all 31 successfully analyzed essential and non-essential amino acids as included on all platforms. Supplementary Table 1 denotes which metabolites belong to each class.

Heritability of all 309 ed ‘lipids’ successfully analyzed across all four metabolomics platforms by class. Box- and dotplots of the h2total, h2SNP and h2GW-loci for all 309 successfully analyzed ‘lipids’ by class. The left-hand side of the figure is a close-up of the −0.06 – 0.17 part of the heritability range, focusing on the h2GW-Class and h2GW-NotClass estimates. The boxes denote the 25th and 75th percentile (bottom and top of box), and median value (horizontal band inside box). The whiskers indicate the values observed within up to 1.5 times the interquartile range above and below the box.
Finally, we explored whether heritability of phosphatidylcholines and TGs increases with a larger number of carbon atoms and/or double bonds in their fatty acyl side chains. To this end we employed both uni- and multivariate mixed-effect meta-regression models separately for the TGs, diacyl phosphatidylcholines (PCaa) and acyl-alkyl phosphatidylcholines (PCae; see Methods). The platform specific heritability estimates for each of these lipid species has been depicted in Supplementary Figure 1. Variation in the number of carbon atoms and double bonds was significantly associated with h2GW-loci estimates for PCaa’s (F(3, 52) = 7.05; FDR-adjusted p-value = 0.009) and PCae’s (F(3, 45) = 3.41; FDR-adjusted p-value = 0.05; Supplementary Table 4). Phosphatidylcholines with a larger number of carbon atoms showed lower heritability estimates and phosphatidylcholines with a larger number of double bonds had higher heritability estimates (Supplementary Table 4). The differences among the phosphatidylcholines with a variable number of carbon atoms and/or double bonds could be contributed to differential h2Class estimates. Univariate models confirmed the pattern for the number of double bonds in PCaa’s and PCae, though they were not significant after correction for multiple testing (Supplementary Table 6).
Discussion
We carried out a comprehensive assessment of GWA-metabolomics studies and created a repository of all studies reporting on associations of SNPs and blood metabolites in European ancestry samples. This led to 241,965 genome-wide associations that were curated, lifted to NCBI build 37 and for which all associated metabolites were classified. The complete, categorized, overview of all blood metabolite-SNP associations is provided in Supplementary Data 1, with the complete list of references in Supplementary Note 1. The information from the repository served to construct six GRMs which then served as predictors in the analysis of 369 metabolites. The metabolite data in our study derived from four metabolomics platforms and two metabolite super classes. By mapping all metabolites to the Human Metabolome Database (HMDB)22–24 we were able to classify both the measured metabolites and all previously published metabolites as either ‘lipids’ or ‘organic acids’. Because the participants in the study (N = 5,117) came from a large cohort of MZ and DZ twin-families we could evaluate the total heritability (h2total) and the contributions of genome-wide SNPs (h2SNP) on ‘lipids’ and ‘organic acids’. A unique feature of the study was the ability to disentangle the role of superclass-specific (h2GW-Class) and non-superclass (h2GW-Notclass) metabolite loci on heritability differences among metabolite classes and lipid species.
To evaluate differences among metabolite classes and lipid species in the estimates for h2total, h2SNP, h2GW-loci, h2GW-Class, and h2GW-Notclass multivariate mixed-effect meta-regression models were applied. No significant differences in h2total estimates existed among any of the metabolite classes. Congruent with a previous twin-family study9, none of the heritability estimates differed significantly among essential and non-essential amino acids. Both h2SNP and h2GW-loci showed significant differences among the different classes of ‘organic acids’. ‘Keto acids’ had significantly higher h2SNP and significantly lower h2GW-loci estimates as compared with ‘carboxylic acids’. Class-specific metabolite loci heritability estimates for ‘fatty acyls’, ‘lipoproteins’ and ‘steroids’ were significantly higher. Similarly, significant heterogeneity in lipid class heritability, with lower h2total and h2SNP for phospholipids than for sphingolipids or glycerolipids has been described12,14,30. Lastly, we assessed whether heritability increases with added complexity in lipid species10,15. We found that this indeed held for h2GW-loci estimates in more complex diacyl and acyl-alkyl phosphatidylcholines but not for more complex TGs. Previous research reported significant higher h2SNP estimates in polyunsaturated fatty acid containing lipids14. Furthermore, loci of traditional lipid measures explained 2% to 21% of the variance in lipid levels14. Together these results suggest that higher heritability in phosphatidylcholines is driven by a lower number of carbon atoms and higher number of double bonds, e.g. a larger degree of unsaturation.
Evaluating the mean heritability differences among ‘lipids’ and ‘organic acids’ it appears that ‘lipids’ have higher h2total, h2GW-Class and h2GW-loci estimates than ‘organic acids’ (Table 3). However, as the GRMs used in the calculation of the heritability estimates differed among these classes, we were unable to empirically compare mean differences. Comparison of our findings with those of previous twin-family studies indicates that the heritability difference among ‘lipids’ and ‘organic acid’ is infrequently investigated8–11. A possible explanation for the lack of comparisons may be the shortage of balanced metabolomics platforms. The majority of metabolomics platforms have a strong focus on either ‘lipids’ or ‘organic acids’, which complicates such comparisons. The disproportion of metabolite classes on metabolomics platforms also affects the known metabolite loci, where ‘lipid’ studies have been overrepresented as well. As a consequence, especially the h2GW-Class and h2GW-loci estimates of the ‘organic acids’ will be underpowered due to this imbalance. For multi-component GREML our platform-specific sample sizes were relatively small31. Only the Nightingale Health 1H-NMR platform was sufficiently powered to obtain small s.e.’s in single-component GREML using unrelated individuals with common SNPs32. New30,33–35 and future studies will increase the number of variants identified as metabolite loci. The investment in UK Biobank36 is expected to dramatically increase sample sizes for large-scale genomic investigations of the human metabolome and subsequently the number of metabolite loci.
Applications such as two-sample Mendelian Randomization benefit greatly from the comprehensive overview of metabolite loci we identified. The identified loci are interesting to explore as instruments for metabolome-wide Mendelian Randomization studies of complex traits. Our work further offers valuable insights into the role of common genetic variants in class specific differences among metabolite classes and lipids species. Further research is required to elucidate the contribution of rare genetic variants to metabolite levels and differences among metabolite classes. A reasonable approach to tackle this issue could be to carry out a similar study in a large sample of whole-genome sequencing (WGS) data. Such an approach, using MAF- and LD-stratified GREML analysis31, identified additional variance due to rare variants for height and BMI37. The extent to which our findings might generalize to populations of non-European ancestry is uncertain, with replication among different ethnicities being more likely for loci of common human metabolism pathways38.
In conclusion, we contributed to the further elucidation of the genetic architecture of fasting blood metabolite levels and to differences in the genetic architecture among metabolite classes. Extending the GREML framework with the inclusion of known metabolite loci allowed us to simultaneously estimate h2total, h2SNP, h2GW-Class and h2GW-Notclass for 361 metabolites. Significant differences in h2SNP or h2GW-loci estimates were observed among different classes of ‘lipids’ and ‘organic acids’ and for more complex diacyl and acyl-alkyl phosphatidylcholines. Future studies need to also elucidate the proportion of metabolite variation influenced by heritable and non-heritable lifestyle factors, which may help delineate new personalized disease prevention or treatment strategies for complex disorders.
Methods
Participants
At the Netherlands Twin Register (NTR)39 metabolomics data for twins and family members as measured in blood samples were available for 6,011 individuals of whom 5,667 were genotyped. The blood samples for the four metabolomics experiments described in this study were mainly collected in participants of the NTR biobank project25,40. Blood samples were collected after a minimum of two hours of fasting (1.3%), with the majority of the samples collected after overnight fasting (98.7%). Fertile women were bled in their pill-free week or on day 2-4 of their menstrual cycle. For the current paper, we excluded participants if they were not of European ancestry, were on lipid-lowering medication at the time of blood draw or if they had not adhered to the fasting protocol. The exact number of exclusions per dataset is listed in Supplementary Table 7. After completing the preprocessing of the metabolomics data, the separate subsets (e.g., different collection and measurement waves; see Supplementary Table 7) of each platform were merged into a single per platform dataset, randomly retaining a single observation per platform whenever multiple observations were available. Supplementary Table 8 gives an overview of the overlap in participants among the different platforms, with the overlap among each metabolite that survived quality control (QC) for all four platforms available in Supplementary Table 9. The final number of participants included in the study was 5,117, with platform specific sample size ranging from 1,448 to 4,227 individuals from 946 to 2,179 families. Characteristics for the individuals included in the analyses can be found in Table 2. Informed consent was obtained from all participants. Projects were approved by the Central Ethics Committee on Research Involving Human Subjects of the VU University Medical Centre, Amsterdam, an Institutional Review Board certified by the U.S. Office of Human Research Protections (IRB number IRB00002991 under Federal-wide Assurance-FWA00017598; IRB/institute codes, NTR 03-180 and EMIF-AD 2014.210).
Metabolite profiling
Nightingale Health 1H-NMR platform
Metabolic biomarkers were quantified from plasma samples using high-throughput proton nuclear magnetic resonance spectroscopy (1H-NMR) metabolomics (Nightingale Health Ltd, Helsinki, Finland; formerly Brainshake Ltd.). This method provides simultaneous quantification of routine lipids, lipoprotein subclass profiling with lipid concentrations within 14 subclasses, fatty acid composition, and various low-molecular weight metabolites including amino acids, ketone bodies and glycolysis-related metabolites in molar concentration units. Details of the experimentation and epidemiological applications of the NMR metabolomics platform have been reviewed previously41,42.
UPLC-MS lipidomics platform
Plasma lipid profiling was performed at the division of Analytical Biosciences at the Leiden Academic Center for Drug Research at Leiden University/Netherlands Metabolomics Centre. The lipids were analyzed with an Ultra-High Performance Liquid Chromatograph directly coupled to an Electrospray Ionization Quadruple Time-of-Flight high resolution mass spectrometer (UPLC-ESI-Q-TOF; Agilent 6530, San Jose, CA, USA) that uses reference mass correction. For liquid chromatographic separation a ACQUITY UPLC HSS T3 column (1.8μm, 2.1 ∗ 100mm) was used with a flow of 0.4 ml/min over a 16 minute gradient. Lipid detection was done using a full scan in the positive ion mode. The raw MS data were pre-processed using Agilent MassHunter Quantitative Analysis software (Agilent, Version B.04.00). Detailed descriptions of lipid profiling and quantification have been described previously43,44.
Leiden 1H-NMR platform (for small metabolites)
The Leiden 1H-NMR spectroscopy experiment of EDTA-plasma samples used a 600 MHz Bruker Advance spectrometer (Bruker BioSpin, Karlsruhe, Germany). The peak deconvolution method used for this platform has been previously described45.
Biocrates Absolute-IDQ™ p150 platform
The Biocrates Absolute-IDQ™ p150 (Biocrates Life Sciences AG, Innsbruck, Austria) metabolomics platform on serum samples was analysed at the Metabolomics Facility of the Genome Analysis Centre at the Helmholtz Centre in Munich, Germany. This platform utilizes flow injection analysis coupled to tandem mass spectrometry (MS/MS) and has been described in detail elsewhere3,46,47.
Metabolomics data preprocessing
Preprocessing of the metabolomics data was done for each of the platforms and measurement batches per platform separately. Metabolites were excluded from analysis when the mean coefficient of variation exceeded 25% and the missing rate exceeded 5%. Metabolite measurements were set to missing if they were below the lower limit of detection or quantification or could be classified as an outlier (five standard deviations greater or smaller than the mean). Metabolite measurements that were set to missing because they fell below the limit of detection/quantification were imputed with half of the value of this limit, or when this limit was unknown with half of the lowest observed level for this metabolite. All remaining missing values were imputed using multivariate imputation by chained equations (‘mice’)48. On average, 9 values had to be imputed for each metabolites (SD = 12; range: 1-151). Data for each metabolite on both 1H-NMR platforms were normalized by inverse normal rank transformation45,49, while the imputed values of the Biocrates metabolomics platform and the UPLC-MS lipidomics platform were normalized by natural logarithm transformation10,50, conform previous normalization strategies applied to the data obtained using these platforms. The complete lists with full names of all detected metabolites that survived QC and preprocessing for all platforms can be found in Supplementary Table 1, these tables also include the quartile values of the untransformed metabolites.
Genotyping, imputation and ancestry outlier detection
Genotype information was available for 21,001 NTR participants for 6 different genotyping arrays (Affymetrix 6.0 [N = 8,640], Perlegen-Affymetrix [N = 1,238], Illumina Human Quad Bead 660 [N = 1,439], Affymetrix Axiom [N = 3,144], Illumnia GSA [N = 5,938] and Illumina Omni Express 1M [N =238]), as well as sequence data from the Netherlands reference genome project GONL (BGI full sequence at 12x (N = 364)51. For each genotyping array samples were removed if they had a genotype call rate above 90%, gender-mismatch occurred or if heterozygosity (Plink F statistic) fell outside the range of −0.10 – 0.10. SNPs removed if they were palindromic AT/GC SNPs with a minor allele frequency (MAF) range between 0.4 and 0.5, when the MAF was below 0.01, when Hardy Weinberg Equilibrium (HWE) had p < 10−5, when the number of Mendelian errors was greater than 20 and the genotype call rate was < 0.95. After QC the six genotyping arrays were aligned to the GONL reference set (V4) and SNPs were removed if the alleles mismatched with this reference panel or the allele frequency different more than 0.10 between the genotyping array and this reference set.
The data from the six genotyping chips were subsequently merged into a single dataset (1,781,526 SNPs). Identity-by-decent (IBD) was estimated with PLINK52 and KING53 for all individual pairs based on the ~10.6K SNPs in common across the arrays, next IBD was compared to expected family relations and individuals were removed if this mismatched. Prior to imputation to the GONL reference data54,55 the duplicate monozygotic pairs (N = 3,032) or trios (N = 7) and NTR GONL samples (N = 364) were removed and the data was cross-array phased using MACH-ADMIX56. Post-imputation the NTR GONL samples and the duplicated MZ pairs and trios were re-added to the data. Filtering of the imputed dataset included the removal of SNPs that were significantly associated with a single genotyping chip (p < 10−5), had HWE p < 10−5, the Mendelian error rate > mean + 3 SD or if the imputation quality (R2) was below 0.90. The final cross-platform imputed dataset included 1,314,639 SNPs, including 20,792 SNPs on the X-chromosome.
The cross-platform imputed data was aligned with PERL based “HRC or 1000G Imputation preparation and checking” tool (version 4.2.5; https://www.well.ox.ac.uk/~wrayner/tools). The remaining 1,302481 SNPs were phased with EAGLE57 for the autosomes, and SHAPEIT58 for chromosome X and then imputed to 1000 Genomes Phase 3 (1000GP3 version 5)59 on the Michigan Imputation server using Minimac3 following the standard imputation procedures of the server60. Principal Component Analysis (PCA) was used to project the first 10 PCs of the 1000 genomes references set population on the NTR cross-platform imputed data using SMARTPCA61. Ancestry outliers (non-Dutch ancestry; N = 1,823) were defined as individuals with PC values outside the European/British population range62. After ancestry outlier removal the first 10 PCs were recalculated.
Curation of metabolite loci
In October 2018 PubMed and Google Scholar were searched to identify published GWA and (exome-) sequencing studies on metabolomics or fatty acid metabolism in blood samples using 1H-NMR, mass spectrometry or gas chromatography-based methods. In the period of November 2008 to October 2018 40 GWA or (exome-) sequencing studies on blood metabolomics in European samples have been published (Supplementary Note 1). For all studies the genome-wide significant (p < 5×10⁻⁸) metabolite-SNP associations were extracted, including only those observations for autosomal SNPs and reporting SNP effect sizes and p-values based on the summary statistics excluding NTR samples were relevant49,50. Across the 40 studies, 242,580 metabolite-SNP or metabolite ratio-SNP associations were reported, these associations included 1,804 unique metabolites or ratios and 49,231 unique SNPs (Supplementary Data 1). For all metabolites their Human Metabolome Database (HMDB)22–24, PubChem63, Chemical Entities of Biological Interest (ChEBI)64 and International Chemical Identifier (InChiKey)65 identifiers have been retrieved. Information with regards to the ‘super class’, ‘class’ and ‘subclass’ of metabolites was extracted from HMDB, whenever no HMDB identifier was available and categorization information could not be extracted, ‘super class’, ‘class’ and ‘subclass’ were provided based on expert opinion. Excluding the ratios and unidentified metabolites, 953 metabolites could be classified into 12 ‘super classes’, 43 ‘classes’ or 77 ‘subclasses’ (Supplementary Data 1). Based on the metabolite identifiers we also extracted the log(S) value for each metabolite to assess the hydrophobicity of the metabolites. The log(S) value represents the log of the partition coefficient between 1-octanol and water, two fluids that hardly mix. The partition coefficient is the ratio of concentrations in water and in octanol when a substance is added to an octanol-water mixture and hence indicates the hydrophobicity of a compound. Thus, we classify a metabolite as hydrophobic if it is more hydrophobic than 1-octanol itself and hydrophilic otherwise (Supplementary Data 1).
The 49,231 unique SNPs reported their rsIDs or chromosome-base pair positions by different genome builds or dbSNP maps66, therefore we lifted all SNPs to HG19 build 3767, after which 43,830 unique SNPs remained (Figure 1; Supplementary Data 1). All bi-allelic metabolite SNPs were extracted from our 1000GP3 data, which excluded 295 tri-allelic SNPs and 4,256 SNPs could not be retrieved from 1000GP3. Next, MAF > 1% (2,067 SNPs removed), R2 > 0.70 (2,002 SNPs) and HWE P < 10−4 (72 SNPs) filtering was performed, resulting in 35,138 metabolite SNPs for NTR participants (Figure 1). Next, we created two ‘super class’-specific lists of metabolite loci and two ‘not-superclass’ lists of metabolite loci. To create a list of loci for the 652 unique metabolites classified as ‘lipids and lipid-like molecules’ (e.g., ‘lipids’), in 2,500 unrelated individuals we clumped (PLINK version 1.9) all 112,760 lipid-SNP associations using an LD-threshold (r2) of 0.10 in a 500kb radius (Figure 1). Clumping identified 482 lead SNPs, or loci, for ‘lipids’ and an additional 12,169 SNPs were identified as LD-proxies for the lipid-loci (Figure 1). To obtain the ‘not-superclass’ list of lipid loci the 12,651 lipid loci and proxies were removed from the list of all metabolite-SNP associations and the resulting list was clumped to obtain the 598 ‘non-superclass’ loci (Figure 1). The same clumping procedure was applied to the 26,352 organic acid-SNP associations, identifying 398 organic acids loci, 10,781 organic acid LD-proxies and 687 ‘non-superclass’ loci (Figure 1).
Construction of genetic relationship matrices
In total six weighted genetic relationship matrixes (GRMs) were constructed, which were corrected for uneven and long-range LD between the SNPs (LDAK version 4.927,28; Figure 1). In Supplementary Note2 the use of weighted versus unweighted GRMs is compared using simulations. Two of the GRMs used the cross-platform imputed dataset as backbone and the other four GRMs were based on SNPs extracted from the 1000GP3 imputed data. For inclusion in the first GRM, after removal of ancestry outliers, the autosomal SNPs of the cross-platform imputed dataset were filtered on MAF (<1%) and all lipid and organic acid loci, their LD-proxies and 50kb surrounding both types of SNPs were removed (see curation of metabolite loci; Figure 1). The resulting LDAK GRM included 434,216 SNPs and the V(G1) variance component in the genomic relatedness matrix residual maximum likelihood (GREML) analyses is based on this GRM (see heritability analyses; Figure 1). The V(G2) variance component in the GREML analyses is based on the LDAK GRM including all autosomal SNPs with a MAF greater than 1% included on the cross-platform imputed dataset (447,794 SNPs), where ancestry outliers were removed and for all individual pairs sharing less than 0.05 of their genome their sharing was set to zero21 (Figure 1). Depending on the metabolite the V(G3) variance component in the GREML analyses was either based on an LDAK GRM of the 1000GP3 extracted lipid loci (479 SNPs) or the organic acid loci (397 SNPs; Figure 1). Finally, depending on the metabolite either the ‘not-lipid’ LDAK GRM (596 SNPs) or the ‘not-organic acid’ LDAK GRM (683 SNPs) underlay the V(G4) variance component in the GREML analyses (Figure 1). Supplementary Data 1 indicates for each listed SNP if it was included in any of the LDAK GRMs.
Statistical analyses
Heritability analyses
Mixed linear models21, implemented in the genome-wide complex trait analysis (GCTA) software package (version 1.91.7)26, were applied to compare three models including a variable number of covariates. Supplementary Table 10 gives the three different models, full descriptions of the covariates and model comparison have been given in Supplementary Note 3. The mean and median h2total and h2SNP estimates and standard errors were highly similar across the different models, as such the most sparse model was chosen for further analyses (Supplementary Table 11). This final model included the first 10 genetic PCs for the Dutch population, genotyping chip, sex and age at blood draw as covariates. For metabolites of the Nightingale Health 1H-NMR and Biocrates platform, measurement batch was included as covariate.
The final four-variance component model including four GRMs, allowing the estimation of the proportion of variation explained by superclass-specific significant metabolite loci (h2GW-Class) and non-superclass significant metabolite loci (h2GW-Notclass) in addition to estimating the h2SNP and total h2 (h2total; Figure 1). In this extension, the total variance explained by significant metabolite loci (h2GW-loci) consists of the sum of  and
and  , where Vp is the phenotypic variance and h2SNP is defined as the sum of
  and
and  (Figure 1). To calculate the standard errors (s.e.’s) for the composite variance estimates, we have randomly sampled 10,000 instances from the parameter variance-covariance matrices for each metabolite. The s.e.’s of the specific ratio of interest were then based on the standard deviation of the ratio of interest across 10.000 samples. The four-variance component models obtained the unconstrained variance components which allowed for negative h2SNP and h2GW-loci estimates. All four-variance component models applied the --reml-bendV flag where necessary to invert the variance-covariance matrix V if V was not positive definite, which may occur when variance components are negative68. Finally, we calculated the log likelihood of a reduced model with either V(G3), V(G4) or both dropped from the full model and calculated the LRT and p-value (Supplementary Table 2).
Mixed-effect meta-regression analyses
To investigate differences in heritability estimates among metabolites of different classes we applied mixed-effect meta-regression models as implemented in the ‘metafor’ package (version 2.0-0) in R (version 3.5.1)69. Here we tested for the moderation of heritability estimates by metabolite class and metabolomics platform on all 361 successfully analyzed metabolites while including a matrix combining the phenotypic correlations (Supplementary Table 12) and the sample overlap (Supplementary Table 9) between the metabolites as random factor to correct for dependence among the metabolites and participants. This matrix includes the sample size of the metabolite on the diagonal, with the off-diagonal computed by  (Supplementary Table 13), where N1,2 is the sample overlap between the metabolites, n1 is the sample size of metabolite one, n2 is the sample size of metabolite two and r is the phenotypic correlation between the metabolites as calculated with Spearman’s Rho. For all mixed-effect meta-regression models we obtained the robust estimates based on a sandwich-type estimator, clustered by the metabolites included in the models to correct for the sample overlap among the different metabolites70. First, we used multivariate mixed-effect meta-regression models to simultaneously estimate the effect of metabolite class and metabolomics platform on the h2total, h2SNP and the h2GW-loci, as well as the h2GW-Class and h2GW-Notclass estimates. Subsequently, to separately assess the effect of the number of carbon atoms or double bonds in the fatty acyls chains of phosphatidylcholines and triglycerides univariate models were conducted as follow-up. To account for multiple testing the p-values were adjusted with the with the False Discovery Rate (FDR)71 using the ‘p.adjust’ function in R. Multiple testing correction was done separately for the univariate and the multivariate models.
Data availability
The curated list of all published metabolite-SNP associations is included in Supplementary Data 1 and is publicly available through the BBMRI – omics atlas (http://bbmri.researchlumc.nl/atlas/#data). All information on the metabolites in this study are in Supplementary Table 1; with full summary statistics for the four-variance component models included in Supplementary Table 2. The Nightingale Health metabolomics data may be requested through BBMRI-NL (https://www.bbmri.nl/Omics-metabolomics). All (other) data may be accessed, upon approval of the data access committee, through the Netherlands Twin Register (ntr.fgb{at}vu.nl). A reporting summary for this Article is available as Supplementary Information file.
Funding
This work was performed within the framework of the BBMRI Metabolomics Consortium funded by BBMRI-NL, a research infrastructure financed by the Dutch government (NWO, no. 184.021.007 and 184.033.111). The European Network of Genomic and Genetic Epidemiology (ENGAGE) contributed to funding to perform the Biocrates Absolute-IDQ™ p150 metabolomics measurements (European Union Seventh Framework Program: FP7/2007-2013, grant number 201413). Analyses were supported by the Netherlands Organization for Scientific Research: Netherlands Twin Registry Repository: researching the interplay between genome and environment (480-15-001/674); the European Union Seventh Framework Program (FP7/2007-2013): ACTION Consortium (Aggression in Children: Unravelling gene-environment interplay to inform Treatment and InterventiON strategies; grant number 602768). Genotyping was made possible by grants from NWO/SPI 56-464-14192, Genetic Association Information Network (GAIN) of the Foundation for the National Institutes of Health, Rutgers University Cell and DNA Repository (NIMH U24 MH068457-06), the Avera Institute, Sioux Falls (USA) and the National Institutes of Health (NIH R01 HD042157-01A1, MH081802, Grand Opportunity grants 1RC2 MH089951 and 1RC2 MH089995) and European Research Council (ERC-230374). EMIF-AD has received support from the EU/EFPIA Innovative Medicines Initiative Joint Undertaking EMIF grant agreement n°115372. DIB acknowledges her KNAW Academy Professor Award (PAH/6635). M.Bartels is supported by an ERC consolidator grant (WELL-BEING 771057 PI Bartels).
Author contributions
Nightingale Health metabolomics data: HES, MBeekman, PES and CMvD. Leiden 1H-NMR metabolomics data: KWvD and AV. UPLC-MS lipidomics data: ACH and TH. EMIF-AD data: AdB and PJV. Genotype data: JJH, AA and IOF. NTR Biobank data: GW and EJCdG. Metabolomics pre-processing: RP, HHMD and FAH. Statistical analyses: FAH and MGN. Wrote the paper: FAH, JvD, MBartels, MGN and DIB. All authors critically read and commented on the manuscript.
Competing interests statement
The authors declare no competing financial interests.
Acknowledgements
We thank all twins and family members for their participation. We thank P. M. Visscher (University of Queensland) for his helpful comments. Preliminary analyses of this paper were included in a presentation at the 46th Annual Meeting of the Behavioral Genetics Association (BGA) in June 2016, the abstract of this presentation can be found in Behav. Genet. (2016) 46:785-786.
Footnotes
↵10 Members of the BBMRI Metabolomics Consortium are listed before the references
References


