

ABSTRACT
Resolving whole-brain images of neuronal gene expression or neuronal activity patterns, to the level of single-neuron types with defined identities, represents a major challenge. We describe here the development and use of a multicolor Caenorhabditis elegans transgene, called “NeuroPAL” (a Neuronal Polychromatic Atlas of Landmarks), to resolve unique neural identities in whole-brain images. NeuroPAL worms share a stereotypical multicolor map, permitting complete, unambiguous and automated determination of individual neuron identities in conjunction with GCaMP-based neuronal activity reporters and GFP/YFP/CFP gene-expression reporters. To demonstrate the method and its potential, we use NeuroPAL and GFP-based reporters to map expression for the whole family of metabotropic acetylcholine, glutamate, and GABA neurotransmitter receptors encoded in the C. elegans genome, revealing a vast number of potential molecular connections that go far beyond the anatomically-defined connectome. We then expand the technique to whole-brain activity, employing NeuroPAL and a panneuronal neural-activity sensor (GCaMP6s) for functional analysis. Using this tool we delineate extensive nervous system activity patterns in response to several stimuli with single, identified neuron resolution. We find that attractive odors sensed by the same neuron class exhibit dissimilar activity patterns implying that, despite their shared valence and stimulus modality, these odors drive distinct neural circuitry. Our results also indicate that the connectome is a poor predictor of functional activity, emphasizing the need for comprehensive brain-activity recordings that delineate behavior-specific circuitry. Lastly, we illustrate the NeuroPAL as an unbiased analysis tool for investigating neuronal cell fate in specific mutant backgrounds. With these applications in mind, we establish a high-throughput software pipeline for automated and semi-automated cell identification using NeuroPAL. In conclusion, we demonstrate the power of the NeuroPAL as a tool for decoding whole-brain gene expression and maps of functional activity.
INTRODUCTION
Whole-brain imaging and molecular profiling have provided extensive insights into brain development and function. One inherent problem in these activity and expression mapping pursuits is the inability to broadly resolve unique neuronal identities therein and, consequently, such datasets are commonly collapsed into relatively large, regionalized ensembles. The model organism Caenorhabditis elegans affords a unique opportunity to unite global brain measurements with the properties of their distinct, underlying neuronal composition. All adult hermaphrodite worms have a stereotyped set of 302 neurons that arise from invariant lineages (Sulston, 1983; White et al., 1986). The small size of the nervous system enabled a compete mapping of its connectome via serial-section electron microscopy (Cook et al., 2019; White et al., 1986). However, neurons are densely packed and composite reconstructions of the nervous system from different animals indicate variability in position of at least some neuronal cell bodies. Hence, previous whole-brain imaging in C. elegans have not been able to resolve the complete set of neural activity patterns (Kato et al., 2015; Kotera et al., 2016; Nguyen et al., 2016; Venkatachalam et al., 2016). Similarly, the analysis of gene-expression profiles in the nervous system using fluorescent reporters, the principal means by which gene-expression patterns are determined in C. elegans (Boulin et al., 2006; Chalfie et al., 1994; Fire et al., 1990), necessitates substantial expertise. Even with such expertise, laborious cross validation with specific landmark strains is often required and several neurons lack well-established reporters for their identification. These limitations have affected the robustness and breadth of gene-expression analysis in the worm nervous system.
An animal strain wherein every neuron’s unique identity is readily identifiable from whole-brain images would solve these problems, empowering researchers to fully exploit the many distinctive advantages of the C. elegans model system. We describe here the development of a strain, harboring a transgene that we call NeuroPAL (Neuronal Polychromatic Atlas of Landmarks): a combination of 41 selectively overlapping drivers, expressing four different fluorescent protein colors, engineered to provide an unambiguous color-coded neural map of the entire nervous system of the hermaphrodite. Fundamentally distinct from the stochastic multicolor labeling in previously described Brainbow approaches (Livet et al., 2007; Richier and Salecker, 2015; Weissman and Pan, 2015), NeuroPAL labels are stereotyped, with all animals sharing the same, robust color scheme. Each neuron’s unique identity can be determined within living worms, by matching its color code and gangliar location to the NeuroPAL map. The GFP/CFP/YFP spectral band is devoid of other colors, thereby allowing these fluorescent reporters, or GCaMP signals, to be overlaid with the NeuroPAL landmarks.
We illustrate here a number of applications of NeuroPAL, with results that would be difficult or impossible to attain using previous methods. First, we use NeuroPAL to measure variability of neuronal soma positioning from animal to animal, constructing a probabilistic atlas of neural locations. Second, we use NeuroPAL to determine the expression patterns for the entire family of worm metabotropic neurotransmitter receptors. This map of metabotropic gene-expression patterns delineates a significant portion of the second messenger communication system in the wiring diagram. In combination with previous work that identified the expression for the ionotropic GABA receptors (Bamber et al., 1999; Beg and Jorgensen, 2003; Gendrel et al., 2016; Jobson et al., 2015), we complete the map of the worm’s GABA communication network (all GABA senders and recipients), revealing the surprising conclusion that even though <10% of all neuron classes release GABA, almost all neurons in C. elegans have the capacity to “listen” to GABA. Third, we perform whole-brain activity recordings to assess the nervous system response repertoire to repulsive and attractive stimuli from three distinct modalities: light, gustation, and olfaction. Our experiments confirm published circuit-related neurons and extend these with a set of novel responsive neurons. The results indicate that shared valence (repulsion or attraction) does not imply shared circuitry: repulsive blue light responses were all inhibitory; repulsive salt responses were all excitatory; and, two attractive odorants (2-butanone and 2,3-pentanedione) sensed by the AWC-class neurons, respectively showed contrasting inhibitory and excitatory responses. Moreover, we find that the wired connectome is a poor predictor for whole-brain activity patterns, underscoring the need for comprehensive functional measurements to delineate behavioral circuitry. Fourth, we use an inherent feature of NeuroPAL, its monitoring of neuronal identity, to reveal neuronal-fate defects in specific transcription factor mutant backgrounds. Lastly, we introduce open-source software, employing a novel set of algorithms, to detect neurons, match them to their unique named identities, and recover associated attributes such as location, neural activity, or gene expression.
RESULTS AND DISCUSSION
Fluorescent reporter choices to build a landmark strain
Multiple considerations guided our process in building a multicolor landmark strain. For the color palette, we surmised that at least four distinguishable, landmark fluorophores were necessary (Fig.1A): three fluorophores to effect the primary color palette red, green, and blue (RGB) from which all other human-visible colors can be constructed (Fig.1C); and, a fourth fluorophore that exclusively labels all neurons indiscriminately (a “panneuronal” reporter). Assuming a simplistic trinary color code, wherein each fluorophore is marked bright, medium, or absent from a neuron, the RGB + panneuronal palette achieves 27 distinguishable, color barcodes. Nearly all microscopes employ filters to simply measure light intensity, ignoring wavelength (color); pseudo-colors are assigned later by software. Given our need for a green non-GFP landmark in our primary color palette, we pseudo-color the signal reporters GFP/CFP/YFP/GCaMP6s white or black and save red, green, and blue for our landmarks (Fig.1B), further discussed below.
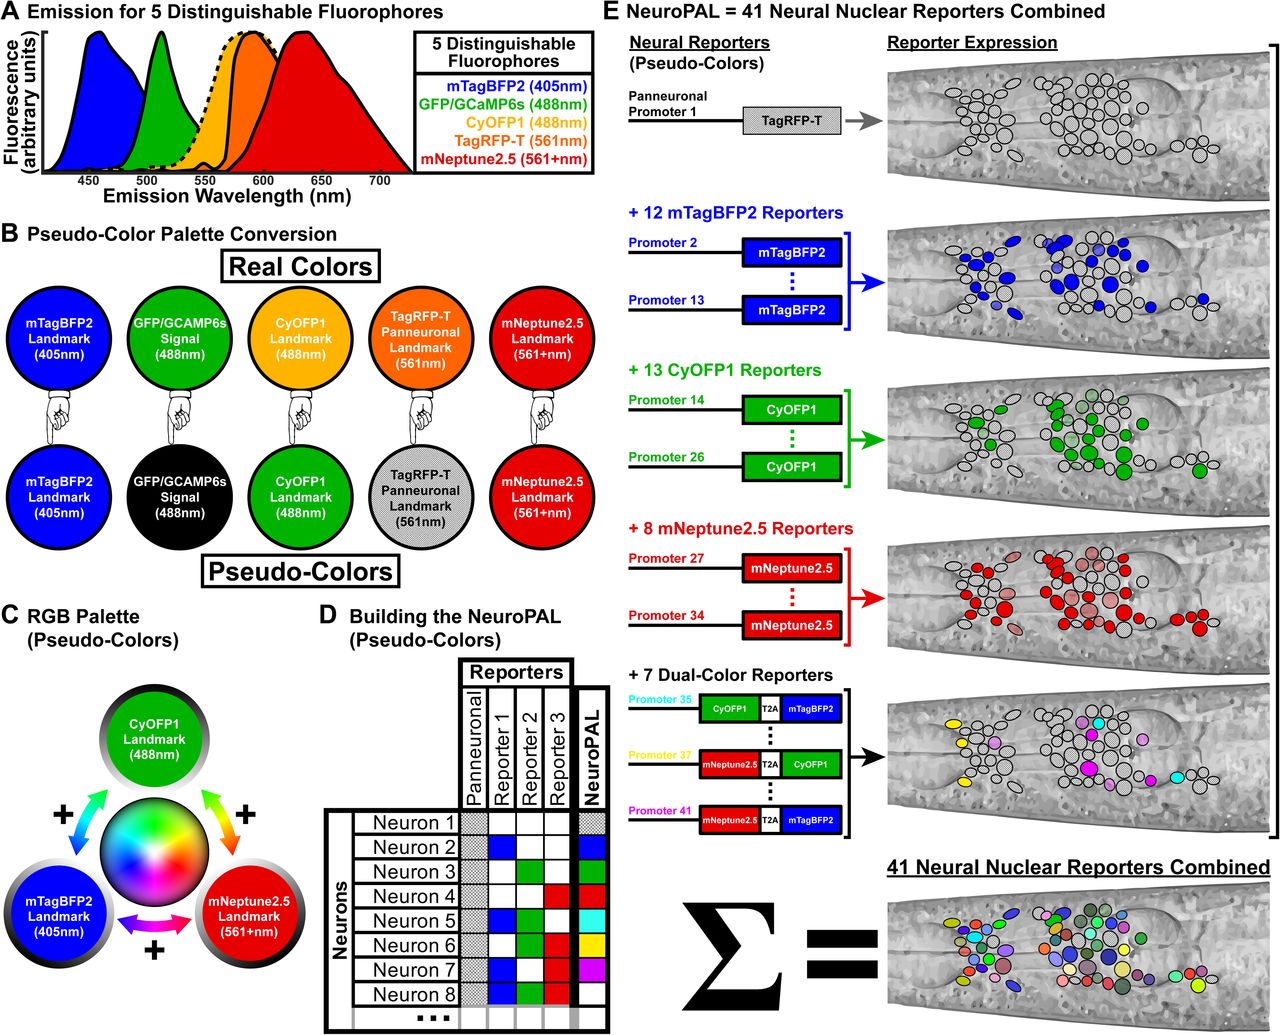
(A) Spectral properties for four distinguishable fluorophore landmarks (mTagBFP2, CyOFP1, TagRFP-T, mNeptune2.5) that permit a clear band for measuring GFP signal.
(B) Pseudo-color conversions to create the RGB primary color palette from our landmark fluorophores: red (mNeptune2.5), green (CyOFP1), and blue (mTagBFP2). TagRFP-T is assigned to a panneuronal reporter and is best visualized separately or overlaid in white. GFP is retained for marking reporter expression or neural activity signals and is also best visualized separately or overlaid in white.
(C) The RGB palette enables landmark fluorophores to be combined in order to create all visible colors.
(D) NeuroPAL neurons are colored by using neuron-specific promoters to robustly and deterministically drive exact colors in specific neural subsets. These effectively create neuronal color barcodes.
(E) The NeuroPAL combines 41 reporters into a single injected array: 1 TagRFP-T panneuronal reporter, in addition to 12 mTagBFP2 (blue), 13 CyOFP1 (pseudo-colored green), 8 mNeptune2.5 (red), and 7 dual-color (combinations of the three aforementioned landmark colors) neuron-specific reporters. To conserve space on the injected array, dual-color reporters use a single promoter to drive two colors, linked by a T2A self-cleaving protein sequence.
To engineer an appropriate color palette, we surveyed the list of genetically-encoded fluorescent proteins (see Experimental Procedure for more details). GFP and several of its derivations (GCaMP, CFP, and YFP) are among the most popular choices for reporters due to their brightness, fast maturation, resistance to photobleaching, monomericity, and behavior when attached to other proteins (e.g., as translational reporters) (Chalfie et al., 1994; Cranfill et al., 2016). For this reason, we decided to leave the GFP emission band empty so as to permit a clean readout of signal from any GFP-derived reporters crossed or injected into the multicolor landmark strain (Fig.1A). Conversely, if GFP emits into the spectral bands of our NeuroPAL fluorophores, we might confuse the GFP signal with our landmarks. We therefore sought fluorophores whose emission could be easily distinguished from GFP and from each other as well (so as to differentiate between the different landmarks). We tested multiple fluorophores and after taking a number of considerations into account (further detailed in the Experimental Procedure section) we chose mTagBFP2 (Subach et al., 2011), CyOFP1 (Chu et al., 2016), TagRFP-T (Shaner et al., 2008) and mNeptune2.5 (Chu et al., 2014) to enable isolated excitation and emission (Fig.1A). All fluorophores employed a nuclear-localization sequences (NLS) to ensure fluorescence was confined to nuclei. mTagBFP2 and CyOFP1 further required fusion to the histone H2B to suppress their aggregation. Targeting fluorophores to the nucleus has the express purpose of generating clear boundaries between neighboring cells. To generate additional flexibility in the colors that can be created by each promoter, we employed three different “dual color” fluorophores in which two fluorophores are directly linked by a self-cleaving T2A peptide sequence (Ahier and Jarriault, 2014). Specifically, we engineered mNeptune2.5::T2A::CyOFP1, CyOFP1::T2A::mTagBFP2, mNeptune2.5::T2A::mTagBFP2, to produce the aggregate colors turquoise, purple, and yellow respectively (Fig.1E).
Building NeuroPAL by combining 41 fluorescent reporter constructs on a single transgene
Having chosen the palette, we turned our attention to the problem of color-coding all neurons of the C. elegans nervous system in a manner that enables unambiguous determination of their cell-specific identity. Adult hermaphrodites have an invariant set of 302 neurons located within 11 ganglia in the head and tail, two pharyngeal bulbs, a ventral nerve cord (VNC), and in the worm’s midbody (White et al., 1986). The ganglia are densely populated, with limited distal cell mobility although, proximal mobility can be quite high. As a result, the problem of unambiguous coloring reduces to a specific requirement: all neurons must have a stereotyped color barcode and, neurons that can end up as neighbors must have distinguishable barcodes.
We generated this barcode by injecting multiple reporters into adult hermaphrodites, concatamerizing them into large arrays (such arrays have been shown to reach a megabase in size)(Mello et al., 1991). Our overall strategy, schematized in Fig.1D, was to generate an array containing a collection of colored, neuron-type-specific reporters that, in combination, provide complete disambiguation between neighboring neuron classes. To make sure that all neurons were labeled, we first generated a 1.4kb synthetic panneuronal driver (called UPN for Ultra-PanNeuronal) by stitching together panneuronal cis-regulatory elements derived from four different panneuronally expressed genes (unc-11prom8, rgef-1prom2, ehs-1prom7, ric-19prom6)(Stefanakis et al., 2015). Unlike other panneuronal drivers, the UPN delivers strong, robust expression (driving TagRFP-T) throughout the nervous system.
To select neuron-type-specific drivers for the three colored landmarks (Fig.1), we made use of a curated list of reporter-gene expression patterns extracted from WormBase (Hobert et al., 2016). As a first pass, we co-injected acr-2, glr-4, lad-2, and ocr-2 driving T-Sapphire, with panneuronal GFP (T-sapphire and GFP share the same emission band but require 405nm and 488nm, respectively, for excitation and can thus be distinguished via their specific excitation wavelengths). Due to the broad and sparse coverage of the aforementioned four drivers, in combination they yielded a neural “checkerboard” across the whole nervous system, wherein neurons with specific driver expression are largely surrounded by neighbors solely expressing the panneuronal reporter. Initially, we co-injected this neural checkerboard with sets of three additional candidate NeuroPAL reporters (driving mTagBFP2, CyOFP1, and mNeptune2.5) in successive screening rounds. Note that NeuroPAL reporter colors were specifically chosen to be distinguishable from GFP and its derivatives, including T-Sapphire. Over 130 candidate promoters were tested in this manner (Supplement Data 1). In the context of this screening procedure, many drivers were found to exhibit variable and/or weak expression, and/or susceptibility to crosstalk-mediated repression. Poorly performing drivers were consequently removed from consideration. To achieve the goal of complete disambiguation between neighboring neuron classes, we co-injected numerous combinations of successively larger driver sets targeting distinct cellular specificities.
Eventually, we found that cocktails containing more than 30 co-injected reporters gave nearly unambiguous base color schemes. Notably, the color scheme of different cocktails showed remarkable stereotypy amongst siblings of the same transgenic strain, and even across different injections of the same mix. In nearly all of these co-injected cocktails, every injected reporter had visually verifiable expression within the resulting strains, implying the inclusion of all 30+ reporters in the extrachromosomal array. One cocktail, composed of 41 co-injected reporters, strongly matched our expectations from its design (Fig.1E & Fig.2A-E). The transgene generated by this cocktail was called NeuroPAL (Table 1; Fig.2, Supplement Table 1, Supplement Data 1).

(A) A young adult (otIs669) displaying the deterministic coloring scheme identical across all NeuroPAL worms. Coloring was designed and targeted to ensure that proximal neurons, and those with positional variability, have distinguishable colors from all possible neighbors.
(B-E) NeuroPAL (otIs669) coloring in the lateral head ganglia (B), ventral head ganglia (C), midbody and ventral nerve cords (D), and tail ganglia (E).
* All images may employ histogram adjustments to improve visibility. Images without DIC may further be adjusted with a gamma of approximately 0.5, across all color channels, to improve visibility in the presence of a dark background.
The 41 reporters combined to create the NeuroPAL, their neural expression, and the resulting stereotyped color, per neuron class, ordered from anterior to posterior. NeuroPAL not only labels all 118 anatomically defined classes of the worm, but also a number of neuronal subclasses. For example, the stochastically-asymmetric, bilateral, AWC neuron pair were distinguishably colored by design. AWC-OFF expresses srsx-3::CyOFP1, thus giving it a green appearance relative to its ON equivalent. Similar design choices were made so as distinguish several neural subclasses, such as DA8 versus DA9 as well as VB1 versus VB2. Neuronal subtypes with differential coloring are listed separately (e.g., RMEL/R vs. RMED/V). See Supplement Data 1 for further details.
a = the neuron is missing expected coloring from at least one of the NeuroPAL reporters.
b = the neuron displays coloring that is not accounted for by any of the NeuroPAL reporters.
c = the neuron may appear either bright or dim in the NeuroPAL.
d = the neuron is solely marked by the panneuronal but may occasionally display dim blue coloring.
Robustness of NeuroPAL and its use to assess stereotypy of neuron position
The extrachromosomal NeuroPAL array was integrated and the three brightest integrants were then chosen to be NeuroPAL strains. These strains were outcrossed 8x and show stable expression over >100 generations. The color scheme of the final NeuroPAL matched our color scheme design (Fig.2, Movie 1-2, & Table 1). Nonetheless, we verified the color for each neuron by crossing the NeuroPAL integrant strains to 25 GFP reporter lines with well-defined expression patterns (Supplement Data 1). Most neurons were identified using at least two or more of these 25 reporters, across multiple NeuroPAL transgene integrants, thus exacting strong internal consistency checks on the published expression. We found the NeuroPAL color scheme to be robust and stereotyped over hundreds of scored animals, representing all NeuroPAL integrants (otIs668, otIs669, otIs670, and otIs696), and further quantified this stereotypy by sampling 10 otIs669 animals (Supplement Text 1). A minor exception are four neuron classes (among the total 118 distinct neuron classes) that experience variable brightness (AVL, RIM, RIS, PVW); this minor variability does not confound unambiguous neural identification.
We used NeuroPAL’s robust color stereotypy to assess neuronal positional stereotypy within the hermaphrodite nervous system. Such analysis has never been systematically conducted, but previous electron micrograph (EM) reconstruction of a small number of animals revealed notable variabilities. For example, while the retrovesicular ganglion (RVG) of three reconstructed adult hermaphrodites shows strong stereotypy in VB2 position, rearrangements can easily be seen amongst several of the remaining 19 neurons (Fig.3A) (Hall and Altun, 2007; White et al., 1986). For example, DA1 occupies positions as the 15th, 18th, and 19th neuron across the N2U, N2S, and N2T series respectively. Furthermore, EM head reconstruction (N2T) reveals positional variability on the left and right sides of the animal (anterior-posterior positioning of AIZ-RIC and, dorsal-ventral positioning of ADF-AFD)(White et al., 1986). We identified further examples of left/right variability in the course of testing NeuroPAL reporter candidates (Fig.3B shows one such example).

(A) Positional variability in the retrovesicular ganglion as assessed by analysis of electron micrographs N2S, N2T, and N2U (Hall and Altun, 2007; White et al., 1986).
(B) A transgenic array, containing the indicated reporters, shows an example of substantial positional variability for the left and right OLL neurons within a single animal.
(C,D) Canonical neuron locations (filled circles with their NeuroPAL coloring) alongside their positional variability (encircling ellipses with matching color) for all ganglia, as determined by NeuroPAL (otIs669), see Supplement Data 3 for exact measurements. Positional variability is displayed as the 50% contour for neuronal location (measured as a Gaussian density distribution), sliced within a 2D plane; because we are restricted to a planar view, we show both the left-right and dorsal-ventral planes to provide a 3D estimation of the true contour bounding positional variability (Supplement Text 1). (C) Left, right, and ventral views of the head neuron positions. (D) Left, right, and ventral views of the tail neuron positions.
To systematically assess this mobility across the entire nervous system, we identified neuronal nuclei for both the head and tail of 10 carefully-staged, young-adult NeuroPAL worms (otIs669) from a single generation, imaged over two days. All animals were aligned to a global best-fit, permitting us to quantify the distribution of each neuron’s position. This analysis resulted in a neuron position atlas (Fig.3C,D), providing a complete accounting of canonical neuron positions in the head and tail and the variability within this canon (Supplement Text 1; see Supplement Data 3 for exact measurements). On the one hand, our atlas demonstrates that many neurons occupy highly-stereotyped locations. The clearest examples of these positionally-stereotyped neurons are those bordering dense portions of their ganglia with no space for mobility; for example, AVA, AVE, RIA, SAAV, SMDV, and RMDV form the anterior border for the lateral ganglion and rank highly for stereotypy. On the other hand, a considerable portion of neurons show high variability. In particular, the ventral ganglion exhibits a plethora of possible neuronal arrangements. The positional variability we observed with NeuroPAL recapitulates those observed in the EM analysis mentioned above (e.g., the RVG exhibits considerable variability, and DA1 is extensively mobile)(Fig.3A) and ones we further observed with other transgenes (e.g. Fig.3B). Taken together, this substantial variability in positioning illustrates the importance of landmarking neurons with NeuroPAL so as to enable robust identification of their identities.
Applying NeuroPAL to map pathways of neurotransmitter communication
A key application of NeuroPAL is its ability to identify expression patterns of reporter genes. Such identification is traditionally an arduous and error-prone task. As a proof of principle, we sought to use NeuroPAL to identify the comprehensive expression pattern for an entire gene family which, in turn, would provide insights into neuronal circuitry of the worm, on a whole-nervous-system level. Recent work has resolved all fast-acting neurotransmitter (NT) identities – acetylcholine (ACh), glutamate (Glu), and γ-aminobutyric acid (GABA) – throughout the entire nervous system (Gendrel et al., 2016; Pereira et al., 2015; Serrano-Saiz et al., 2013) but the expression patterns of cognate receptors are notably incomplete. NT receptors are broadly classified as ionotropic and metabotropic. In the C. elegans genome, metabotropic receptors are represented by only eight genes from three subfamilies, all highly-conserved across phylogeny: three cholinergic metabotropic receptors (GARs), three glutamatergic metabotropic receptors (MGLs), and two GABAergic metabotropic receptors (GBBs; also called “GABAB” in vertebrates)(Hobert, 2013).
We examined the expression of six of these genes with fosmid-based reporter (gar-1, gar-2, mgl-1, mgl-3, gbb-1, and gbb-2) and the remaining two with intergenic promoter fusions that cover most if not all of the intergenic region of their respective gene (mgl-2: 7.9kb including its entire 5’ intergenic sequence; gar-3: 8.5kb of the 13.3kb 5’ intergenic region). Crossing these reporters with NeuroPAL, we determined the expression patterns for all eight genes (Fig.4 and Table 2). Strikingly, metabotropic NT receptor expression covers nearly the entire nervous system (113/118 neuron classes), distributed individually as 70% coverage by GARs, 54% by MGLs, and 89% by GBBs (Fig.5C). Despite over 3-fold larger gene number (two GBBs versus seven GABAAs), ionotropic GABAA receptor expression covers only about half (47% of neuron classes) of the neurons compared to GBB coverage (89% of neuron classes).
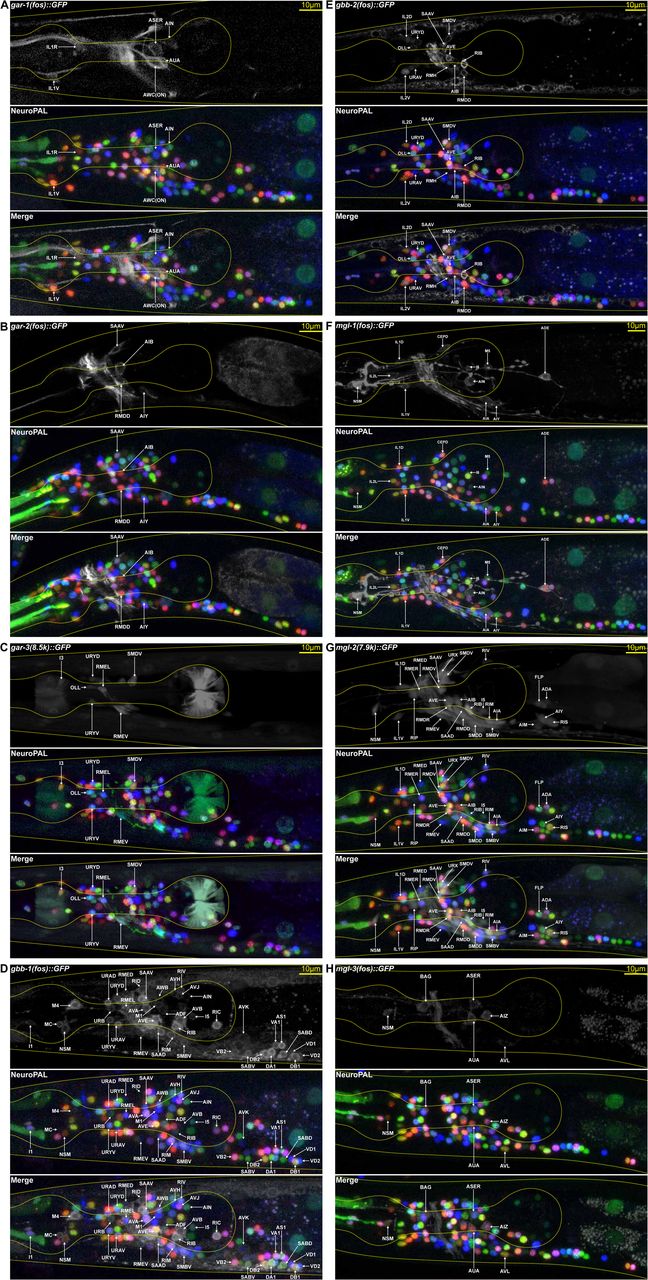
(A-H) NeuroPAL is used to decode the gfp expression patterns for the full family of classical metabotropic neurotransmitter receptors, including three metabotropic acetylcholine receptors, GAR-1 (A), GAR-2 (B), and GAR-3 (C), the two metabotropic GABA receptors GBB-1 (D) GBB-2 (E) and the three metabotropic glutamate receptors MGL-1 (F), MGL-2 (G), and MGL-3 (H). See Supplement Table 1 for details on reporter strains. Genotypes are otEx7217[gar-1(fosmid)::GFP + inx-6(prom18)::TagRFP + pha-1(+) + OP50];otIs669[NeuroPAL];pha-1(e2123) (A), otEx7209[gar-2(fosmid)::GFP + inx-6(prom18)::TagRFP + pha-1(+) + OP50];otIs669[NeuroPAL];pha-1(e2123) (B), vjEx601[Pgar-3(8.5kb)::GFP];otIs669[NeuroPAL] (C), otEx7203[gbb-1(fosmid)::GFP + inx-6(prom18)::TagRFP + pha-1(+) + OP50];otIs669[NeuroPAL];pha-1(e2123) (D), vsIs267[gbb-2(fos)::GFP + lin-15(+)];otIs696[NeuroPAL] (E), otEx7206[mgl-1(fosmid)::GFP + inx-6(prom18)::TagRFP + pha-1(+) + OP50];otIs669[NeuroPAL];pha-1(e2123) (F), otEx7245[mgl-2(7.9k)::GFP + inx-6(prom18)::TagRFP + pha-1(+)];otIs669[NeuroPAL];pha-1(e2123) (G), and otEx7215[mgl-3(fosmid)::GFP + inx-6(prom18)::TagRFP + pha-1(+) + OP50];otIs669[NeuroPAL]; pha-1(e2123) (H).
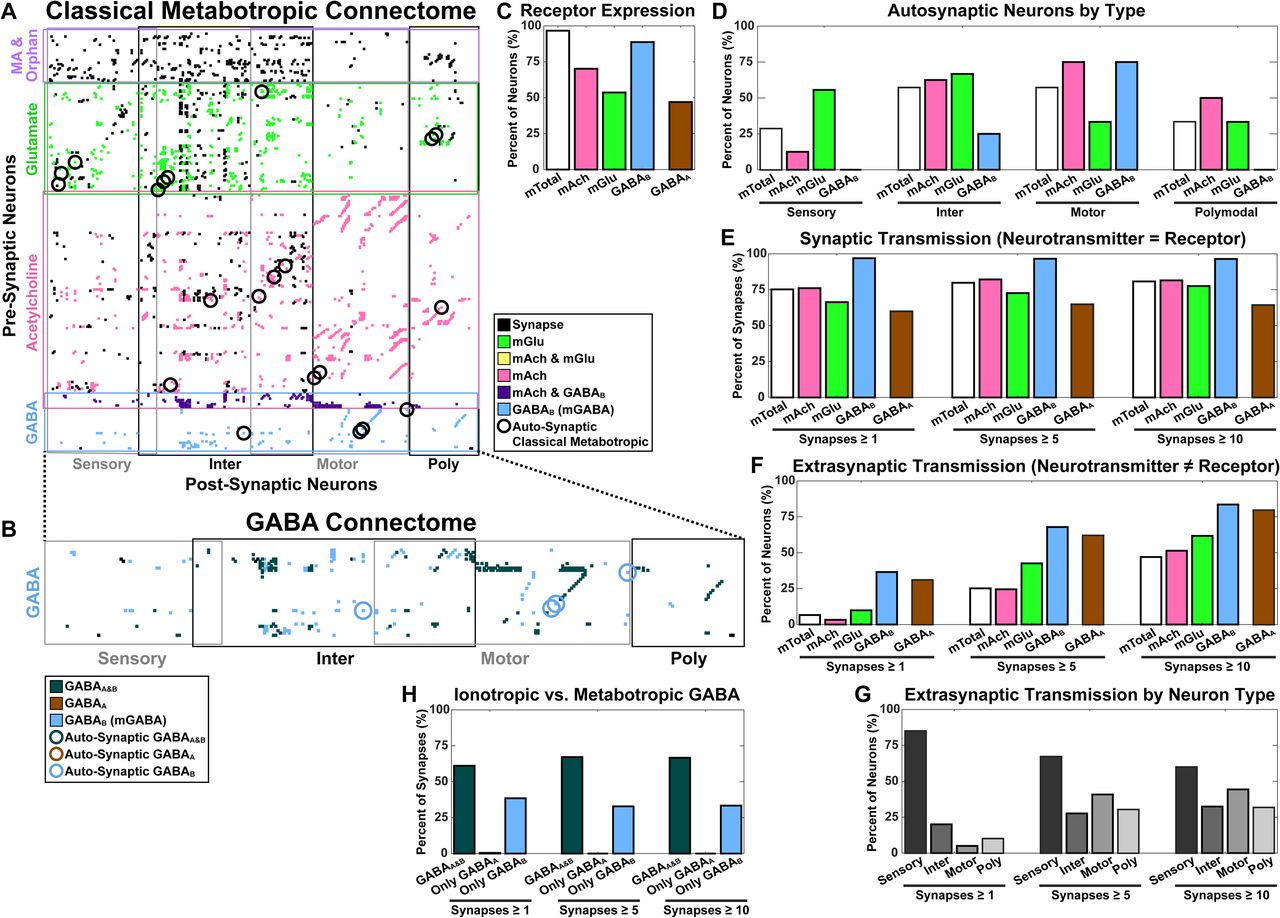
(A) Expression for the classical metabotropic receptors is incorporated into the existing anatomically defined connectome. The connectome is organized into a connection matrix: rows of pre-synaptic neurons (organized by neurotransmitter) and columns of post-synaptic targets (organized by neuron type). Synaptic connections are marked by a black dot. When a synaptic connection’s pre-synaptic neurotransmitter matches the post-synaptic metabotropic receptor, the dot is colored to reflect the cognate sender-receiver pair. As can be seen, the majority of the network is colored, reflecting the potential for considerable metabotropic communication. Auto-synaptic neurons with cognate neurotransmitter and metabotropic receptor are circled.
(B) The complete GABA communication network: all GABA senders and their synaptic connections to ionotropic GABAA and metabotropic GABAB recipients. Synaptic connections are marked by a black dot. This dot is colored when synaptic connections can be accounted for by cognate receptors: GABAA, GABAB, or the presence of both at the post-synaptic neuron. Auto-synaptic metabotropic neurons are circled, no auto-synaptic GABAA neurons are present.
(C) Metabotropic receptor expression (and ionotropic GABAB) as a percentage of neurons (mTotal=97%, mAch=70%, mGlu=54%, GABAB=89%, GABAA=47%).
(D) Auto-synaptic metabotropic neurons (organized by neuron type and sub-organized by neurotransmitter) as a percentage of the total auto-synaptic neurons expressing each neurotransmitter (Sensory: mTotal=29%, mAch=13%, mGlu=56%, GABAB=0%; Inter: mTotal=57%, mAch=63%, mGlu=67%, GABAB=25%; Motor: mTotal=57%, mAch=75%, mGlu=33%, GABAB=75%; Polymodal: mTotal=33%, mAch=50%, mGlu=33%, GABAB=0%).
(E) Cognate synapses, where the pre-synaptic neurotransmitter matches the post-synaptic receptor, as a percentage of each neurotransmitter’s synapses. The percentages are robust against weak connectivity when thresholding for connections employing at least 1, 5, or 10 synapses (1: mTotal=75%, mAch=76%, mGlu=66%, GABAB=97%, GABAA=60%; 5: mTotal=80%, mAch=82%, mGlu=73%, GABAB=97%, GABAA=65%; 10: mTotal=81%, mAch=81%, mGlu=78%, GABAB=96%, GABAA=64%). Metabotropic communication accounts for well over half of the classical neurotransmitter synapses.
(F) Extrasynaptic transmission, post-synaptic neurons expressing a receptor with no connections to their cognate pre-synaptic neurotransmitter. Percentages are shown relative to total number of neurons expressing receptors for each of the classical neurotransmitters and thresholded at 1, 5, and 10 synapses to display the results of weak connectivity (1: mTotal=7%, mAch=3%, mGlu=10%, GABAB=37%, GABAA=31%; 5: mTotal=25%, mAch=25%, mGlu=43%, GABAB=68%, GABAA=62%; 10: mTotal=47%, mAch=51%, mGlu=62%, GABAB=84%, GABAA=80%). Synaptic thresholding results in rapid increases of overall extrasynaptic communication, implying that weak connectivity is still likely to be real.
(G) Extrasynaptic transmission, by neuron type, thresholded at 1, 5, and 10 anatomically defined synapses (1: Sensory=85%, Inter=20%, Motor=5%, Poly=10%; 5: Sensory=67%, Inter=28%, Motor=41%, Poly=30%; 10: Sensory=60%, Inter=32%, Motor=44%, Poly=32%). Sensory neurons dominate the locations of extrasynaptic communication.
(H) Ionotropic versus metabotropic GABA communication. Over 60% of GABA connections share both GABAA and GABAB receptors at their post-synaptic sites. The remaining nearly 40% is accounted for solely by metabotropic GABAB recipients. These percentages remain robust against thresholding at 1, 5, and 10 synapses (1: GABAA&B=61%, Only GABAA=0%, Only GABAB=38%; 5: GABAA&B=67%, Only GABAA=0%, Only GABAB=33%, 10: GABAA&B=67%, Only GABAA=0%, Only GABAB=33%).
Neuronal expression for the classical metabotropic neurotransmitter receptors. Neuronal subtypes with differential expression from their class receive their own entry. Neurons that fail to express any of the genes are marked with a blue background. Green demarcates neurons correctly identified in published literature. Red demarcates neurons misidentified in published literature. Black demarcates novel expression identified via NeuroPAL. The considerable set of additional classes, identified via NeuroPAL (demarcated in black), highlights the previous difficulties in identifying gene families with broad expression. Notably, among our discoveries we found gbb-2 expression in only 1 of the 13 VD-class neurons, VD1, suggesting that this neuron represents a formerly unknown motor subtype. See Supplement Table 1 for details on reporter strains.
Given our knowledge of (a) the neurotransmitter identities of all pre-synaptic neurons and (b) the set of chemical synaptic edges conjoining pre- and post-synaptic neurons (from full EM reconstructions), we superimposed neurotransmitter-releasing and -receiving neurons onto the existing synaptic connectome (Cook et al., 2019; White et al., 1986), then extracted pathways of potential metabotropic communication (Fig.5A). Previous work identified the expression of all 7 ionotropic GABAA receptors (exp-1, gab-1, lgc-35, lgc-36, lgc-37, lgc-38, unc-49)(Bamber et al., 1999; Beg and Jorgensen, 2003; Gendrel et al., 2016; Jobson et al., 2015). Consequently, our identification of the metabotropic GABAB receptors (GBB), in conjunction with the GABAA expression, completes the entire GABA communication network for the worm: the collection of all GABA senders, putative recipients, and synapses between them (Fig.5B). The immediate, most striking aspect of this GABAergic communication is that 92% (277/302) of all neurons in the C. elegans nervous system appear to be able to “listen” to GABA, which is even more striking when one considers that only 14% (41/302) of all neurons contain GABA and less than 10% (29/302) have the requisite cellular inventory to release this NT (Gendrel et al., 2016).
Examining these pathways of neuronal communication in greater detail, we find pervasive matches between EM-defined anatomical connectivity with corresponding NTs paired to their cognate metabotropic receptor (Fig.5E). Specifically, 76% of cholinergic, 66% of glutamatergic, and 97% of GABAergic synapses can be accounted for by cognate metabotropic receptors on their post-synaptic neurons. Ionotropic GABAA receptors cover only 60% of the GABA post-synaptic neurons, implying that metabotropic communication may be the primary form of GABA communication. Assuming that strong connections are more likely to be conserved among worms, we thresholded connectivity for synaptic counts of 1, 5, and 10 synapses and found our results to be robust (Fig.5E,H). We further found that, save for a single ionotropic GABAA synapse, all GABA connectivity can be accounted for by post-synaptic metabotropic GABAB receptors (the exception is AVF onto AIM, with a synaptic weight of 1). Hence, potentially all ionotropic GABAA connections also support metabotropic communication. In stark contrast, 38% of the metabotropic GABAB connections have no ionotropic GABAA representation (Fig.5H). These findings are also robust against connectivity thresholds. Our analysis further suggests a large amount of potential auto-synaptic metabotropic neurons, implying the possibility of considerable feedback within this network (Fig.5D).
Taken together, the metabotropic communication maps strongly suggest that there is a considerable amount of extrasynaptic signaling present in the worm’s nervous system (Fig.5F). 3% of the cholinergic, 10% of the glutamatergic, and 37% of the GABAergic neurons have no pre-synaptic site supplying their cognate neurotransmitter; similarly, ionotropic GABAA neurons indicate the potential for 31% extrasynaptic communication, upholding the findings for their metabotropic counterparts. Examining this further, we find that the sensory neurons are the primary sites for potential extrasynaptic communication, accounting for 85% of these neurons; although, connectivity thresholds indicate that excluding low synaptic counts distributes extrasynaptic communication more equally amongst neuron types (Fig.5G). Our results underscore the power of NeuroPAL-based expression mapping as a fast, complementary approach to EM connectomic reconstructions.
Using NeuroPAL for whole-brain calcium imaging of stimulus responses
We next sought to combine NeuroPAL with a bright neural activity reporter, GCaMP6s (Chen et al., 2013), to achieve complete neural identification for whole-brain activity imaging. The stereotypy of the C. elegans nervous system presents a unique opportunity to identify every neuron within these volumes and, thereby, compare activity neuron-by-neuron across isogenic animals. To date, sparse fluorescent reporters have been used to identify small subsets of neurons and compare their activity across a population of animals (Kato et al., 2015; Kotera et al., 2016). Attempting to match panneuronal markers with neuron locations based on the EM reconstruction of a single worm (N2T) could also be considered as an option. However, as we show in the previous section addressing canonical neuronal locations and the subsequent section addressing semi-automated neural identification, these methods are hampered by positional variability, suggesting that such approaches may lead to a large number of misidentifications and spurious activity assignments.
We generated GCaMP6s transgenic lines that combine distinct drivers to ensure uniform expression throughout the nervous system (see Experimental Procedures), crossed them with NeuroPAL (otIs669;otIs672, bottlenecked 23x to achieve isogenicity – strain OH15500), and then exposed these worms to stimuli for three specific sensory modalities: taste, odor and light. To record neural activity, we built a whole-brain imaging setup composed of a confocal microscope coupled to a microfluidic device for stimulus delivery (Fig.6A; Supplement Text 2). We used the microfluidic device to deliver taste and odor cues that are perceived by the worm in a lateralized manner: a) a repulsively high concentration of the gustatory cue NaCl, previously shown to trigger an ON response in the left ASE and an OFF response in the right ASE (Suzuki et al., 2008), b) the attractive odorant 2-butanone, which is sensed by AWC-ON, stochastically chosen in development as either the left or right AWC neuron (Wes and Bargmann, 2001) and, c) the attractive odorant 2,3-pentanedione which evokes the opposite lateralized response in AWC-OFF (the AWC neuron contralaterally opposed to the one sensing 2-butanone) (Wes and Bargmann, 2001). We also delivered repulsive blue light (via laser), previously shown to evoke its avoidance response through LITE-1, a photoreceptor protein (Edwards et al., 2008; Gong et al., 2017). Hence, these four stimuli provided an opportunity to measure circuit responses for three sensory modalities, representing both attractive and repulsive valences, while exploring the downstream representations of asymmetric sensory inputs.
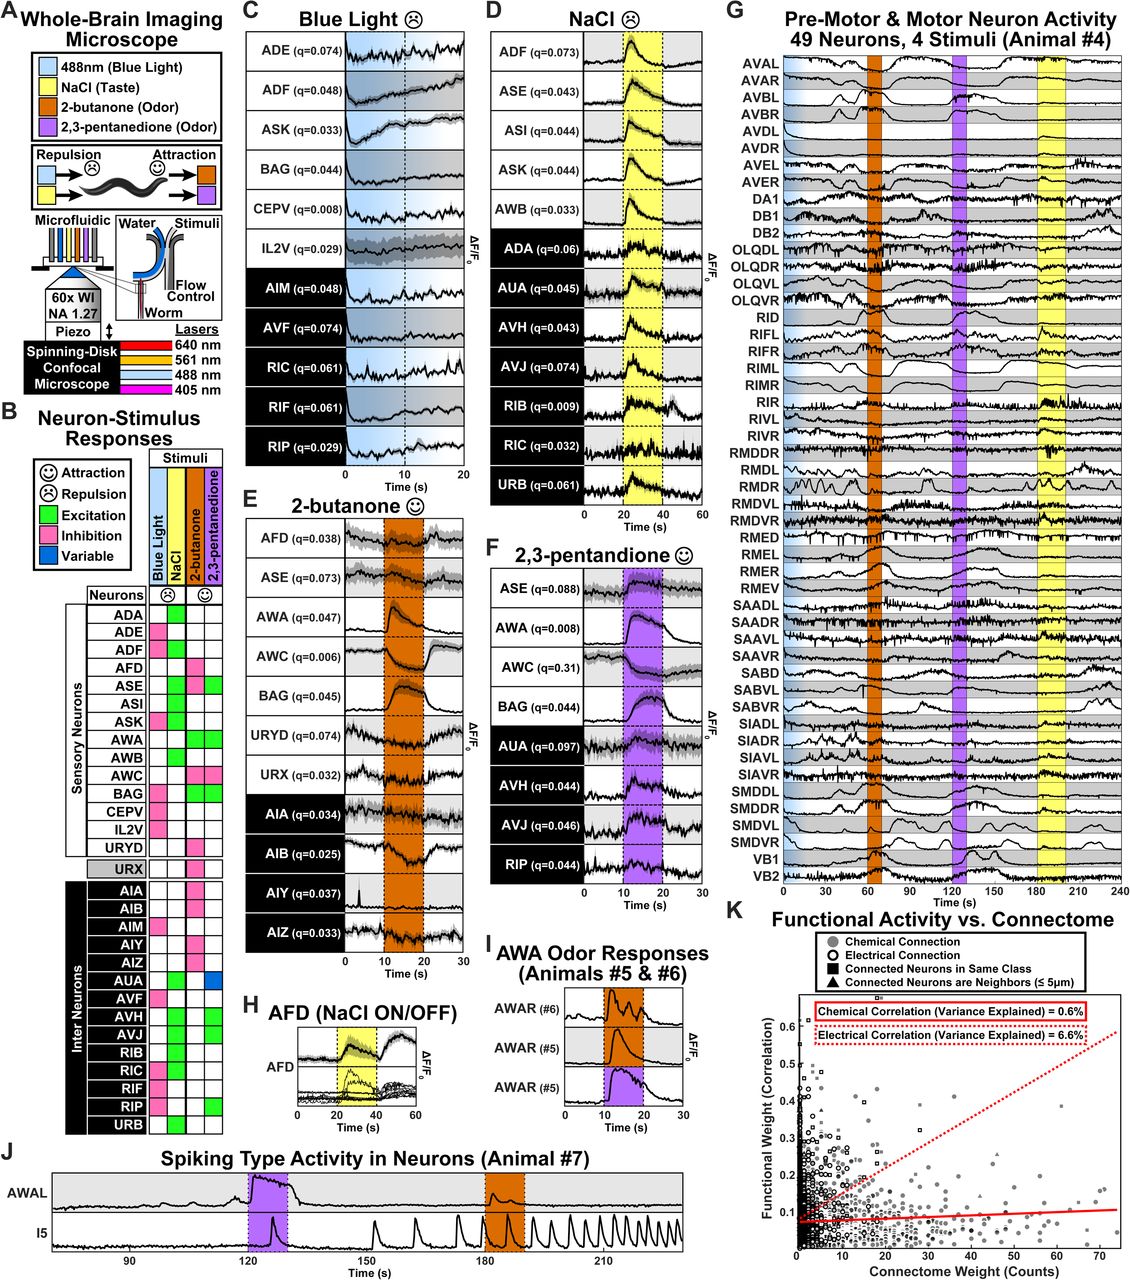
(A) Whole-brain activity microscope, with microfluidic, for imaging stimulus-response in NeuroPAL with panneuronal GCaMP6s (otIs669;otIs672, bottlenecked 23x to achieve isogenicity – strain OH15500). The aversive stimuli are the 488nm laser (blue light) and high concentrations of 200mM NaCl (gustation). The attractive stimuli are 2-butanone (odor) and 2,3-pentanedione (odor), sensed through the stochastically asymmetric AWC-ON and AWC-OFF respectively. The worm is immobilized via tetramisole, placed in the microfluidic, a 4-color NeuroPAL image is captured for neural identification, then neural activity is recorded (via GCaMP6s excitation) while gustatory and odor stimuli are delivered to its nose. All neural traces were linearly translated and scaled with F0 = 5th percentile of the activity trace, then de-bleached by fitting a simple exponential decay to their activity trace.
(B) Significant (q < 0.1) neuron-stimulus responses for the stimuli, grouped by valence. The sample sizes, mean difference between stimulus and pre-stimulus traces, p values (Paired T-Test between stimulus and pre-stimulus periods), 95% confidence intervals, and q values (Storey FDR) are available, for all tested neurons and all stimuli, within the supplement (Supplement Data 2). Aversive blue light elicits inhibitory responses across all responsive neurons (ADE, ADF, AIM, ASK, AVF, BAG, CEPV, IL2V, RIC, RIF, RIP: N=9,11,12,13,7,14,13,14,12,8,14; 95%CI=[-0.9,-0.0], [-1.4,-0.2], [-0.2,-0.0], [-1.4,-0.3], [-0.2,-0.0], [-0.3,-0.0], [-0.1,-0.0], [-0.2,-0.1], [-0.6,-0.0], [-0.5,-0.0], [-0.3,-0.1]; q=0.074, 0.048, 0.048, 0.033, 0.074, 0.044, 0.008, 0.029, 0.061, 0.061, 0.029). Conversely, aversive gustation (NaCl) elicits excitatory responses across all responsive neurons (ADA, ADF, ASE, ASI, ASK, AUA, AVH, AVJ, AWB, RIB, RIC, URB: N=11,9,12,12,11,12,12,12,10,11,10,12; 95%CI=[0.0,0.6], [0.1,1.0], [0.3,1.9], [0.6,4.1], [0.2,1.7], [0.1,0.4], [0.1,0.7], [0.0,0.6], [0.4,1.8], [0.2,0.4], [0.1,0.4], [0.0,0.2]; q=0.060, 0.073, 0.043,0.044, 0.044, 0.045, 0.043, 0.074, 0.033, 0.009, 0.032, 0.061). The attractive odors, despite sharing the same valence and neuron class, elicit exhibit predominantly opposing signs in their responses. 2-butanone primarily elicits inhibition (AFD, AIA, AIB, AIY, AIZ, ASE, AWA, AWC, BAG, URX, URYD: N=14,11,14,12,13,14,14,14,14,14,14; 95%CI=[-0.1,-0.0], [-0.1,-0.0], [-0.4,-0.1], [-0.2,-0.0], [-0.2,-0.0], [-0.1,-0.0], [0.2,1.7], [-0.8,-0.4], [0.3,2.3], [-0.2,-0.0], [-0.4,-0.0]; q=0.038, 0.034, 0.025, 0.037, 0.033, 0.073, 0.047, 0.006,0.045, 0.032, 0.074). 2,3-pentanedione primarily elicits excitation (ASE, AUA, AVH, AVJ, AWA, AWC, BAG, RIP: N=12,12,11,12,12,12,12,12; 95%CI=[0.0,0.5], [-0.0,0.2], [0.1,0.9], [0.1,0.9], [1.9,4.7], [-0.6,-0.2], [0.3,2.1], [0.0,0.1]; q=0.088, 0.097, 0.044, 0.046, 0.008, 0.031, 0.044, 0.044).
(C-F) The mean and SEM for significant neural traces, per stimulus (prior to, during, and post stimulus). Blue light is a continuous stimulus but achieves rapid habituation and is therefore represented as a progressively decreasing gradient.
(G) Sinusoidal locomotory signals present in the neural traces of 49 pre-motor and motor neurons.
(H) AFD failed to reach significance in its NaCl (ON) response but its traces display a visible OFF response to the removal of the salt stimulus. I) AWA displays three response types (often seen in the animals imaged): a variable number of fast peaks (lost within the mean trace) to 2,3-pentanedione with examples from animals #5 and #6 and, an example from animal #5, of a much slower, plateau-like response to 2-butanone.
(J) AWA exhibiting a plateau response to 2-butanone and two fast peaks in response to 2,3-pentanedione. I5 exhibiting a long series of spike-like activity.
(K) Functional activity shows poor correlation with its wired counterpart. Standard connections are shown as circles. Connections between neurons of the same class (e.g., AWAL to AWAR) are shown as squares. Connections between neighboring neurons (distance ≤ 5μm) are shown as triangles. Chemical and electrical synapses are represented by filled shapes and outlines, respectively. The Pearson correlation between functional activity and chemical synapses is 0.08 (0.6% of the variance explained); Spearman’s rank correlation fairs worse with rs=0.05. The Pearson’s correlation between functional activity and electrical synapses has r=0.26 (6.6% of the variance explained); Spearman’s rank correlation fairs worse with rs=0.16. The solid line shows the best linear fit for predictions between functional and chemical weights. The dotted line shows the best linear fit for predictions between functional and electrical weights.
To record sensory responses at a whole-nervous system level, we employed the following methods: 1) We immobilized worms with tetramisole, paralyzing their muscles without sedating or affecting sensory neurons. 2) We used our microscope to take a 5-color identification volume, similar to those presented earlier in this paper. 3) We waited two minutes in the dark, and then recorded whole-brain GCaMP6s activity for four minutes at four volumes/second. The initiation of our recording was marked by immediate, repulsive blue light (the 488nm laser used to excite GCaMP6s). 4) We waited one minute for the worm to habituate to the light stimulus and then presented three stimuli via microfluidics at 1-minute intervals, rotating the order of stimuli amongst animals. These three stimuli were the aforementioned 200mM NaCl, 10−4 (volume dilution) 2-butanone, and 10−4 2,3-pentanedione. We presented the gustatory stimulus, NaCl, for 20s in the hope that its ON response would have sufficient time to return to baseline and, thereby, be decoupled from its subsequent OFF response. As previous work has shown, the NaCl OFF response is nearly undetectable at the ASER soma (Lim et al., 2018) and, thus, our nuclear GCaMP6s reporter failed to show detectable OFF responses. The two odorants were presented for 10s each, to give the worm sufficient time to sense them and potentially respond. After the experiments completed, we identified neurons within the 4-color identification volumes. Since the worms were immobile, we used previously published software to match all neurons from the identification volume, to their GCaMP6s recordings, and then track them across recorded frames, thus pairing the neural identity to activity (Venkatachalam et al., 2016). With this set of procedures, we imaged whole-brain responses to three sensory modalities: aversive light, aversive gustation, and attractive asymmetric olfaction (Movie 3).
Whole-brain imaging of responses to three modalities: light, salt, and odor
We hypothesized that our stimuli choices would activate modality-specific sensory neurons but share downstream circuitry in accordance with their valence – so as to economize on circuitry in the worm’s small nervous system. In other words, we expected that repulsive blue light and salt would be sensed differently but, employ multiple shared neurons downstream in order to execute the same avoidance response. Similarly, we expected our two odors to be sensed asymmetrically by their respective AWC neurons, but converge on an identical set of neurons immediately downstream so as to execute an attractive chemotactic response.
To quantify neural circuit responses, we recorded multiple worms with our system (Fig.6A). We reviewed ASE responses to salt and AWC responses to the odorants – the primary sensory neurons for these stimuli. Worms were marked as stimulus responsive if either of their left/right neurons showed the published response to their corresponding stimuli (ASE excitation in response to NaCl and AWC inhibition in response to odor). Five worms responded to all three stimuli, providing strong internal controls to compare response circuits across all stimuli. Two additional worms responded to two of the three stimuli (one failed to respond to NaCl and the other failed to respond to 2,3-pentainedione), nonetheless these still provided internal controls for 2/3 of the response circuits. We used 2-tailed, paired t-tests to compare the mean signal during stimulus presentation with an identical period immediately prior, at the very same neuron (a strong internal control). Since GCaMP6s requires 488nm excitation, we were unable to record a pre-stimulus period for blue-light responses. We reasoned that since worms habituate to light, the blue-light response could instead be tested in reverse by comparing the 10s immediately after lights on, to the 10s period thereafter (we assume the worm has begun its habituation curve between these two comparison periods, displaying an exponentially decreasing blue-light response). Our protocol of two minutes in the dark, just after the identification volume, ensures that the 488nm GCaMP6s excitation laser is a sudden, strong stimulus, evoking an immediate aversive response. Light comparisons similarly employed a 2-tailed, paired t-test.
Pre-motor and motor neurons show spontaneous cyclical activity in immobilized worms (Fig.6G)(Kato et al., 2015), so comparing them requires modeled assumptions about the cycle in order to test stimulus response. Moreover, these neurons are downstream of the decision-making circuit and, thus, are expected to show considerable variability in their response characteristics (Gordus et al., 2015). Due to the complexity of formulating such statistics, we dropped all pre-motor and motor neurons from our testing. Since recent publications have re-annotated all pharyngeal neurons as motor-type, these ended up as casualties of our methodological choices (Cook et al., 2019).
In total, we ended up performing 208 tests, across the four stimuli (light, salt, and two odors), then corrected for multiple testing using the Storey method of False Discovery Rate (Storey, 2002). To map all potentially significant neural responses, we chose a liberal q-value threshold of 0.1 and show the actual q values for neurons that achieved this cutoff in the accompanying text and figure (Fig.6C-F), further providing statistics for all neurons in the supplement (Supplement Data 2). For neurons that reached significance, we deemed them excitatory if their 95% confidence interval (CI) was entirely positive, inhibitory if the 95% CI was entirely negative, and variable if the confidence interval included 0 (Fig.6B). Notably, with the exception of AUA, with its “variable” 2,3-pentanedione response (q=0.097; 95% CI=[-0.002,0.21]), all significant neurons were assigned to be excitatory or inhibitory by our method, indicating a robust sign in their response and an appropriate q-value threshold for significance. The results of our significance-thresholding highlight neuronal subsets with stereotypy in their stimulus responses.
Individual neuron responses to light, salt, and odor
Recent work has illustrated that the “noise” observed in neural traces, frequently removed using a variety of non-linear de-noising techniques, is likely to be true signal (Huk and Hart, 2019; Liu et al., 2018). Therefore, recognizing the importance of maintaining the raw signal, we avoided de-noising techniques. Instead, we simply used linear translation and scaling (F0 = 5th percentile of the activity trace), followed by de-bleaching (fitting a simple exponential decay) to equalize and preserve the true neural signal, amongst animals, for both our statistics and figures. Neuron response statistics are present both in the figure caption and Supplement Data 2. Analyzing our experiments, we found light responses in 11 neurons including the LITE-1-expressing ADF and ASK (Bhatla and Horvitz, 2015) in addition to ADE, AIM, AVF, BAG, CEPV, IL2V, RIC, RIF, and RIP. Significantly, all light responses were inhibitory in their 95% CI indicating that light is a predominantly inhibitory stimulus (Fig.6B,C). For NaCl, we confirmed the ASE response that defined our inclusion criteria and found responses in 11 more neurons: ADA, ADF, ASI, ASK, AUA, AVH, AVJ, AWB, RIB, RIC, and URB. Several of these neurons have long been known to be involved in salt sensation (Bargmann and Horvitz, 1991) but, the remainder represent novel findings for this circuit. All NaCl responses were excitatory in their 95% CI, indicating that NaCl is a predominantly excitatory stimulus (Fig.6B,D). Light and NaCl share aversive valence yet they show opposing responses in the sensory neurons ADF and ASK, as well as the interneuron RIC. These results indicate that shared valence might employ overlapping circuitry in a distinctly opposing manner: excitation for one stimulus but inhibition for another.
The asymmetric olfactory stimuli presented an even more striking finding (Fig.6B,E-F). We confirmed the 2-butanone response in AWC that defined our inclusion criteria and found responses in 10 more neurons: AFD, AIA, AIB, AIY, AIZ, ASE, AWA, BAG, URX, and URYD. Many of these neurons have long been known or hypothesized to be involved in AWC-mediated olfaction (Chalasani et al., 2010; Gray et al., 2005; Wes and Bargmann, 2001) but, the remainder represent novel findings for this circuit. In particular, whereas the olfactory neuron AWC has been shown to respond to thermosensory stimuli (Biron et al., 2008; Kuhara et al., 2008), the converse, wherein the thermosensory neuron AFD (Mori and Ohshima, 1995) responds to odors, was not known. Moreover, BAG and URX have been shown to mediate responses to changes in CO2 and O2 gas concentrations but were not known to respond to odors nor light (Bretscher et al., 2008; Hallem and Sternberg, 2008; Zimmer et al., 2009). The gas content of our microfluidic stimuli remains identical across stimuli and water intervals, thus ruling out the possibility that these neurons are responding to changes in their well-known gas stimuli. The surprising inclusion of salt-responsive ASE, amongst the odor-responsive stimuli, hints at another possibility. AWA and BAG are the only neurons, of the 11 responsive ones, to have an excitatory 95% CI. The remaining 2-butanone responsive neurons all show an inhibitory 95% CI, indicating that this stimulus is largely inhibitory (Fig.6B,E). Potentially, this olfactory response is inhibiting considerable portions of sensory equipment outside its own modality to better discriminate signal for the attractive odorant.
The second odorant, 2,3-pentaindione, provided another striking result. Once again, we confirmed the AWC response that defined our inclusion criteria for this odor. An additional 7 neurons also showed a response: ASE, AUA, AVH, AVJ, AWA, BAG, and RIP. In these results, AWC is the only neuron to exhibit an inhibitory 95% CI. The remaining five neurons all exhibit an excitatory 95% CI, and AUA’s variable response (95% CI=[-0.002,0.21]) is mostly excitatory, indicating that 2,3-pentaindione is principally an excitatory stimulus (Fig.6B,F). 2-butanone and 2,3-pentanedione share both their attractive valence and response sign within the AWC, AWA, and BAG neurons but, overall, they exhibit opposing signs amongst their remaining, mostly interneuron, responses. This finding may help explain how asymmetric circuits handle their asymmetries downstream of sensory inputs: employing differential circuitry thereafter. Furthermore, our results indicate that sensory and interneurons are not likely to be valence-specific; in other words, aversive stimuli do not activate shared circuitry to mediate their responses, nor is this the case for attractive stimuli and their representative circuitry. One potential outcome of such a network structure is that these separate circuits might enable worms to initiate stimulus-specific plasticity, irrespective of initial valence, even when sharing the same sensory-neuron class. Such a scheme would provide dynamic flexibility in associating specific stimuli with their appropriate valence.
Defining neuron response types
Recent work has shown that AWA can spike when appropriately stimulated and has suggested other worm neurons may share this property (Liu et al., 2018). In the course of our recordings we witnessed three AWA response types repeated amongst our animals (Fig.6I): a single fast peak (also visible in its mean response to 2-butanone), multiple fast peaks, and a fast rise followed by a slow decay (also visible in its mean response to 2,3-pentanedione). We searched for other neurons with fast spike-like activity in our recordings and discovered them in I5 (Fig.6J). Among other results, we also found that AWC overshoots the baseline in its mean response to the removal of 2-butanone but, maintains the downstep in its mean response to the removal of 2,3-pentainedione (Fig.6E-F). Similarly, AFD displays a large OFF response upon the removal of NaCl (Fig.6H). ADF, ASK, and BAG all exhibit inhibition in response to blue light and excitation in their other responses (Fig.6B-F).
Wired connectome versus functional activity patterns
The worm connectome was published nearly 35 years ago (White et al., 1986). Despite this monumental effort, teasing apart a role for various neural circuitry has progressed at a slow pace. The wired connectome supports many possibilities for circuit dynamics, reflecting its considerable flexibility for various types of worm behavior. Our stimulus-response recordings presented a unique opportunity to examine the relationship between wiring and functional activity within the modalities tested. We ran cross-correlations, within each animal, across neuron pairs. These cross correlations served as a proxy for connection strength. Comparing these measures to the connectome’s chemical and electrical connectivity, both linearly and ranked, revealed a poor fit between wiring and functional activity (Fig.6K). Specifically, the chemical connectome exhibited a Pearson’s correlation of r=0.08 and fared even worse for Spearman’s rank-order correlation rs=0.05. The electrical connectome exhibited Pearson’s r=0.26 and Spearman’s rs=0.16. Since left-right neuron pairs of the same class present highly-correlated traces, we worried that these might be dominating our analysis. Therefore, we removed these correlated pairs and reran the analysis. This too yielded poor correlations for the chemical (r=0.07, rs=0.04) and electrical connectomes (r=0.09, rs=0.11). To rule out further potential confounding factors, we removed correlations between nearby neurons (≤5µm apart) and tried filtering our traces as well (bandpass of 2s to 240s) but, neither of these improved measures of correlation.
Our findings indicate that the wired connectome and functional activity patterns display almost no correspondence with each other. Several possibilities that may explain the discrepancy between these two connectomic views are: 1) synaptic weights may not be representative of neuronal response characteristics; 2) the presence of extrasynaptic spill-over communication (surmised to exist based on our expression analysis of classic neurotransmitter receptors, as described in previous sections); 3) the wired connectome has no representation for the over 400 neuropeptides and over 100 peptidergic receptors present in the worm genome (Hobert, 2013); 4) connectome wiring may have more variability than previously assumed; 5) our camera and/or nuclear GCaMP sensor may be too limited in their spatiotemporal resolution; 6) microfluidic confinement and/or muscle paralysis induce non-uniform changes in synaptic activity. Nevertheless, while not unexpected, these results do highlight the considerable benefits of measuring and analyzing functional activity to obtain more complete views of neural circuitry.
Using NeuroPAL as a tool for neuronal-fate analysis
Our fourth application of NeuroPAL is, conceptually, entirely distinct: rather than making use of it to identify GFP or GCaMP signal, we instead focus on the highly diverse set of reporters present on the NeuroPAL transgene. These reporters provide an intrinsic measure for adoption of neuronal identity and, hence, mutations in genes affecting neuronal identity acquisition should be easily visualized as alterations of the stereotyped NeuroPAL color map. As one of many possible proofs of principle, we chose the conserved transcription factor PAG-3/Gfi. PAG-3 has been shown to orchestrate the maturation and fates of the VA and VB ventral motor-neuron classes (Cameron et al., 2002). Crossing NeuroPAL otIs669 with two different strains carrying pag-3 null alleles, n3098 and ok488, we confirmed that VA and VB are absent in pag-3 mutants via the absence of their NeuroPAL color barcodes (Fig.7A,B; Supplement Table 2). Unexpectedly, we found significant alterations in the coloring of two other neurons, AVE and PVR, not previously known to express pag-3. We analyzed the full expression pattern of a fosmid-based pag-3 reporter and found that PAG-3 is indeed expressed in AVE and PVR, among other previously missed neural expression (Fig.7C).

(A) Altered NeuroPAL coloring reveals neurons with altered fate in pag-3(-) mutant backgrounds (pag-3(n3098);otIs669[NeuroPAL] and pag-3(ok488);otIs669[NeuroPAL]): the pre-motor interneuron AVE gains blue coloring, PVR loses all its green coloring, and the VA and VB motor neurons are missing entirely
(B) NeuroPAL quantification of pag-3(-) altered neurons. Statistics are ordered as WT, n3098, ok488, with Bonferroni correction for 8 pag-3(-) tests (N=31,31,30 for all tests). AVE gains blue (WT-Expression=100%,2%,3%; p=10−14,10−13 – One-Sided Rank Sum Test). PVR loses all its green (WT-Expression=100%,16%,37%; p=10−15,10−17 – One-Sided Fisher’s Exact Test). Both VA2 (WT-Present=100%,48%,37%; p=10−5,10−7) and VB3 (WT-Present =100%,16%,37%; p=10−11,10−7) are missing entirely (One-Sided Fisher’s Exact Test).
(C) PAG-3/Gli expression as assessed with a fosmid reporter (wgIs154[pag-3::TY1::EGFP::3xFLAG + unc-119(+)];otIs669[NeuroPAL]): ADA, ALM, AQR, AVD, AVE, AVF, AVH, AVJ, AVM, BDU, DVC, I1, I2, I6, PLM, PQR, PVC, PVM, PVQ, PVR, PVW, RID, RIG, RMG, VA11-12, and URY (previously published expression in bold).
(D) EOR-1/PLZF has broad, likely ubiquitous, expression, as assessed with a fosmid reporter (wgIs81[eor-1::TY1::EGFP::3xFLAG + unc-119(+)].;otIs669[NeuroPAL]).
(E) NeuroPAL reveals the total loss of blue RMED/V coloring (ggr-3, pdfr-1, and unc-25 reporters) in the eor-1(-) mutant backgrounds (eor-1(cs28);otIs669[NeuroPAL] and eor-1(ok1127);otIs669[NeuroPAL]) but preservation of the panneuronal marker, indicating the preservation of neuronal fate. Validation of the NeuroPAL findings showing the loss of RMED/V unc-25::UNC-25::GFP (otIs514) expression and the preservation of unc-47(fos)::mCherry (otIs565) in the eor-1(-) mutants (eor-1(cs28);otIs514;otIs565 and eor-1(ok1127);otIs514;otIs565). F) NeuroPAL quantification of RMED/V in the eor-1(-) mutants. Statistics are ordered as WT, cs28, ok1127, (N=32,35,30) with Bonferroni correction for 8 eor-1(-) tests, including those in G.
(F) RMED (WT-Expression=100%, 6%, 0%; p=10−16,10−17) and RMEV (WT-Expression=94%, 37%, 23%; p=10−5,10−7) lose blue or could not be confidently identified – One-Sided Fisher’s Exact Test.
(G) otIs514;otIs565 statistics and quantification of bright (2), weak (1), or lost (0) unc-25::GFP expression (N=35,35,39). Display conventions and statistical corrections are continued from F. Percentages are ordered as bright:weak:lost expression. RMED (WT-Expression=97:3:0%, 0:26:74%, 0:36:64%; p=10−14,10−14) and RMEV (WT-Expression=97:3:0%, 11:46:43%, 18:69:13%; p=10−11,10−10) expression – One-Sided Rank Sum Test.
To challenge the efficacy of NeuroPAL in mutant analysis, we turned to the conserved transcription factor EOR-1/PLZF (Howard and Sundaram, 2002) which, as shown by its fosmid-based reporter, is ubiquitously expressed in all cells, at all stages of development (Fig.7D). This broad expression precludes an a priori hypothesis of: (a) whether EOR-1 has a function in the nervous system and (b) if so, in which neurons. Thus, EOR-1 presented a unique opportunity to test the power of the NeuroPAL as a hypothesis-free method for screening neural-fate alterations. We crossed NeuroPAL otIs669 to two eor-1 strong loss-of-function alleles and compared the mutant coloring to our standard map (Fig.7E; Supplement Table 3). Among the most striking changes, we found total color loss in the normally blue-colored RMED/V (RMED p=10−16,10−17; RMEV p=10−5,10−7 – One-Sided Fisher’s Exact Test). The RME class neurons are 4-fold symmetric GABAergic neurons (McIntire et al., 1993). The RMEL/R remain unaffected in the eor-1 mutant background. RMED/V retained the panneuronal marker in eor-1(-) animals, suggesting that they remained neurons, but the total loss of the blue mTagBFP2 reporters indicated a considerable alteration in their fate. The stereotyped blue coloring of RMED/V neurons is a consequence of the ggr-3, pdfr-1, and unc-25 reporters driving mTagBFP2 (Table 1). UNC-25/GAD encodes the enzyme glutamic acid decarboxylase, requisite for synthesizing GABA (Jin et al., 1999). The loss of the unc-25 reporter suggested that EOR-1 engineers GABAergic fate in RMED/V. Further in this pathway, after GABA synthesis, UNC-47/VGAT is required to package GABA into vesicles for synaptic release. Therefore, we crossed the two eor-1 mutants to otIs514[unc-25::GFP];otIs565[unc-47fosmid::mCherry], a bright green UNC-25 translational reporter covering the entire 5’ intergenic loci up to the 6th exon, and a red unc-47 transcriptional fosmid reporter (Fig.7E,G). These crosses confirmed the loss of UNC-25 in RMED/V (RMED p=10−14,10−14; RMEV p=10−11,10−10 – One-Sided Rank Sum Test) and its preservation in RMEL/R (data not shown). However, no loss of unc-47 was witnessed in the RMED/V suggesting that these neurons retain their ability to transport GABA into vesicles. Taken together, these two test cases illustrate how NeuroPAL can be systematically used to analyze the effect of developmental-control genes on nervous-system differentiation without any previous knowledge, or specific hypothesis, about the site of function for such genes.
Automating the identification of neuronal cell classes
To facilitate use of NeuroPAL in its many possible applications, we created multiple instruction manuals guiding researchers in configuring their microscope and identifying neurons using the NeuroPAL color map (https://www.dropbox.com/sh/7d18xyn9tphln5r/AACHFcb8W2kwViAUfZ2AX8Iua?dl=0). With these manuals, users can achieve 100% identification accuracy for all neurons in the worm; nevertheless, we encourage researchers to take multiple images in order to account for worm variability and imaging orientations that obscure densely populated ganglia. In the previous sections of this paper, all neuron identifications were performed by human annotators. Unfortunately, human annotation does not scale well for larger experiments. A single head contains nearly 200 neurons and, if one needs to identify all the head neurons for multiple animals, the task can take several days.
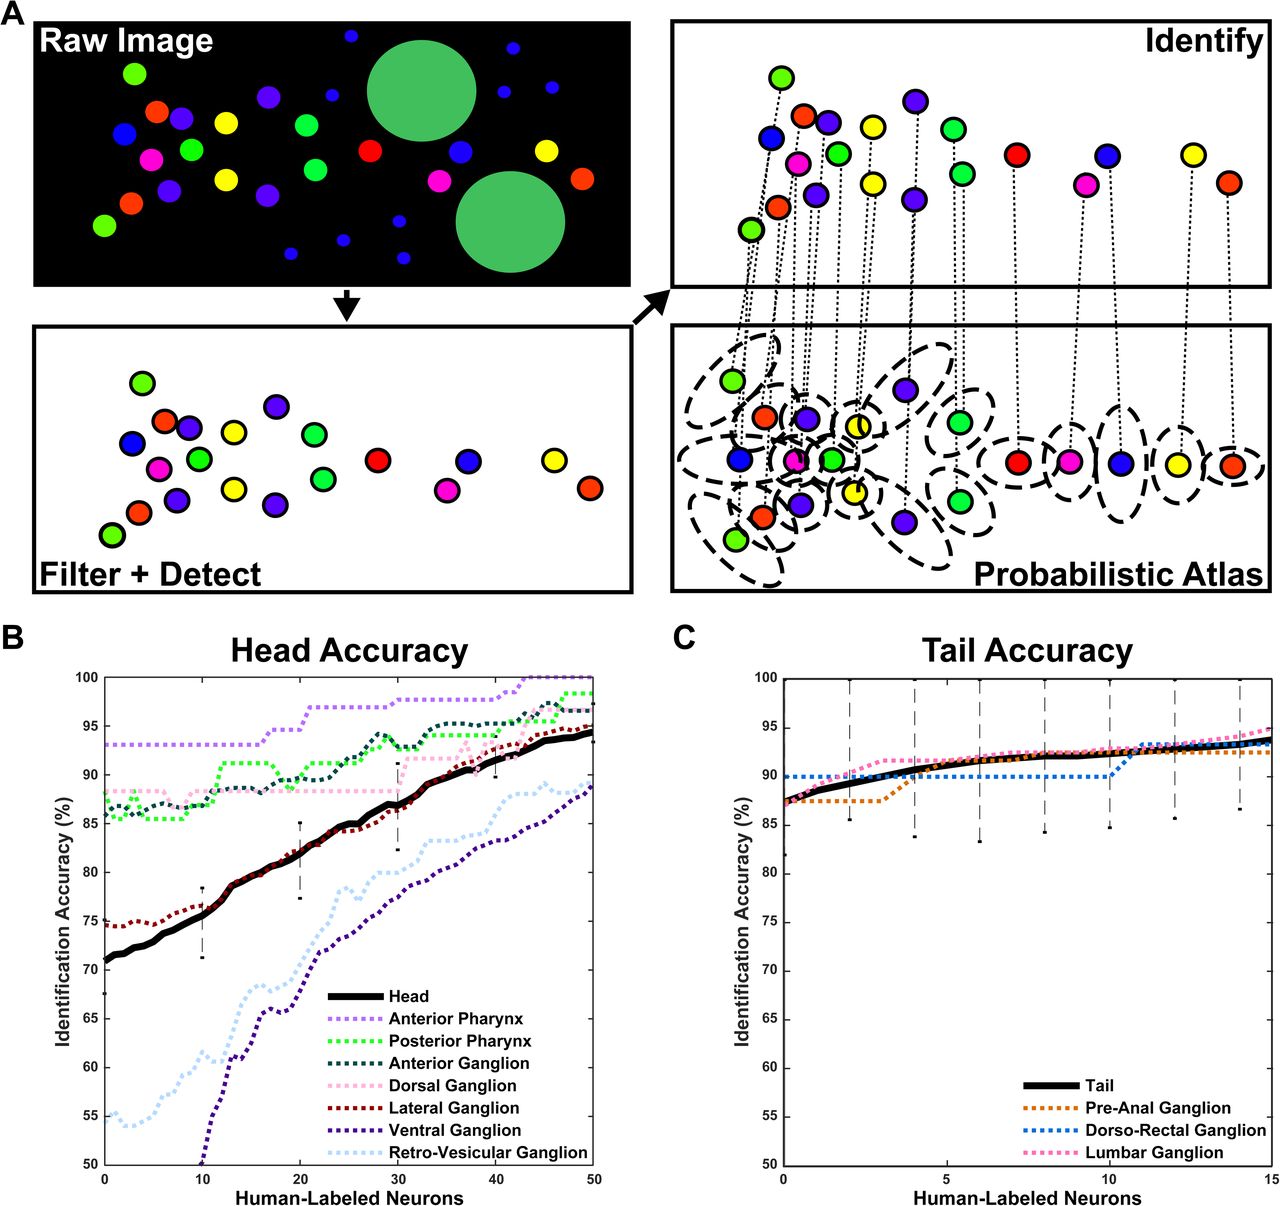
To speed up neural identification and enable high-throughput experiments, we designed software to automate the task of neural identification. Our software takes raw, three-dimensional, multi-color images as input and applies three modular steps to the raw data (Fig.8A). First, a filtering step (filter) is used to suppress non-neuronal fluorescence. Second, a detection step (detect) is used to extract the color and position of neuronal nuclei within the field of view. Third, an identification step (identify) is used to compare these colors and positions with a previously-estimated statistical atlas so as to output a probabilistic estimate of each cell’s identity. Complete details on each of these steps are available in the supplement (Supplement Text 1). The filter and detect steps alone achieve equivalent precision and recall rates of 90% for the head and 93% for the tail. Importantly, these steps are unsupervised – the user is not required to label any cells to train the algorithm – and we expect that, with a sufficient corpus of labeled training data, the accuracy of these combined steps can be improved further. Therefore, we developed a graphical user interface (GUI) to facilitate manual error correction and the curation of large labeled training sets.
(A) The algorithm used for automated neural identification. Raw images undergo filter + detect steps to extract their neurons. Extracted neurons then undergo an identify step, matching them to a statistical atlas of color and position, thus providing identities for all detected neurons.
(B,C) Algorithmic accuracy begins at 70.9±2.2% for the head and 87.4±9.5% for the tail, with no supervised human labeling. 15 human labels bring head accuracy above 80% and, an additional 20 improve accuracy beyond 90%. For the tail, 3 human labels are sufficient to push accuracy above 90%. Overall accuracy is displayed as a black line. Accuracy for each ganglion is displayed as a dotted, colored line (see legend). Many of the neurons and ganglia have high identification accuracy and confidence. The ventral and retro-vesicular ganglia present the problem areas, likely due to high positional variance therein. See Supplement Text 1 for further details.
The identify step is based on a joint mixture-of-Gaussians with affine-alignment model, similar to the approach proposed by Evangelidis and Horaud (Evangelidis and Horaud, 2018). The model estimates a statistical atlas that summarizes the mean location and color, for each cell, along with the variability of these features (Fig.3C & Fig.8A). When using this statistical atlas to identify cells in held-out test datasets, accuracy rates varied across ganglia, largely depending on their cell density (Fig.8B,C; Supplement Text 1); for example, the model achieves high accuracy in the tail but low accuracy in the ventral ganglion. Overall automated accuracy was 71±2% for the head and 87±10% for the tail when given both the color and location of cells. When given location only, as is the case when using a panneuronal reporter without color information, automated accuracy achieved 50±4% for the head and 69±8% for the tail (Supplement Text 1). These results imply a substantial improvement in accuracy via the additional color information.
Of note, automated-identification errors are not randomly distributed. The model determines the confidence associated with each neuron’s computed identity. Therefore, researchers can choose high-confidence neurons alone or review low-confidence assignments using semi-automated identification. Moreover, as the user annotates low-confidence neural assignments, the software uses their annotations to rapidly increase the confidence for all putative neuron identities. The addition of three human-labeled neurons brings the tail accuracy above 90% (Fig.8C). The addition of 15 human-labeled neurons brings the head accuracy above 80% and, 20 more human-labeled neurons are necessary to achieve > 90% accuracy in the head (Fig.8B). To improve accuracy during semi-automated neural identification, the model outputs a full probability matrix that each detected cell k corresponds to potential neuron i. The GUI then prompts the user to label the next cell for which the neural identity is least certain, iteratively updating the probability matrix with this new information, thereby reducing the number of user inputs required to reach a given level of identification accuracy.
CONCLUSIONS
Here, we introduce the NeuroPAL, a tool for complete neural identification, illustrating its design, implementation, and use for various applications. As such we aim to significantly lower the barriers to entry, in using this tool, by providing methodological instruction and (semi-)automated identification software for common tasks. Furthermore, we illustrate the means to adapt the NeuroPAL technique so as to solve similar problems: designing complex multicolor barcoding to unambiguously identify cells and tissue. This strategy of combining five distinguishable fluorophores (four landmarks + GFP/CFP/YFP) may be repurposed to accommodate other labeling schemes in worms (e.g., in delineating cell lineages, bundled neurites, and subcellular inventories) and may even be extensible to other model organisms.
AUTHOR CONTRIBUTIONS
All authors contributed in writing this manuscript. EY and OH designed the NeuroPAL, metabotropic, and mutant experiments, which EY performed then analyzed. EY built the NeuroPAL, manual, all metabotropic reporters (except gbb-2, as noted), mutant crosses, panneuronal GCaMP6s, and performed all non-automated identification. GEM, AN, RS, EV, and LP designed the automated identification algorithms and software, their validation, and together with EY built the GUI. VV, AL, and AS designed and built the whole-brain imaging scope and microfluidic device then, together with EY and OH, designed the whole-brain imaging experiments. AL performed all whole-brain imaging experiments. VV designed and built the software to extract neural traces from the whole-brain imaging experiments and connect them with their identity. EY and VV designed and built the software to analyze the whole-brain imaging data. VV designed and built the software to analyze correlations between functional activity and the connectome. AL designed and performed all chemotactic assays. EY designed and performed all non-stimulus behavioral phenotyping.
FUNDING
Hobert Lab: Howard Hughes Medical Institute. Paninski Lab: NIBIB R01 EB22913, NSF NeuroNex Award DBI-1707398, Simons Collaboration on the Global Brain, and the Gatsby Charitable Foundation. Samuel Lab: NSF, NIH. Albert Lin: NSF iPoLS Graduate Student Network Fellowship. Vivek Venkatachalam Burroughs Wellcome Fund. Gonzalo E. Mena: The Harvard Data Science Initiative Postdoctoral Fellowship
EXPERIMENTAL PROCEDURES
Worm Maintenance
All worms were raised at 20C, on NGM plates, and fed OP50 E. coli as previously described (Brenner, 1974), unless otherwise noted.
Plasmids and Injections
As a general note, to conserve on space in extrachromosomal arrays, we chose to remove plasmid backbones and instead used linear DNA amplified via PCR which was also previously shown to improve expression levels (Etchberger and Hobert, 2008). We injected these as complex arrays, with sheared bacterial DNA serving as spacers, to minimize the risk of possible crosstalk amongst reporters. All plasmid maps and their injected concentrations can be found at: https://www.dropbox.com/sh/f2v20nthuhzgamw/AABJuIpJUtfMj4BgpKtfgKw0a?dl=0. All fluorophores were ordered from IDT and/or cloned via standard techniques (Gibson, restriction-free, T4 ligase, or QuikChange™ mutagenesis) into the pPD95.62 Fire vector (a gift from Andrew Fire)(Gibson et al., 2009; van den Ent and Lowe, 2006). The UPN was constructed via a single quadruple promoter fusion (Hobert, 2002) (plasmid sequences available at https://www.dropbox.com/sh/f2v20nthuhzgamw/AABJuIpJUtfMj4BgpKtfgKw0a?dl=0) (Supplement Data 1). All NeuroPAL reporters were cloned via PCR, gel purified, then inserted using the aforementioned standard techniques into the landmark fluorophore plasmid vectors. All injected NeuroPAL reporters were PCR amplified (Supplement Data 1) and gel purified to remove their vector backbone. Tester NeuroPAL strains were injected as complex arrays into pha-1(e2123) with pBX[pha-1(+)] to rescue at the selection temperature 25C (Granato et al., 1994). Final NeuroPAL strains were injected into N2 without pha-1(+). The panneuronal GCaMP strain, UPN::NLS::GCaMP6s;arrd-4::NLS::GCaMP6s was injected complex into N2. Integrations were performed using gamma irradiation. All integrant worms were outcrossed 8x. Non-integrant reporter strains for identification were injected with pBX[pha-1(+)], rescuing pha-1(e2123) and pAB1[inx-6(prom18)::TagRFP-T] (an anterior pharyngeal marker), then raised at 25C for selection.
Transgenic and mutant strains
Transgenic and mutant strains used in this study are available in the supplement (Supplement Table 1).
Worm Phenotyping
Dye-fill with DiO, brood-size quantification, chemotactic quadrant and drop-test assays, and high-resolution behavioral phenotyping were performed using standard protocols (Bargmann et al., 1993; Chase and Koelle, 2004; Hedgecock et al., 1985; Hilliard et al., 2002; Yemini et al., 2013).
Fluorophore choice
The emission spectrum for published fluorophores can roughly be divided as blue, cyan, green, yellow, orange, red, and far red. GFP has a long emission tail; therefore, to avoid confusing its signal with NeuroPAL landmarks, we excluded cyan, green, yellow, and orange emitting proteins. This left us with only three landmark emission channels: blue, red, and far red. The blue fluorophore EBFP2 is a GFP derivative and would preclude the ability to boost reporter signal via cognate GFP staining (Ai et al., 2007). mTagBFP2 is brighter alternative derived from TagRFP-T (Subach et al., 2011) and, for this reason, we chose it as our first NeuroPAL landmark. As a caveat, all red and far-red fluorescent proteins produce conformations with GFP-like excitation and emission and, their mature fluorophores exhibit an equilibrium between this green and the preferred red emission states (Chu et al., 2014). For this reason, we looked for bright red and far-red fluorophores with a high red-to-green emission ratio and considerable photostability. This yielded our next two landmark fluorophores: TagRFP-T and mNeptune2.5 (Chu et al., 2014; Shaner et al., 2008).
To expand the pool of candidates further we looked towards the large-stokes shift (LSS) fluorophores. LSS fluorescent proteins have a long gap between their excitation wavelengths and emission bands; for example, GFP is excited by 488nm and emits green while its LSS-derivative T-Sapphire is excited by 405nm and shares a nearly identical green-emission band as GFP (Zapata-Hommer and Griesbeck, 2003). In fact, wild-type (WT) GFP is a mixture of isoforms excited either by 405nm or 488nm. WT GFP was mutated to stabilize both isoforms independently, thus yielding T-Sapphire and enhanced GFP (EGFP – often abbreviated as simply GFP)(Yang et al., 1996). Unfortunately, despite this mutagenesis, the commonly used variant of GFP retains considerable excitation at 405nm, ruling out both T-Sapphire and the yellow-emitting mAmetrine (Ai et al., 2008) for use as landmarks. This left only red and far-red LSS fluorophore candidates. Initially we tested mBeRFP (Yang et al., 2013) but found it was excited by a broad range of wavelengths, including those exciting TagRFP-T and mNeptune2.5; furthermore, mTagBFP2 and GFP excitation wavelengths caused mBeRFP to produce a bright green emission, thus confounding our GFP signal channel. Consequently, we arrived at the newly-published CyOFP1 as one of our last available choices (Chu et al., 2016). CyOFP1 has nearly identical emission to TagRFP-T but, its excitation wavelength (488nm), fails to excite TagRFP-T; therefore, one can excite and visualize CyOFP1 independently of TagRFP-T, simply by using 488nm excitation. As a result of this brightness and photostability, we chose CyOFP1 as our fourth and final NeuroPAL landmark. Fortunately, mNeptune2.5’s preferred excitation, 599nm, fails to excite either CyOFP1 or TagRFP-T. Unfortunately, TagRFP-T’s preferred excitation wavelength, excites both CyOFP1 and mNeptune2.5. Thus three of our landmark fluorophores can be easily distinguished from each other and GFP but, the remaining one, TagRFP-T, suffers mild bleed through from both the CyOFP1 and mNeptune2.5 landmarks. For this reason we chose mTagBFP2, CyOFP1, and mNeptune2.5 to represent our primary color palette, used to pseudo-color neurons with an RGB color code (Fig.1C). TagRFP-T was instead assigned to drive the panneuronal reporter. As a result, bleed through from the other two neural landmarks do not interfere with TagRFP-T’s role in highlighting which cells are neurons. When testing our NeuroPAL landmarks we found that, despite claims of monomericity, mTagBFP2 and CyOFP1 showed aggregation when expressed at high concentration; therefore, we tamed their oligomerization by tethering them to the histone H2B.
Generation of panneuronal GCaMP6s lines
Previous work had evidenced a problem with “panneuronal” markers: weak expression in sensory neurons. Also, having apportioned our panneuronal UPN promoter to TagRFP-T in the NeuroPAL, we worried about crosstalk were we to reuse it in crossing the NeuroPAL to a hypothetical UPN::GCaMP6s strain. Therefore, we used the bright panneuronal promoter rab-3 instead, in conjunction with the pansensory marker arrd-4 to drive strong nuclear GCaMP6s across all neurons, co-injecting these two reporters together. We tested 6 concentrations of both reporters (8, 16, 32, 48, 64, and 96ng/ul), injected as a complex array, and selected 32ng/ul as a good balance between brightness and health. We integrated this array and chose the three brightest integrants: otIs671, otIs672, and otIs672. These strains were then outcrossed 8x. We phenotyped our three GCaMP6s integrants and determined otIs671 and otIs672 to be the two healthiest choices (see Experimental Procedures). These GCaMP6s integrants were then crossed to our two brightest NeuroPAL integrants, otIs668 and otIs669. By eye, otIs669;otIs672 yielded the brightest and healthiest animals and was thus designated OH15368, then phenotyped (see Experimental Procedures). To enforce isogenicity, beginning with OH15368, we singled worms consecutively 23x to yield the strain OH15500. Naively, assuming each generation has a 50% chance of homozygosing its 6 chromosomes, OH15500 has the proverbial “less than 1-in-a-million” chance of being heterozygous. Nonetheless, this computation fails to account for recombination events, balancers, and biases in healthy development that may originate from retaining heterozygosity.
Since our experiments measure circuit activity in response to sensory stimulation, we worried that OH15500, a combination of two bright integrants, may have altered sensory performance. To ensure that OH15500 have WT sensory equipment and behavioral preferences, we ran several phenotypic tests. First, we used DiO to dye fill sensory equipment (data shown at: https://www.dropbox.com/sh/tz7j5dgbel1if6w/AAArS3uAldA8NNcHwJ2J6BcAa?dl=0) and found all visible neurons fill appropriately in both OH15500 and N2 (N=30 for both strains). Second, we used chemotaxis assays to 10−4 2-butanone, 10−4 2,3-pentanedione, 25mM NaCl, and 1M NaCl (data shown at: https://www.dropbox.com/sh/tz7j5dgbel1if6w/AAArS3uAldA8NNcHwJ2J6BcAa?dl=0) and found that despite showing differences in the magnitude of their response, OH15500 retained WT valence for olfaction and gustation, thus being attracted to the odorants and the lower salt concentration, while being repelled by the higher salt concentration. NaCl directs opposing valence depending on concentration. To ensure the microfluidic delivery of 200mM retained aversive valence, we performed drop tests on OH15500 and found that, at this high concentration, OH15500 retain aversive valence and failed to show a significant difference from their WT counterparts (123/138 N2 vs. 117/140 OH15500 reversals – p=0.2; power=73% – Two-Sided Fisher’s Exact Test). Finally, we note that OH15500 display slow growth and fertility defects (data shown at: https://www.dropbox.com/sh/tz7j5dgbel1if6w/AAArS3uAldA8NNcHwJ2J6BcAa?dl=0). These results indicate that, while OH15500 may not have optimal health, they do respond in a WT manner and that very strong stimuli evoke OH15500 responses that are not significantly different from WT.
Fluorophore, Reporter, and Mutant Imaging
Fluorophores were imaged with a standard Zeiss LSM880 which permitted quantification of their emission spectra upon excitation with 7 lasers: 405, 458, 488, 514, 561, 594, and 633 nm. NeuroPAL reporter and mutant crosses were imaged with the same scope. When not performing a DIC overlay, gamma correction of ∼0.5 was applied to images so as to improve color visibility. Occasionally, histograms were adjusted to balance colors for visibility. These image adjustments are necessary and suggested for NeuroPAL identification in order to deal with a variable range of GFP/CFP/YFP reporters and color alterations in mutant backgrounds.
Whole-brain Imaging Microscope with Microfluidic Stimulus Delivery
Whole-brain activity was imaged, together with microfluidic stimulus delivery, via a modified version of an existing imaging system (Chronis et al., 2007; Si et al., 2019), using an inverted Nikon Ti-e spinning disk confocal with 60x water immersion objective (1.2 NA) and Andor iXon Ultra 897 EMCCD camera. Animals were immobilized with M9 buffer containing 1 mM tetramisole hydrochloride, then loaded into the microfluidic chip (Larsch et al., 2013). Imaging was performed in three stages: 1) a 5-color image volume was obtained for neural identification 2) a 2-minute waiting period was observed, in darkness, to permit the worms to rest from the identification volume and, 3) a 4-minute recording of the panneuronal, nuclear GCaMP6s activity was captured at approximately 4.1 brains/second. NaCl was delivered at 200mM. 2-butanone and 2,3-pentanedione were delivered at standard concentrations of 10−4. Stimuli were separated by 1-minute intervals, including a 1-minute wait upon initiating recording in order to measure the initial blue light response. Gustatory & odor stimuli were delivered in DI water. Stimulus-free DI water was delivered between stimuli as the control. Gas content for stimuli and control was identical. Switching between stimulus and control completed within ∼10ms, approximately a single frame. The order of delivery for chemical stimuli was rotated amongst animals as a control. Previously published code was modified to extract neural traces from the activity recordings, then link these to the identification volumes. Further details for the Microfluidic Methods are available in Supplement Text 2.
Statistics, Code, and Software
All statistics were run in Matlab with standard toolboxes with the exception of the OME Bio-Formats API (used to read in Zeiss CZI and Nikon ND2 file formats)(Linkert et al., 2010), and MathWorks FileExchange functions: myfisher22.m (Cardillo G, 2007), munkres.m (Cao Y, 2011), and logsumexp.m (Minka T, 2016). All code was generated in Matlab. The code and software are made freely available at:
ACKNOWLEDGEMENTS
We thank Qi Chen for generating transgenic lines. We thank Michael Z. Lin, Vladislav Verkhusha, and Robert E. Campbell for their considerable help in choosing fluorescent proteins. We thank Michael Koelle for his generous gift of the GBB-2 reporter fosmid. We thank Scott Linderman and Andrew Leifer for many helpful discussions regarding automated neural identification.
LITERATURE CITED


