

Abstract
Heterogeneity within specific cell types is common and increasingly apparent with the advent of single-cell transcriptomics. Transcriptional and functional cellular specialization has been described for insulin-secreting β-cells of the endocrine pancreas, including so-called extreme β-cells exhibiting >2 fold higher insulin gene activity. However, it is not yet clear whether β-cell heterogeneity is stable or reflects dynamic cellular states. We investigated the temporal kinetics of endogenous insulin gene activity using live-cell imaging, with complementary experiments employing FACS and single-cell RNA sequencing, in β-cells from Ins2GFP knock-in mice. In vivo staining and FACS analysis of islets from Ins2GFP mice confirmed that at a given moment, ∼25% of β-cells exhibited significantly higher activity at the conserved insulin gene Ins2(GFP)HIGH. Live-cell imaging captured on and off ‘bursting’ behaviour in single β-cells that lasted hours to days. Single cell RNA sequencing determined that Ins2(GFP)HIGH β-cells were enriched for markers of β-cell maturity and had reduced expression of anti-oxidant genes. Ins2(GFP)HIGH β-cells were also significantly less viable at all glucose concentrations and in the context of ER stress. Collectively, our results demonstrate that the heterogeneity of extreme insulin production, observed in mouse and human β-cells, can be accounted for by dynamic states of insulin gene activity. Our observations define a previously uncharacterized form of β-cell plasticity. Understanding the dynamics of insulin production has relevance for understanding the pathobiology of diabetes and for regenerative therapy research.
Introduction
Pancreatic β-cells in the islets of Langerhans are the only source of circulating insulin, a conserved and essential hormone that is required for nutrient homeostasis and life (Szabat et al., 2016). Insulin production is highly demanding, as insulin mRNA can account for roughly half of all β-cell mRNA and its synthesis, folding and processing require semi-specialized transcription factors, enzymes and cellular conditions. However, not all β-cells appear the same. Indeed, functional β-cell heterogeneity is well established (Benninger and Hodson, 2018), including cellular specialization for islet cell synchronization, insulin secretion, insulin production, and marker gene expression (Bader et al., 2016; Dorrell et al., 2016; Heimberg et al., 1993; Johnston et al., 2016; Kiekens et al., 1992; Kolic and Johnson, 2016; Ling et al., 1998; Pipeleers, 1992; van der Meulen et al., 2017; Wills et al., 2016; Xin et al., 2018). For example, recent in situ imaging has revealed the existence of extreme β-cells, defined as having >2 fold Ins2 mRNA than the median expression as measured by single-molecule fluorescence in situ hybridization (Benninger and Hodson, 2018; Farack et al., 2019). Single cell RNA sequencing has shown that human β-cells also express INS over a similarly wide range (Xin et al., 2018). However, it remains unclear whether this variation is the hallmark of distinct stable populations of β-cells, or whether it is indicative of transitions between more labile β-cell states.
To date, the vast majority of islet cell ‘sub-populations’ have been defined by single time-point snapshots, making it impossible to know to what extent observed β-cell heterogeneity represents different islet cell ‘fates’ or different islet cell ‘states’. This information is essential for interpreting existing and future data in the field. Using a dual Ins1 and Pdx1 promoter reporter construct and live-cell imaging, we have previously demonstrated that mouse and human β-cells can transition between less and more differentiated states over a time scale of ∼24 hours (Szabat et al., 2010; Szabat et al., 2009; Szabat et al., 2011). However, the artificial promoter constructs in these early studies may not reflect endogenous gene activity, leaving open the question of whether endogenous insulin gene activity is similarly dynamic.
In this study, we studied endogenous insulin gene activity using an Ins2GFP knock-in/knockout mouse line in which the coding sequencing of the evolutionarily conserved Ins2 gene has been replaced with GFP (Wakae-Takada et al., 2013). Live-cell imaging of dispersed cells from Ins1mCherry:Ins2GFP/wt mice revealed that GFP fluorescence flashed on and off in a subset of cells, suggesting bursts of transcription at the Ins2 gene locus rather than stable heterogeneity. Single-cell RNA sequencing was used to characterized the Ins2(GFP)HIGH cellular state in an unbiased way, revealing increased markers of β-cell maturity as well as alterations in protein synthesis machinery and cellular stress response networks. Pancreatic β-cells in the Ins2(GFP)HIGH cellular state were also more fragile across a range of stress conditions. To the best of our knowledge, our observations are the first to define the temporal kinetics of endogenous insulin gene activity, which represents a previously uncharacterized form of β-cell plasticity. Understanding the dynamics of insulin production has relevance for understanding the pathobiology of diabetes and for regenerative therapy research (Johnson, 2016).
Results
In vivo heterogeneity of insulin content in human β-cell and insulin gene activity in Ins2GFP mice
Heterogeneity of insulin production is an established phenomenon, and we started our study by staining human pancreas with antibodies to insulin and PDX1, a key transcription factor for β-cell survival and function (Johnson et al., 2003; Szabat et al., 2012). As expected based on single-cell RNA sequencing data (Xin et al., 2018) and previous single-cell imaging of human β-cells (Johnson et al., 2006), imaging over a large dynamic range enabled the identification of β-cells with both high and low insulin protein levels in human pancreas (Fig. 1A). We have previously shown limited correlations between insulin content and Pdx1 immunofluorescence or nuclear localization in human β-cells (Johnson et al., 2006). In order to study insulin gene activity in living cells, we examined islets from mice in which the coding sequencing of the evolutionarily conserved Ins2 gene has been replaced with GFP (Wakae-Takada et al., 2013)(Fig. 1B). Mice lacking 1 or 2 functional Ins2 alleles had normal glucose homeostasis (Fig. 1C), consistent with our previous studies of Ins2 knockout mice (Mehran et al., 2012) and the ability of Ins1 to compensate (Leroux et al., 2001). Immunofluorescence staining of pancreata from Ins2GFP mice revealed a clear bimodal distribution of endogenous insulin production in vivo (Fig. 1D). Hand counting 1879 cells across 11 randomly selected islets showed that 38.7% of β-cells had substantially higher GFP immunofluorescence above an arbitrary, but consistently applied, threshold (Fig. 1D). The percentage of cells with high GFP did not appear to vary as a function of islet size. We have observed similar heterogeneity when examining the β-galactosidase knock-in in to the Ins2 locus (Mehran et al., 2012). Similarly, FACS confirmed this bimodal distribution and that less than half of all β-cells engage in high Ins2 gene transcription at a given time (Fig. 1E). FACS analysis also validated that GFP mRNA, Ins2 mRNA, and pre-mRNA were significantly increased in GFP-positive cells compared to negative cells (Fig. 1F,G), strongly suggesting that GFP protein levels accurately reflect Ins2 mRNA in this system. We did not expect there to be a perfect correlation due to the different predicted transcription-to-protein time courses for GFP and insulin (Fig. 1H; see Supplemental Materials for calculations). Nevertheless, these data demonstrate that GFP production, reflecting the activity of the endogenous Ins2 gene locus, is bimodal in vivo and ex vivo, with 25% of β-cells showing significantly higher activity. Hereafter, we refer to cells with high GFP abundance as Ins2(GFP)HIGH.

(A) Variability in insulin and PDX1 protein levels in human pancreatic β-cells in vivo. Scale bar is 20 µm. (B) The Ins2GFP/GFP knock-in mouse model. Illustration shows, so scale, the replacement of most of the second exon with wildtype GFP. The wildtype Ins2 locus is shown for comparison, including RNA-seq exon coverage, aggregate (filtered) from NCBI Mus musculus Annotation release 106 (log 2 base scaled). (C) Normal glucose homeostasis in Ins2GFP/Wt;Ins2GFP/GFP mice and WT (Male n=3-7, Female n=3-4). (D) GFP from the endogenous Ins2 gene locus is high in a subset of mouse pancreatic β-cells. Scale bar is 20 µm. (E) Detection of Ins2(GFP)LOW and Ins2(GFP)HIGH populations of β-cells by FACS. (F,G) GFP mRNA and Ins2 mRNA in Ins2GFP/Wt and Ins2GFP/GFP cells. FACS purification of cells that are negative (-) or positive (+) for GFP fluorescence relative to the background fluorescence of C57Bl6J wildtype control islets. (H) Presumed transcription-to-maturation times of GFP and insulin. See Supplemental Information for calculations and references.
Live-cell imaging of insulin gene activity in Ins2GFP;Ins1-mCherry mice
We next crossed the Ins2GFP knock-in line with transgenic mice with an allele wherein histone-fused mCherry is driven by the less complex Ins1 promoter that are known to show relatively stable mCherry fluorescence in virtually all β-cells (Benner et al., 2014), in order to have a model whereby Ins2 gene activity could be tracked in real-time, while observing all β-cells. As expected, immunofluorescence of intact pancreatic sections and FACS analysis of dispersed islets from Ins2GFP/wt:Ins1-mCherry mice showed that mCherry labelled virtually all β-cells, while GFP was robustly expressed in a clearly separated sub-set of β-cells we deemed Ins2(GFP)HIGH (Fig. 2A,B,C). qPCR of these FACS purified cells confirmed the expected elevated expression of GFP, Ins2, pre-Ins2, Ins1, and pre-Ins1 mRNA in Ins2(GFP)HIGH cells (Fig. 2D). Ins2 pre-mRNA would be expected to precede GFP fluorescence by at least 1.3 hours, as per estimations in Fig. 1H and calculations in Supplemental Information, which provides a possible explanation for the elevated pre-Ins2 in the mCherry positive, but GFP low β-cells. Both intact islets and dispersed islet cells isolated from Ins2GFP/wt:Ins1-mCherry mice showed a similar proportion of Ins2(GFP)HIGH and Ins2(GFP)LOW cells that we observed in vivo, demonstrating that this heterogeneity was not altered by isolation or dispersion/culture.

(A) Experimental model for tracking activity at the endogenous Ins2 locus (GFP) in β-cells marked with mCherry driven by an Ins1 promoter, which constitutively marks 98% of β-cells. Scale bar is 50 µm (B) Live-cell imaging of islet cells isolated and dispersed from Ins1-mCherry;Ins2GFP/wt mice. Scale bar is 50 µm. (C,D) Distinct populations of Ins2(GFP)LOW β-cells and Ins2(GFP)HIGH β-cells were FACS purified and examined by qPCR for gfp, Ins2, pre-Ins2, Ins1 and pre-Ins1 mRNA (n=3).
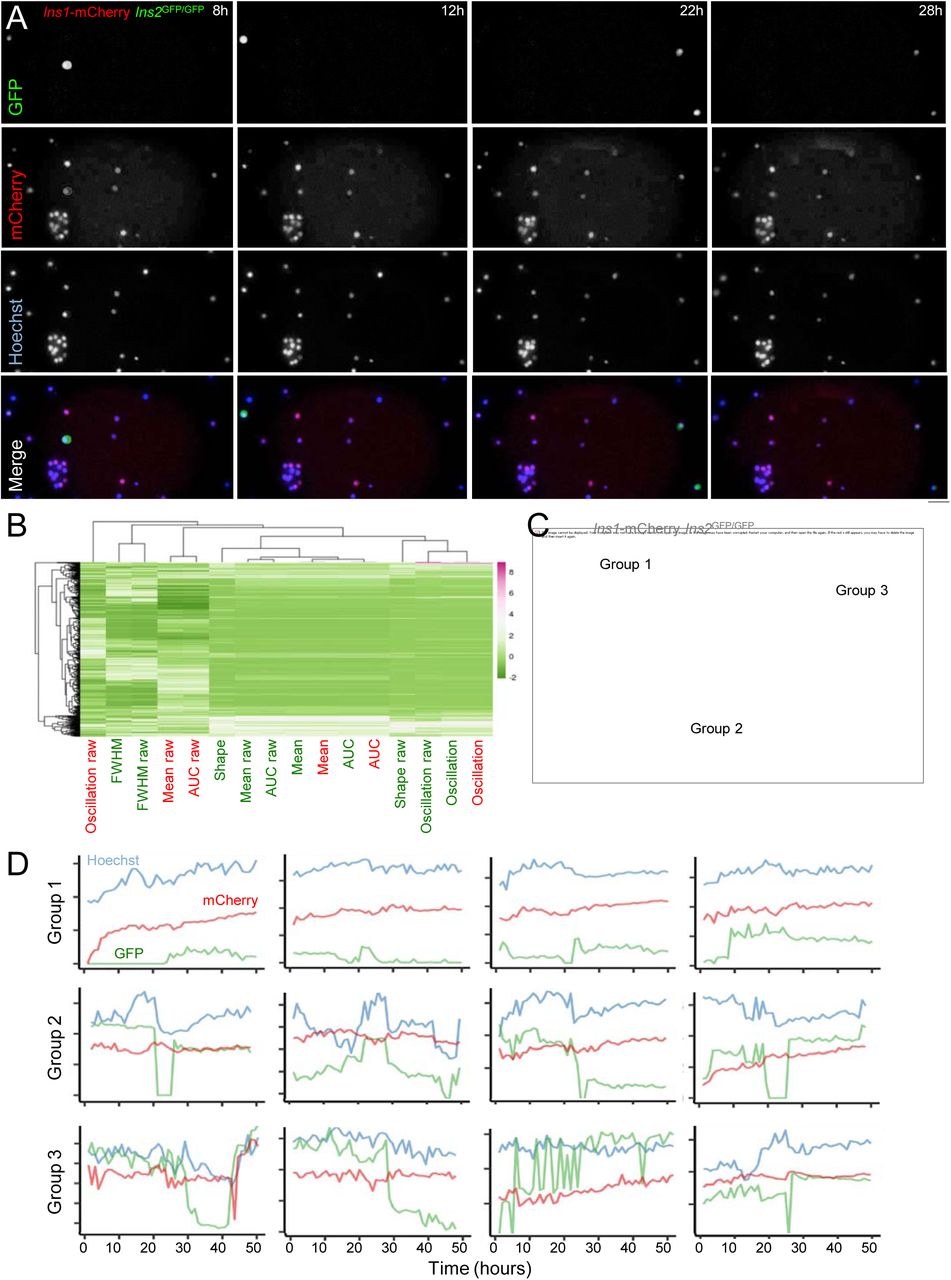
Dispersed islet cells from the resulting double-mutant Ins2GFP/wt:Ins1-mCherry were studied over ∼3 days using a high-throughput imaging system with environmental control. Remarkably, live cell imaging identified a sub-set of β-cells that transitioned in and out of Ins2(GFP)HIGH activity states over the course of 36-hour long recordings (Fig. 3A). In a pilot study, we did not observe differences in the incidence of this bursting behavior when comparing cells at 3 mM, 5 mM, 10 mM, and 15 mM glucose. We quantified and analyzed 16 cellular behaviour traits in 547 cells for the purpose of clustering them into groups using Cell Profiler software and custom R scripts. We found that 153 out of 547 cells showed dynamic changes in GFP activity (Fig. 3B,C). Principal component analysis identified 3 distinct clusters of Ins2 gene activity cell behaviours (Fig. 3C,D). Together with our in vivo data (Figs. 1,2), these long-term live-cell imaging recordings demonstrate significant dynamic fluctuations in the activity of the endogenous Ins2 locus in primary β-cells.

(A) Dynamic imaging, over 30 hours in culture, of dispersed islet cells from Ins1-mCherry;Ins2GFP/GFP mice labelled with Hoechst vital nuclear dye. Note the examples of cells with bursting GFP fluorescence. Scale bar is 50 µm. (B,C) Clustering of cellular Ins2 gene activity (GFP) dynamics and mCherry dynamics based on 16 parameters leads to 3 cellular behaviour groupings. Parameters included oscillations, (full width at half maximum) FWHM, mean, AUC, and shape (as marker of sharp peaks). (D) Examples of 3 cellular behaviour groupings are shown.
Profiling β-cell states with single-cell RNA sequencing
To characterize the Ins2(GFP)HIGH state in a comprehensive and unbiased way, we performed single-cell RNA sequencing on FACS purified Ins2(GFP)HIGH and Ins2(GFP)LOW cells from islets pooled from 3 mice (Fig. 4A,B). We then examined differential gene expression as a function of gfp mRNA (Fig. 4C), including only single cells expressing Ins1 mRNA which are presumably β-cells or rare multi-hormonal islet cells. We also considered Ins2(GFP)HIGH and Ins2(GFP)LOW as binary categories and obtained similar results (Supplemental Figure S1 A,B).

(A) t-SNE plot of all cells positive for Ins1 mRNA (β-cells) isolated and dispersed from Ins2GFP/wt mice FACS purified into either GFP-negative (-) or GFP-positive (+) groups. (B) Ins1, Ins2, and gfp mRNA quantification distributions from GFP-negative or GFP-positive single β-cells. (C) Gene Ontology Categories that are driven by genes differentially expressed in Ins2(GFP)LOW versus Ins2(GFP)HIGH β-cells. (D) Individual genes that are differentially expressed as a function of gfp mRNA expression.
In 8 week-old Ins2GFP/wt mice, gene ontology analysis showed that the Ins2(GFP)HIGH cells had significant alterations in genes involved in extracellular matrix, protein synthesis and protein cleavage. Cluster of genes ordered by gfp gradient in heterozygous Ins2GFP/wt β-cells showed that tetraspanin-28 (Cd81) and chromogranin A (Chga) that most closely correlated to gfp mRNA at the single-cell level. The gfp-high state also was characterized by increased mRNA expression of other notable genes encoding transthyretin (Ttr) and G-protein subunit gamma 12 (Gng12). The gfp-high state was associated with decreased expression of genes including soluble factors such as peptide YY (Pyy), prodynorphin (Pdyn), pancreatic polypeptide (Ppy), macrophage inhibitory factor (Mif), and Serpina7, suggesting in aggregate a less ‘polyhormonal’ and therefore, more mature, gene expression profile (Basford et al., 2012; Hrvatin et al., 2014; Johnson, 2016). In agreement with this, gfp-high β-cells had lower expression of pappalysin 2 (Pappa2), an α-cell-selective regulator of insulin-like growth factor bioavailability, and the epsilon-cell marker (Etv1)(Segerstolpe et al., 2016)(Fig. 4D). Gfp-high cells also had reduced expression of several genes linked to insulin production and secretion, such as multiple subunits of the 40S and 60S ribosomes, eukaryotic translation initiation factor 3 subunit C (Eif3c), eukaryotic translation elongation factor 1 alpha 1 (Eef1a1), peptidylglycine alpha-amidating monooxygenase (Pam), chromogranin B (Chgb), heat shock 70kDa protein 9 (Hspa9; Mortalin), G-protein subunit gamma 5 (Gng5), regulator of G-protein signaling 4 (Rgs4), synaptotagmin 4 (Syt4)(Huang et al., 2018; Thomsen et al., 2018)(Fig. 4D). Thus, in young mice, the Ins2(GFP)HIGH cell state is associated with a mature single-cell gene expression profile and a reorganization of protein synthesis machinery.
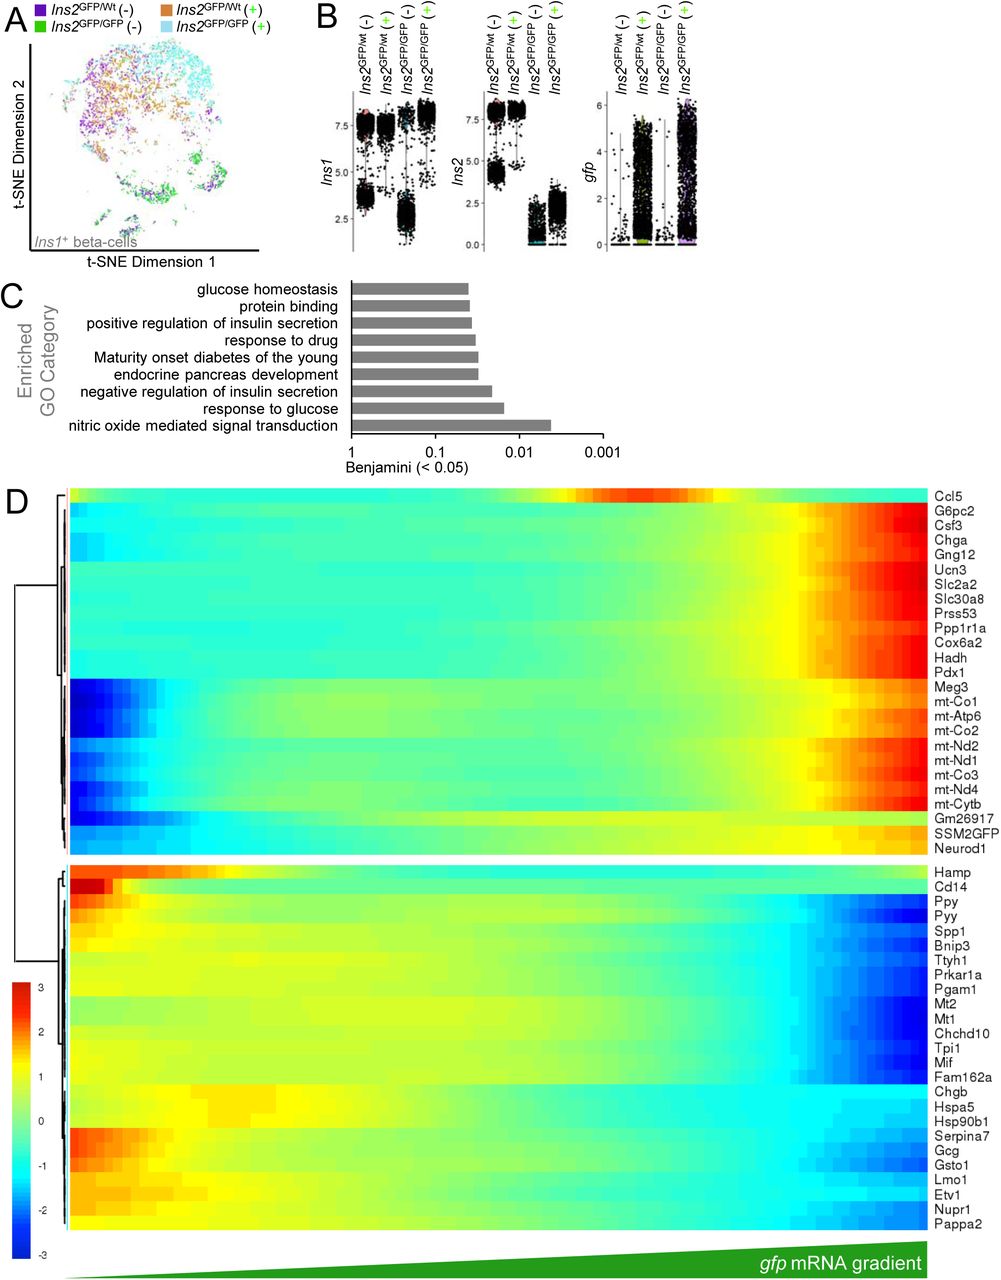
Age is known to significantly alter the properties of pancreatic β-cells, including their function and ability to enter the cell cycle (Rankin and Kushner, 2009). Thus, we conducted an additional similar study in three 60 week-old mice. In this experiment, we studied cells from both Ins2GFP/wt (Fig. 5) and Ins2GFP/GFP islets (Fig. S1,S2,S3). Cluster analysis of genes ordered by gfp gradient in old heterozygous Ins2GFP/wt β-cells revealed that Neurod1 expression most closely match gfp mRNA (Fig. 5C). Other genes that increased with gfp expression included genes required for optimal insulin secretion such as chromogranin A (Chga), the Glut2 glucose transporter (Slc2a2), the insulin granule zinc-transporter (Slc30a8), and key β-cell transcription factors and maturity markers Ucn3 and Pdx1 (Szabat et al., 2012). Interestingly, many of the mRNAs that were increased are known to be Pdx1 target genes in islets (Sachdeva et al., 2009). Gfp-high cells over-expressed the lncRNA Meg3. Other notable genes that were upregulated in Gfp-high cells were G-protein subunit gamma 12 (Gng12), protein phosphatase 1 regulatory inhibitor subunit 1A (Ppp1r1a), and metabolism-regulating genes, such as glucose-6-phosphatase catalytic subunit 2 (G6pc2), hydroxyacyl-CoA dehydrogenase (Hadh), cytochrome C oxidase subunit 6A2 (Cox6a2), and a cluster of other mitochondrial genes (Fig. 5C). Also in agreement with the analysis of young islets, gfp-high β-cells from old homozygous mice had decreased expression of Pappa2, Etv1, and Chgb (Fig. 5C), as well as other markers of β-cell immaturity (Gcg, Ppy, Pyy). We observed a reduction the glycolytic enzyme phosphoglycerate mutase 1 (Pgam1). Older gfp-high β-cells also had reduced expression the apoptosis regulators Fam162a and Bnip3, the anti-oxidant metallothionein proteins Mt1 and Mt2, glutathione S-transferase omega 1 (Gsto), as well as the stress adaptation gene nuclear protein 1 transcriptional regulator Nupr1. The stress-induced ER chaperone, heat shock protein family A, member 5 (Hspa5; a.k.a. BIP), showed peak expression in moderately gfp expressing cells (Fig. 5C), consistent with its known relationship with insulin production in human β-cells (Xin et al., 2018). Heat shock protein 90kDa beta 1 (Hsp90b1, a.k.a. Grp94), also an ER-resident protein, had a similar expression pattern to Hspa5.

(A) t-SNE plot of all cells positive for Ins1 mRNA (β-cells) isolated and dispersed from Ins2GFP/wt or Ins2GFP/GFP mice FACS purified into either GFP-negative (-) or GFP-positive (+) groups. (B) Ins1, Ins2, and gfp mRNA quantification distributions from GFP-negative or GFP-positive single β-cells. (C) Gene Ontology categories that are driven by genes differentially expressed in Ins2(GFP)LOW versus Ins2(GFP)HIGH β-cells. (D) Individual genes that are differentially expressed as a function of gfp mRNA expression.
Separately, we analyzed genes ordered by gfp mRNA gradient in old homozygous Ins2GFP/GFP β-cells (Fig. S2). Many of the same genes that we saw in the heterozygous samples were also increased in the GFP homozygous samples, including Chga, Ucn3, Slc2a2, Gng12, and Ppp1r1a.
This analysis further revealed the key β-cell maturity transcription factor Nkx6.1, creatine kinase B (Ckb), and Ins2 as positively correlated with gfp mRNA, that later representing reads mapped to the residual wildtype sequencing remaining after the GFP knock-in (Fig. 1B).
Genes that were anti-correlated with gfp mRNA old homozygous Ins2GFP/GFP β-cells including 18 genes found in the heterozygous samples (Fig. S2), as well as additional de-differentiation markers (Sst, Ldha) and the cell cycle regulator, cyclin D1 (Ccnd1). Other genes that were reduced in β-cells with high gfp expression were glyceraldehyde-3-phosphate dehydrogenase (Gapdh), endoplasmic reticulum oxidoreductase 1 alpha (Ero1l), regulator of G-protein signaling 4 (Rgs4), and heme oxygenase 1 (Hmox1). When we combined data from Ins2GFP/wt and Ins2GFP/GFP cells, gene ontology analysis in the older mouse β-cells showed that the Ins2(GFP)HIGH cells had significant alterations in genes involved in nitric oxide mediated signal transduction, insulin secretion, and pancreas development (Fig. 5C). By this analysis, gfp expression with many of the same genes found by analysing Ins2GFP/wt and Ins2GFP/GFP cells separately (Fig. S3).
The single-cell RNA sequencing studies identified enrichment in genes that control β-cell stress responses and markers of β-cell maturity. We have previously shown that insulin production itself is a significant stress under basal conditions in β-cells (Szabat et al., 2016) and we therefore predicted that cells with increased Ins2 gene activity and GFP production would be more sensitive to stress. Indeed, Ins2(GFP)HIGH cells were >10 fold more sensitive to apoptosis at all glucose concentrations we tested when compared with Ins2(GFP)LOW cells in the same cultures (Fig. 6A). Thus, the states marked by high gene activity at the endogenous Ins2 locus are likely to possess critical functional differences.

(A) GFP-positive cells show increased apoptosis susceptibility at all tested glucose concentrations and in the presence of thapsigargin (>1000 cells/condition, repeated from 2 mice). (B) Working model of a hypothetical β-cell bursting cycle.
Discussion
The goal of the present study was to determine the nature of Ins2 gene expression heterogeneity. Analysis of pancreatic tissue sections from Ins2GFP knock-in mice showed that, at any given time, only about half of all β-cells were robustly GFP-positive, suggesting that not all β-cells have active transcription at the Ins2 locus in vivo. Over the course of multi-day in vitro imaging experiments, we observed clear transitions between Ins2(GFP)HIGH and Ins2(GFP)LOW states in single β-cells. However, Ins2 gene activity was stable for the duration of these studies in the majority of cells, indicating the typical period of insulin gene activity ‘bursting’ is greater than 36 hours. We used single-cell RNA sequencing to characterize the Ins2(GFP)HIGH cellular state and found that Ins2(GFP)HIGH were significantly more sensitive under all stress conditions examined. Together with previous live-cell imaging data, the results of the present study demonstrate that a substantial component of β-cell heterogeneity is dynamic in time (Fig. 6B).
The dynamics of GFP fluorescence revealed by live-cell imaging of dispersed islet cells from Ins1-mCherry:Ins2GFP/wt mice provided an unprecedented look at insulin gene activity in populations of single β-cells. Many of the Ins2(GFP)LOW and Ins2(GFP)HIGH β-cell states were maintained over at least 24 hours. We have no evidence that the state transitions were linked to the β-cell circadian clock. Our observation of relatively rapid transitions between Ins2(GFP)LOW and Ins2(GFP)HIGH β-cell states suggests bursts of transcription at the Ins2 gene locus rather than stable heterogeneity. However, our measurements of GFP fluorescence originating from Ins2-locus mediated transcription cannot distinguish the relative contribution in changes in GFP mRNA transcription/stability or GFP protein translation/degradation. The half-life of unmodified GFP is ∼26 hours (Corish and Tyler-Smith, 1999) and the rapid changes in GFP fluorescence in some cells suggest coordinated bursts of protein synthesis and coupled protein degradation.
The study of pancreatic islet cell heterogeneity is currently experiencing resurgence, in part due to the application of single-cell sequencing and optogenetic technologies to islet biology questions. There are many examples of β-cell heterogeneity and these were reviewed recently (Benninger and Hodson, 2018). Insulin gene expression is a cardinal feature of pancreatic β-cells, but cell-by-cell variability in insulin production has remained under-appreciated despite published evidence (Kiekens et al., 1992). For example, there are reports of significant β-cell heterogeneity in transgenic mice expressing GFP under the Ins2 promoter (Katsuta et al., 2012). Similarly, we have shown variation in fluorescent protein expression under the control of Ins1 promoters in vivo and in vitro (Szabat et al., 2010; Szabat et al., 2009; Szabat et al., 2011). However, a limitation in these studies is that artificial promoter constructs may not recapitulate the more complex and long-range regulation available at the endogenous gene locus. Notwithstanding, cell-by-cell analysis of insulin mRNA, either by single-molecule fluorescent in situ hybridization or single-cell RNA sequencing, also showed a 2- to 10-fold range in native gene expression from endogenous insulin gene loci (Farack et al., 2019; Xin et al., 2018). The Ins2(GFP)HIGH β-cells we identified in our study are likely to be the temporal manifestation of the extreme β-cells reported by Farack et al. Supporting this, and consistent with our single-cell RNA sequencing data, their extreme β-cells had significantly elevated Chga mRNA expression (Farack et al., 2019). It is also notable that both extreme β-cells and our Ins2(GFP)HIGH β-cells had relatively normal total insulin staining, a clue that further supports the transient nature of bursts in endogenous Ins2 gene activity. It is possible that the dynamic nature of insulin transcription is an adaptation to the extremely high demands of producing and maintaining adequate stores of insulin in β-cells. Assuming there are homeostatic mechanisms to maintain stable insulin protein stores, it is unclear how the need for a burst of insulin gene activity would be sensed by individual β-cells. Future studies should attempt to define these mechanisms.
The relationship between β-cell state and disease pathogenesis remains unclear. Isolated islets and single human β-cells from people with type 2 diabetes have reduced INS expression on average (Segerstolpe et al., 2016; Yang et al., 2011). Extreme β-cell were significantly more common in diabetic db/db mice (Farack et al., 2019). We found that the Ins2(GFP)HIGH state was associated with significant vulnerability to cellular stress, so having an excess number of Ins2(GFP)HIGH β-cells at a given time may negatively affect islet health and robustness. These results are consistent with our previous data defining the interrelationships between maximal insulin production, ER stress and β-cell proliferation (Szabat et al., 2016). It is also likely that stress may modulate the frequency of these β-cell state transitions, although we did not test this directly. The presence of proportion of β-cells in the Ins2(GFP)LOW state may also be essential for islet function. Specifically, so called ‘hub β-cells’ that help synchronize islets were reported to have lower insulin content compared with typical β-cells (Johnston et al., 2016), and we have speculated that this represents a trade-off needed for their synchronizing function (Kolic and Johnson, 2016). Rodent and human β-cells are long-lived (Perl et al., 2010; Teta et al., 2005), and perhaps β-cells cycle through multiple states during their existence, including taking turns supporting the oscillatory coupling of the islet. Given that robust β-cell heterogeneity and state transitions have not been reported for stem-cell derived β-like cells (Veres et al., 2019), it is likely that in vitro differentiation protocols will need to be further optimized to produce a full range of dynamic β-cell characteristics. Interestingly, many of the genes that are differentially expressed in Ins2(GFP)HIGH β-cells are known to play roles in type 2 diabetes susceptibility, including common alleles of the MODY/neonatal diabetes genes Pdx1, Neurod1, Nkx6.1, Abcc8, Slc2a2, as well as Slc30a8 and Pam genome-wide association previously identified by genome-wide association (Thomsen et al., 2018). It will also be interesting to examine the frequency of β-cell states in the context of type 1 diabetes, given that pro-insulin, Slc30a8 and Chga are auto-antigens (Nakayama et al., 2005; Stadinski et al., 2010; Wenzlau et al., 2007). Indeed, β-cells undergoing proliferation or with lower insulin/maturity are protected in the NOD mouse model of type 1 diabetes (Dirice et al., 2019; Rui et al., 2017). Collectively, these observations suggest that modulation of β-cell state could be a therapeutic and/or prevention target for both type 1 diabetes and type 2 diabetes.
Temporal transcriptional plasticity and gene expression bursting on a similar time scale as to what we have observed have been documented in bacteria, yeast and other mammalian cell types (Raj et al., 2006; Suter et al., 2011; Vera et al., 2016). For example, bursting gene expression patterns have been observed in pituitary cells (Harper et al., 2010; Norris et al., 2003; Walsh and Shupnik, 2009). Interestingly, LHβ transcription in pituitary gonadotrophs is directly linked to proteasome activity (Walsh and Shupnik, 2009), suggesting a possible mechanism for coupling protein loads and transcription in secretory cell types. Many cell-extrinsic and cell-intrinsic factors have been implicated in the modulation of transcriptional burst frequency, including histone modifications and chromatin topology(Atger et al., 2015; Molina et al., 2013; Nicolas et al., 2017; Nicolas et al., 2018; Phillips et al., 2019). Future studies will be required to determine the molecular mechanisms mediating transcriptional bursting at the insulin gene locus in β-cells. Future studies should also seek to directly measure Ins2 mRNA transcription, perhaps using new CRISPR-based probes (Pichon et al., 2018).
In conclusion, our data demonstrate that single β-cells can switch between states marked by high and low activity of the phylogenetically conserved, endogenous insulin gene locus. This newly discovered phenomenon may account for much of the observed β-cell heterogeneity measured at single time points and needs to be comprehensively studied and leveraged in efforts to protect and generate β-cells (Johnson, 2016).
Methods
Animals and in vivo physiology
Ins2GFP/wt knock-in mice were obtained from Shouhong Xuan (Wakae-Takada et al., 2013). These mice were crossed with transgenic mice where the Ins1 promoter drives a mCherry:H2B fluorescent fusion protein (Benner et al., 2014). Glucose tolerance and insulin secretion were assessed in both male and female mice (12-14 weeks) injected intraperitoneally with 2g/kg (20%) glucose after a 5 hr fast. Insulin from in vivo samples was measured using ELISA kits from Alpco (Salem, NH, USA). Insulin tolerance was assessed after injection of 0.75 U insulin per kg body weight after a 5 hr fast.
Immunostaining
Pancreata from PBS perfused mice were harvested and fixed in 4% paraformaldehyde for 24 hr before being washed and stored in 70% ethanol, prior to paraffin embedding. Pancreatic sections (5 µm) were taken from at least three different regions of the pancreas 100 µm apart. Sections were deparaffinized, hydrated with decreasing concentrations of ethanol, and rinsed with PBS. Sections were subjected to 15 min of heat-induced epitope retrieval at 95°C using a 10 mM citrate buffer, pH 6.0. Sections were blocked then incubated with primary antibodies overnight in a humid chamber at 4°C. A list of primary antibodies can be found in Antibodies section. Primary antibodies were visualized following incubation with secondary antibodies conjugated to AlexaFluor 488, 555, 594, or 647 as required (1:1,000; Invitrogen). Counter staining was done by Vectasheild mounting media with DAPI (H-1200). Images for β cell and α cell area were taken on ImageXpressMICRO using a 10× (NA 0.3) objective and analyzed using the MetaXpress software (Molecular Devices Corporation, San Jose, CA, USA). All other images were taken on a Zeiss 200M microscope using 20× air (NA 0.75), 40× oil (NA 1.3), and/or 100× oil (NA 1.45) objectives and analyzed using Slidebook software (Intelligent Imaging Innovations, Denver, CO, USA). For quantification of immunofluorescence we used the segment masking function of Slidebook, generating a GFP high mask and a GFP low mask (by subtracting the GFP high mask from the insulin mask). A list of primary antibodies can be found in Table S1.
Islet isolation and culture
Pancreatic islets were isolated using collagenase, filtration, and hand-picking as described (Szabat et al., 2010). Islets were cultured overnight (37°C, 5% CO2) in RPMI1640 medium (Invitrogen) with 11 mM glucose (Sigma), 100 units/ml penicillin, 100 µg/ml streptomycin (Invitrogen), and 10% vol/vol FBS (Invitrogen). Real-time RT-PCR was conducted as described previously (Szabat et al., 2016). A list of primers used can be found in Table S2.
Fluorescence-activated cell sorting
Pancreatic islets were dispersed using 0.005% trypsin and resuspended in 1xPBS with 0.005% FBS. Dispersed islets were then filtered into 5 ml polypropylene tubes. Fluorescence-activated cell sorting was conducted on a Cytopeia Influx sorter (Becton Dickinson, Franklin Lakes, NJ, USA) at the Life Sciences Institute core facility. Cells were excited with a 488□nm laser (530/40 emission) and a 561□nm laser (610/20□emission).
Live-cell imaging
To define the incidence and kinetics of the transitions in Ins2 gene activity, we will culture dispersed islet cells on 96-well well glass bottom plates, and image them every 30 minutes for up to 48 hours through a 40x air objective using a ImageXpressMICRO environmentally-controlled, robotic imaging system (Molecular Devices)(Yang and Johnson, 2013). Movies were analyzed using Cell Profiler software and custom R scripts.
Live cell imaging of cell death
Our methods for live cell imaging of islet cell survival have been previously published (Yang and Johnson, 2013). Briefly, pancreatic islet cells were dissociated, and cultured in RPMI 1640 media with 10% FBS (Gibco, Fisher Scientific, Gaithersburg, MD, USA), and penicillin/streptomycin on 96 well glass bottom plates for 48 hours. Dispersed islet cells were then exposed to different dose of glucose, as well as thapsigargin (Sigma, St. Louis, MO, USA). Islet cell death was measured by propidium iodide incorporation. Images were taken every 30 min for up to 48 hours, as described earlier. Propidium iodide incorporation was traced throughout the time period, and area under the curve was measured.
Single cell transcriptomics
Single Cell Suspension was loaded on the 10x genomics single cell controller for capture in droplet emulsion. The 60-week old mouse islet cell libraries were prepared using the Chromium Single Cell 3’ Reagent v2 Chemistry kit (10x Genomics, Pleasanton, CA, USA) and the standard protocol was followed for all steps. The 8-week old mouse islet cell libraries were prepared using the Chromium Single Cell 3’ Reagent v3 Chemistry kit (10x Genomics). Libraries were then sequenced on a Nextseq500 (Illumina). Cell Ranger 2.0 and 3.0 (10x Genomics) were used to perform demultiplexing, alignment, counting, clustering, and differential expression analysis for each cluster for 60-week-old mouse data and 8-week-old mouse data respectively. The analysis results were visualized using 10x Genomics Loupe Cell Browser. Seurat R package (version 2.3.4) was used to process count matrices, generate violin plots and heatmaps (Butler et al., 2018). The cells were labeled as +/− for each marker gene using k-means clustering (k=2). Differential expression analysis between different subsets of cells was performed using the Wilcoxon rank sum test option in Seurat. Differential expression analysis over GFP gradient was performed using monocle R package (version 2.6.4)(Qiu et al., 2017). Gene ontology analysis was performed using DAVID (https://david.ncifcrf.gov/content.jsp?file=citation.htm).
Statistical analysis
Data are shown as mean plus/minus standard error of the mean unless otherwise indicated. Differences between 2 groups were evaluated with Student’s t-test and between more than 2 groups using ANOVA, calculated with Prizm software (Graphpad Software, San Diego, CA, USA).
Acknowledgments
We thank many colleagues for helpful discussions.
Footnotes
Blurb: Previously reported pancreatic β-cell heterogeneity reflects β-cell state transitions.
Declaration of Interests: The authors declare no competing interests.
Funding: Research was supported by a CIHR operating grant to J.D.J.


