

Abstract
Spatiotemporal gene expression patterns are governed to a large extent by enhancer elements, typically located distally from their target genes. Identification of enhancer-promoter (EP) links that are specific and functional in individual cell types is a key challenge in understanding gene regulation. We introduce CT-FOCS, a new statistical inference method that utilizes multiple replicates per cell type to infer cell type-specific EP links. Computationally predicted EP links are usually benchmarked against experimentally determined chromatin interaction measured by ChIA-PET. We expand this validation scheme by introducing the concept of connected loop set, which combines loops that overlap in their anchor sites. Analzying 1,366 samples from ENCODE, Roadmap epigenomics and FANTOM5, CT-FOCS inferred highly cell type-specific EP links more accurately than a state-of-the-art method. We illustrate how our inferred EP links drive cell type-specific gene expression and regulation.
Background
Understanding the effect of the noncoding part of the genome on gene expression in specific cell types is a central challenge [1]. Cell identity is, to a large extent, determined by cell-type specific transcriptional programs driven by lineage-determining transcription factors (TFs). Such TFs mostly bind to enhancer elements located distally from their target promoters [2]. To find cell type-specific enhancer-promoter links (ct-links) one needs to compare EP links across multiple and diverse cell types. Deciphering ct-links using 3D chromatin conformation sequencing data (e.g., ChIA-PET [3] and HiC [4,5]) is still not available for many distinct cell types and tissues [4–9]. Consequently, there is high demand for computational methods that would predict ct-links based on other broadly available data. Such resources include large-scale epigenomic data available for a variety of human cell types and tissues, which enabe concurrent quantification of enhancer and promoter elements.
A key challenge is to identify which of the numerous candidate EP links are actually (1) functional (or active) and (2) specific to a cell type of interest. We define an EP link to be specific to a certain cell type if it is active in the cell type and its activity is limited to a small fraction of cell types. Ernst et al. [10] predicted ct-links based on correlated cell type-specific enhancer and promoter activity patterns from nine chromatin marks across nine cell types. Similarly, the Ripple method [11] predicted ct-links in five cell types. The cell type specificity of the inferred EP links was measured by their occurrence in other cell types. Additional methods that predicted EP links for a low number of cell types are IM-PET [12] and TargetFinder [13]. All these methods rely on data of multiple chromatin marks and expression data for the studied cell types.
The JEME algorithm finds global and cell type-active EP links (but not necessarily cell type-specific) using only 1-5 different omics data types [14]. Each reported EP link is given a score denoting tendency to be active in a given cell type. JEME reports an average of 4,095 active EP links per cell type, and most of these may be nonspecific.
Several recent studies aimed at finding ct-links experimentally. Rajarajan et al. [15] used in-situ HiC and schizophrenia risk locus to identify 1,702 and 442 neuronal progenitor cell (NPC) specific and neuron specific 3D chromatin interactions for 386 and 385 genes, respectively. Some of the NPC and neuron-specific interactions may be enhancer-promoter interactions (or ct-links). Gasperini et al. [16] used CRISPR screening to perturb 5,920 human candidate enhancers that may affect gene expression at the single-cell level in combination with eQTL analysis, and identified 664 EP links covering 479 genes enriched with K562-specific genes and lineage-specific transcription factors (TFs; reviewed in [17]). Remarkably, both studies reported far fewer links than JEME, indicating that only a small portion of EP links that are active in a cell type are specific for it.
Here, we introduce CT-FOCS (Cell Type FDR-corrected OLS with Cross-validation and Shrinkage), a novel method for inferring ct-links from large-scale compendia of hundreds of cell types measured by a single omic technique (e.g., DNase Hypersensitive Sites sequencing; DHS-seq). It is built upon our previously published method, FOCS [18], which infers global EP links that show high correlation between the enhancer and the promoter activity patterns across many samples. Given the omic profile for a set of cell types, each one with replicates, CT-FOCS uses linear mixed effect models (LMMs) to infer ct-links. CT-FOCS was applied on public DNase Hypersensitive Sites (DHS) profiles from ENCODE and Roadmap Epigenomics [19–21], and cap analysis of gene expression (CAGE) profiles from FANTOM5 [22]. Overall, CT-FOCS inferred ~230k ct-links for 651 cell types. We demonstrate that the inferred ct-links drive cell type-specific regulation and gene expression. The ct-links inferred using CT-FOCS are available at http://acgt.cs.tau.ac.il/ct-focs.
Results
The CT-FOCS procedure for predicting cell type-specific EP links
We developed a novel method called CT-FOCS (Cell Type FOCS) for inferring cell type-specific EP links (ct-links). The method utilizes single omic data from large-scale datasets. We applied CT-FOCS on three public datasets: (1) ENCODE and Rodamap epigenomics DHS profiles [19–21], which contain 208 and 350 samples covering 106 and 73 distinct cell lines, respectively; and (2) FANTOM5’s CAGE profiles [22], which contain 808 samples covering 472 cell lines, primary cells, and tissues (Methods).
CT-FOCS is based on FOCS [18], which discovers global EP links showing correlated enhancer and promoter activity patterns across many samples. FOCS uses linear regression followed by two non-parametric statistical tests for producing initial promoter models, and applies a model shrinkage regularization to retrieve the most informative enhancers per promoter model (out of the k enhancers that are closest to the target promoter; we used k=10). To find ct-links based on the global links identified by FOCS, CT-FOCS starts with the full (that is, non-regularized) promoter models. It uses a mixed effect regression-based method, which utilizes groups of replicates available for each cell type to adjust a specific regression curve per cell type-group in one promoter model (Fig. 1; Methods). The input to CT-FOCS is enhancer and promoter activity matrices over the same samples and a unique cell type labeling for each sample. The output is a set of ct-links for each cell type (Methods).

Let yp denote the observed promoter p activity, X be the activity matrix of the 10-closest enhancers to the promoter p, and Z a design matrix classifying each sample to its unique cell type (Methods). First, CT-FOCS infers robust global promoter models by applying the leave-cell-type-out cross validation step from FOCS on each promoter model p (see FOCS [18] for further description). Second, CT-FOCS builds a linear mixed effects model (LMM) on all samples using yp, X, and Z. Then, CT-FOCS performs two tests: (1) log-likelihood ratio test (LRT) to compare between the Null model, which is the simple linear regression without Zγ, and the LMM model. For each promoter model, such tests are carried out eleven (k+1) times (testing the k enhancers and the intercept), such that in each test Z is a design matrix of either the intercept or one of the ten enhancer coefficients (Methods). Then, p-values for these LRT tests are adjusted for multiple testing (q-values). (2) Each LMM predicts a γ vector of size C (number of cell types) for either the intercept or one of the enhancers. CT-FOCS standardizes γ values using the Median Absolute Deviation (MAD) technique and finds positive outliers (red dots) (Methods). Finally, CT-FOCS calls cell type-specific EP links (ct-links) defined as: (1) both enhancer and promoter (i.e., the intercept) have q-Value <0.1 (marked in red), and (2) the enhancer and the promoter are found as positive outliers in the same cell type. In the FCRLA gene given as an example, the promoter and enhancers e1, e10 are significant and found as positive outliers in B-cells. Therefore, E1P and E10P are called by CT-FOCS as B-cell-specific EP links.
Overall, CT-FOCS identified 17,672, 16,614 and 195,232 ct-links in ENCODE, Roadmap, and FANTOM5 datasets, respectively (Table 1). These included an average (median) of 167 (94), 234 (73) and 414 (594) ct-links per cell type in (Table 1; Supplementary Fig. 1A-C). These numbers are in line with the low number of reported ct-links experimentally observed for NPC, neurons, and K562 cells [15,16], and indicates that cell-type specific EP links constitute only a small portion of the EP links that are active in any particular cell type. CT-FOCS predicted EP links are on average shared across 3, 1.65, and 2.5 cell types in ENCODE, Roadmap, and FANTOM5 datasets (Supplementary Fig. 2). CT-FOCS predicted both proximal and distal interactions with an average distance between the enhancer and promoter center positions of ~20kb, ~28kb, and ~160kb (median ~17kb, ~21kb, and ~110kb) in ENCODE, Roadmap Epigenomics, and FANTOM5 datasets, respectively (Supplementary Fig. 3A-C). Subsequent analyses are performed on ENCODE and FANTOM5 datasets. The complete set of predicted ct-links for each cell type is available at http://acgt.cs.tau.ac.il/ct-focs.
Average number of predictions per cell type
ChIA-PET connected loops as validation for inferred EP links
A gold standard for validating inferred ct-links is 3D chromatin contact loops mediated by RNAP2. The straightforward validation of an inferred ct-link is to check whether the E and P regions overlap different anchors of a certain ChIA-PET loop. However, as loops indicate 3D proximity of their anchors, overlapping anchors of different loops indicate proximity of their other anchors as well. Thus, we expand the procedure of validating computationally inferred EP links by introducing the concept of connected loop sets (CLS). We consider two ChIA-PET loops as connected if they have at least one overlapping anchor. More generally, a CLS is defined as the set of anchors of all loops that have a chain of connected loops between them (Supplementary Fig. S4A). Hence, if the enhancer and promoter regions of an EP link overlap different anchors from the same ChIA-PET CLS then we can view this as support of the predicted link as well (Methods) [23]. In addition, EP links that span a linear distance of < 20kb, where ChIA-PET loops may perform poorly [24], may not be supported by a single ChIA-PET loop, but a CLS may support such short EP links.
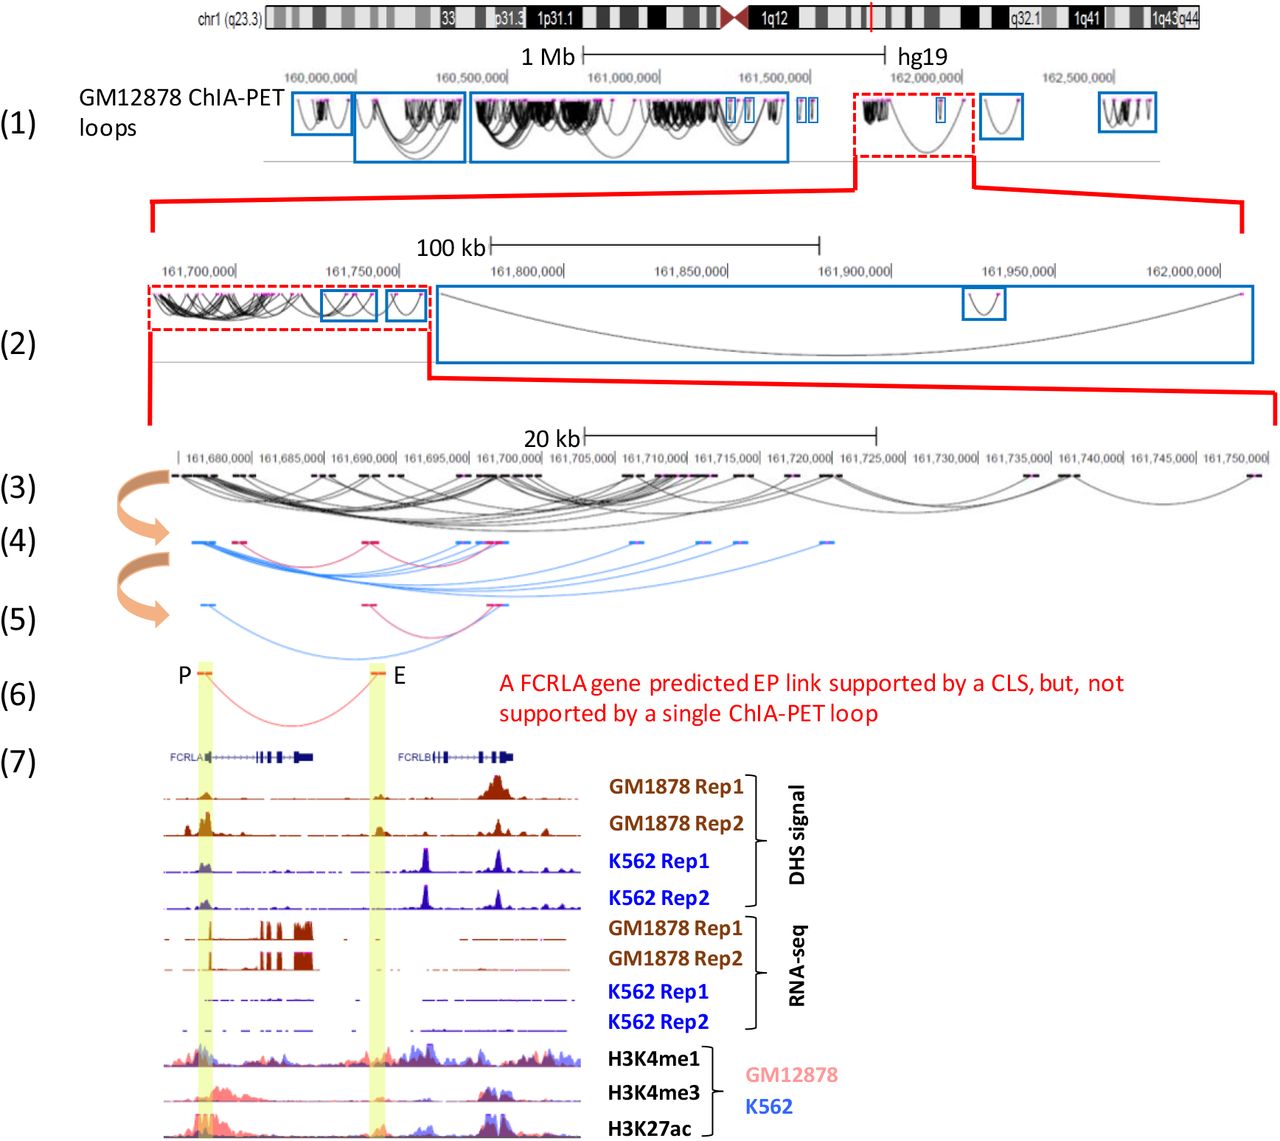
Using ChIA-PET RNAP2-mediated loops measured in GM12878 cell line [9] (see Supplementary Fig. 5 for the summaries of the CLSs found), while ~30% of CT-FOCS inferred GM12878-specific EP links were validated by GM12878 ChIA-PET single loops, 72% were supported by CLSs (Fig. 2; see Supplementary Fig. 6-7 for additional examples). To test the significance of the presicion obtained (72%, 202/280 GM12878-specific EP links) we selected random sets of 280 EP links with the same linear distances between E and P as the true EP links (Methods). Each random link was taken from the same chromosome as the true link in order to account for chromosome-specific epigenetic state [25]. In 1,000 random sets, CLSs supported on average 24% (68 out of 280) and at most 31% (87 out of 280) (P<0.001; Supplementary Fig. 4B).

(1) A 2Mb region of chromosome 1 showing all ChIA-PET loops detected for cell type GM12878. Rectangles indicate connected loop sets (CLSs). (2) Zoom-in on 300kb region. Note the nested CLSs on the right. (3) Another zoom-in on a 70kb region, showing a single ChIA-PET CLS. (4) The same region showing only loops that have anchors overlapping the enhancer or promoter of the examined ct-link shown in (6). Pink loops: loops overlapping the enhancer; blue loops: loops overlapping the promoter. (5) Two connected loops in a CLS that collectively support the predicted ct-link shown in (6). Therefore, this CT-FOCS inferred ct-link in (6) is validated by a CLS, but not by individual ChIA-PET loops. (6) A predicted ct-link of FCRLA gene. (7) Gene expression (RNA-seq), epigenetics (DHS-seq) and gene annotations for the predicted ct-link region. Tracks are shown using UCSC genome browser for data from GM12878 and K562 cell lines.
CT-FOCS inferred ct-links correlate with cell type-specific gene expression
CT-FOCS aims to pinpoint EP links that are highly cell type-specific. To evaluate the specificity of the predictions we used a cell type specificity formula, which compares activity of ct-links inferred for a particular cell type with their activity in all other cell types [26] (Methods). On ENCODE data, CT-FOCS predicted 280 GM12878-specific EP links (with 72% support by ChIA-PET connected loops). The lymphocyte group of cell types (GM12878, other B-cells, and T-cells) exhibited the highest EP signals, while GM12878 ranked first by EP signal specificity (Fig. 3A-B).

(A) Heatmaps of EP signals for 280 ct-links predicted on GM12878 based on ENCODE data spanning 106 cell types. Rows – EP links, columns – cell types, color – z-score of interaction signal. ct-links supported by CLSs are marked in yellow. Cell types related to lymphocytes (B/T-cells) are highlighted in color. (B) Cell type specificity score ranks based on the signal of GM12878-specific EP links for all 106 cell types. (C) Heatmap of gene expression (GE) for 124 genes involved in ct-links predicted on GM12878. The ENCODE GE data covers 112 cell types [27]. Rows – genes, columns – cell types, color – z-score of GE. (D) Cell type specificity score ranks based on GE of the 124 genes annotated with a GM12878 ct-link for the 112 cell types included in the GE dataset (Methods).
Next, we also examined the cell type specificity in gene expression of the genes annotated with CT-FOCS inferred ct-links (Methods). For this task, we analyzed gene expression (GE) data for 112 cell types [27] and as a test case focused on the expression of the set of 124 genes whose promoter was included in the 280 GM12878-specific ct-links. Here too, the lymphocyte group showed the highest GE levels compared to other cell type (Fig. 3C), and GM12878 ranked fourth by GE specificity (Fig. 3D). These results indicate that the GM12878-specific EP links predicted by CT-FOCS based on DHS data are correlated with GM12878-specific GE programs.
Comparison of CT-FOCS and JEME
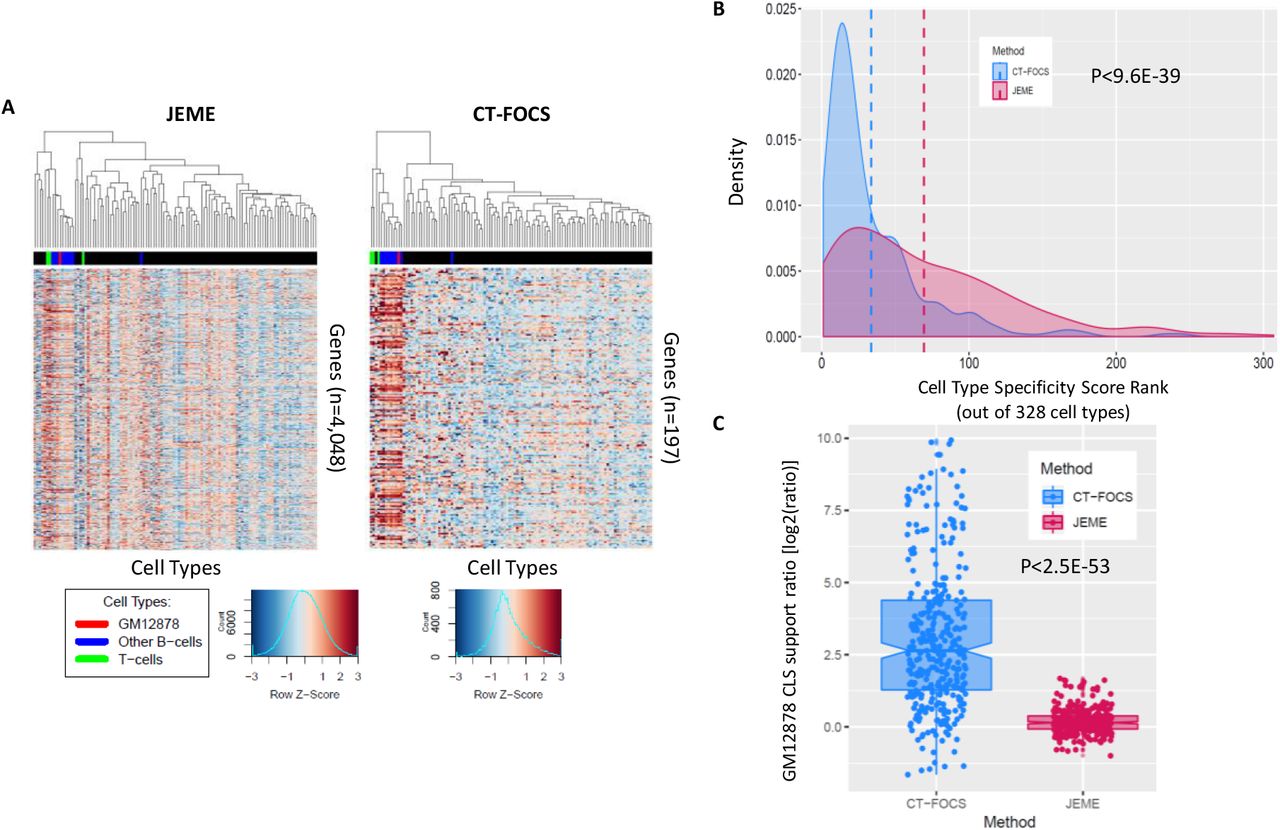
We compared CT-FOCS predictions with those of JEME [14], which infers EP links that are active in a particular cell type but are not neccesarily cell type-specific (see Supplementary Fig. 1D, 2D, and 3D for JEME inferred EP links, how many of them are shared across cell types, and their distances per cell type). Predictions were made on the FANTOM5 dataset, and subjected to specificity analysis. We used FANTOM5 data for this comparios as JEME prediction based on ENCODE/Roadmap data were based on multiple omic data types measured by this project, while FANTOM5 is a single omic dataset. For cell type GM12878, CT-FOCS identified 210 genes (340 ct-links, 252 enhancers and 228 promoters). These genes showed high GE in the lymphocyte group compared to other cell types (Fig. 4A). JEME reported 9,065 GM12878-active EP links covering 4,268 genes (5,216 promoters and 2,338 enhancers), with a GE profile that is only weakly specific to the lymphocyte group (Fig. 4A). In terms of cell type specificity of their GE profiles, CT-FOCS ranked GM12878 2nd (out of 328 cell types having at least 50 CT-FOCS predicted ct-links, with GM18507 ranked first), while JEME ranked GM12878 17th (Fig. 4B).

Active EP links were predcited by JEME and ct-links were predicted by CT-FOCS on 472 cell types from FANTOM5. (A) Heatmaps of gene expression (GE) from ENCODE microarray data covering 112 cell types [27]. For each method, the analysis includes the genes whose promoters were contained in the set of EP-links predicted for GM12878. Cell types (columns) related to lymphocytes (B/T-cells) are highlighted. (B) Distribution of specificity ranks of EP signal across 328 cell types. The plots show the density of cell type specificity score ranks based on EP signals of the EP links predicted by CT-FOCS (blue) and JEME (red). Dashed lines denote the average rank. The scores were calculated on 328 cell types that had at least 50 predicted EP links in both CT-FOCS and JEME. (C) The ratio between the fraction of predicted EP links on GM12878 that had a CLS support to the fraction in 327 other cell types (Methods). P-values computed using one-sided Wilcoxon paired test.
We also calculated GE specificity for cell types HepG2, K562, and MCF-7 based on the links identified by both algorithms. In CT-FOCS, all three cell types ranked first in specificity, while in JEME, HepG2, K562, and MCF-7 ranked 2, 3, and 14, respectively. In addition, we computed the distribution of EP specificity ranking of all 328 cell types analyzed. CT-FOCS cell type ranks were significantly higher than those of JEME (average 34 and median 21 for CT-FOCS, vs. average 83 and median 69 for JEME; P<9.6E-39; one sided Wilcoxon paired test; Fig. 4B).
Next, we tested to what extent the EP links inferred for GM12878 by both methods were supported by the ChIA-PET assay of that cell type compared to the links inferred on other cell types. Biologically, ct-links inferred for other cell type are expected to show lower support rate by GM12878-CLSs compared to GM12878-specific EP links. For GM12878 and each of the other examined cell types, we compared the fraction of ct-links supported by GM12878 ChIA-PET CLSs. Indeed, CT-FOCS ct-links predicted for GM12878 showed significantly higher support rate (median log2(ratio) ~2.5; Fig. 4C). Most of the cell types that had log2(ratio) <0 were related to B-cells as GM12878 (e.g., B cell line, burkitt’s lymphoma cell line). In contrast, JEME’s predicted links for GM12878 had similar support rate by GM12878 ChIA-PET CLS as the EP linked predicted for the other cell types (median log2FC ~0; P<2.5E-33; one sided Wilcoxon paired test; Fig. 4C). These results indicate again that a large portion of EP links are active across many different cell types, while a minority of them are highly cell type specific.
Predicted ct-links drive cell type-specific gene regulation
We asked whether the enhancers and promoters in the inferred ct-links demonstrate signals of cell type-specfic gene regulation, as shown previously for lineage-determining TFs [17] and in K562 [16]. To this end, we searched for occurrences of 402 known TF motifs (position weight matrices; PWMs) within the enhancers and promoters of inferred EP links. To lessen false discoveries, we restricted our search to digital genomic footprints (DGFs; Methods), which are short genomic regions (~20 bp on average) identified by DHS, which tend to be stably bound by TFs [28]. We used publicly available ~8.4M DGFs covering 41 diverse cell and tissue types derived from ENCODE DHS data [29]. For each TF PWM and cell type, we calculated the TF overrepresentation factor in the target set (enhancers or promoters of the inferred ct-links) compared to a matched control set harboring a similar nucleotide distribution (Methods).
We applied this test on the ct-links predicted on GM12878 using the ENCODE dataset. 13 TFs were identified in promoters and ehnahcers. The identified TFs show as a regulatory group higher overrepresentation factor in both enhancers and promoters compared to the other cell types (Fig. 5A-B). In terms of the specificity score of the TF overrepresentation factors, GM12878 is ranked first in both enhancers and promoters (Fig. 5C-D). Unlike the EP signal and GE specificity-based results (Fig. 3C-D), here other cell types from the lymphocyte group were not highly ranked, suggesting that the discovered TFs are strictly GM12878-specific regulation group.

(A-B) Heatmaps TF PWM overrepresentation in promoters (A) and enhancers (B) of GM12878-specific EP links from CT-FOCS. TFs shown had P-value < 0.05 (Hyper Geometric test; Methods). (C-D) Cell type specificity score ranks based on GM12878-specific TF overrepresentation factors in promoters (C) and enhancers (D) compared to other cell types (Methods).
Among the TFs that were discovered in analysis of the ct-links of GM12878, a B-lympoblastoid cell line, the early B-cell factor 1 (EBF1) had the 3rd highest overrepresentation factor in promoters, and the paired box gene 5 (PAX5) ranked 7th in enhancers known to drive B-cell lineage commitment [30]. EBF1 was predicted to modify 3D organization of chromatin by cooperating with PAX5, and it was shown that discovered TFs BATF, RUNX3, IRF4, and PAX5 are enriched in GM12878 [31].
We applied the same TF analysis and specificity ranking on the ct-links inferred from ENCODE for 68 cell types (out of 106) that had at least 50 predicted EP links. The analysis identified 12 TFs on average in enhancers and 19 in promoters per cell type (Supplementary Table S1). In enhancers, 57 out of the 68 cell types ranked first by overrepresentation factor specificity, while in promoters, 58 out of 68 ranked first. Overall, the ct-links inferred on the ENCODE dataset appear to drive cell type-specific gene regulation.
We applied the above analyses on the FANTOM5 dataset for 328 cell types (out of 472) that had at least 50 predicted EP links by both CT-FOCS and JEME. The analysis identified 15 TFs on average in enhancers and 25 in promoters per cell type in CT-FOCS EP links compared to 33 and 69 in JEME (Supplementary Tables S2-3). In enhancers, 186 out of the 328 cell types ranked first by overrepresentation factor specificity, while in promoters, 190 out 328 ranked first, in CT-FOCS. JEME had 112 cell types in enhancers and 159 in promoters ranking fisrt. Our results show that CT-FOCS tend to find gene regulation that is more cell type-specific compared to JEME, possibly suggesting that many of the TFs found in JEME act in multiple cell types’ gene regulation.
Discussion
We introduced CT-FOCS, a novel method for inferring cell type-specific EP links (ct-links) based on activity patterns derived from large-scale single omic. We applied CT-FOCS on two different datasets, DHS profiles in ENCODE and Roadmap [19,21], and CAGE profiles from FANTOM5 [22], and derived a rich resource of statistically validated ct-link maps.
To support the predicted ct-links, we developed a simple novel scheme based on ChIA-PET connected loop sets (CLSs, Methods; Fig. 2 and Supplementary Fig. 6-7). We showed, using GM12878 ChIA-PET dataset [9], that ~72% of the ct-links predicted by CT-FOCS for GM12878 on the ENCODE data were supported by ChIA-PET CLSs whereas only 30% of these ct-links were supported by single loops. Single loop validation does not take into account the possible interaction of multiple promoters and enhancers affecting a gene’s expression. By using CLSs, one can support EP link where, for example, the enhancer indirectly links to the promoter via other enhancers or promoters, and has a functional effect on the indirectly linked promoter. It can also overcome the “blind spot” of ChIA-PET in discovering interactions shorter than 8kb. We believe that evaluation using CLS support may help to improve future methods for EP inference.
The specificity score suggested in [26] allowed us to assess the cell type-specificity of multiple features of the inferred ct-links: EP signal, expression of linked genes, and overrepresentation of TFs (Fig. 3A-B and Fig. 5; Methods). Also, it allowed us to present a global summary of the cell type-specificity of the inferred features across many cell types, and use it to compare with different EP inference method. Based on FANTOM5 dataset, we showed that CT-FOCS ct-link predictions were more specific than JEME’s (Fig. 4C). We further showed that the predicted ct-links drove cell type-specific GE and revealed overrepresented TFs in the link’s enhancers and promoters. Taken together, we saw high correlation between cell type-specific EP DHS signals, GEs, and TF overrepresentation factors (Fig. 3A-B and Fig. 5A-B).
Several comments are in order regarding our CT-FOCS inferred EP maps. First, a common naïve practice was to map enhancers to their nearest gene. Among the CT-FOCS predicted EP links, on average per cell type, only ~10% contained enhancers that map to the nearest gene. While this low proportion is lower than previous reports (~26% in FOCS [18] and ~40% in FANTOM5 [22]), it may result from two confounders: (1) The lower limit was set on the linear genomic distance between putative enhancer and promoter links (e.g., in ENCODE we set the distance to at least 10kb to prevent activity sharing between the promoter and its candidate enhancers; Methods). This may lead to missing shorter links. (2) The low number of FANTOM5 reported enhancers (~43k). FANTOM5 enhancers tend to be located within intergenic regions, possibly reducing the correlation of the enhancers with the nearest gene. As a result, less EP links are identified using correlation-based techniques (e.g., linear regression). In contrast, the naïve nearest gene mapping to each enhancer has been previously shown to result with a poor performance when validating with ChIA-PET and HiC 3D loops and eQTL data [14]. Second, ~60% of the predicted EP links, on average per cell type, involve intronic enhancers, similar to the report by FOCS (70%). Third, the average number of CT-links per cell type was 167 in ENCDOE, 234 in Roadmap, and 414 in FANTOM5, respectively (Table 1). While these numbers are very low, considering that ENCODE reported a total of ~3M regulatory elements [19], they are in line with the small number of cell type-specific EP links reported previously for NPC, neuron, and K562 cells [15,16]. Fourth, each promoter was linked to ~2 enhancers on average (and a maximum of 9) in each cell type.
CT-FOCS uses LMM models for modeling two effects. The first is the joint contribution of multiple enhancers to the promoter activity, which was previously shown to predict gene expression more accurately compared to pairwise enhancer-gene correlations [14]. The second effect is the contribution of the disjoint cell type groups of samples to the promoter activity. By taking into account the cell type of each sample we can ask whether should we treat the promoter activity prediction separately for each cell type group. This means that an estimated regression coefficient will not be the same for all samples but rather adjusted according to their cell type. Therefore, intuitively, using the difference in the regression coefficients between cell type groups, one can infer ct-links (Methods).
CT-FOCS is limited by considering only the ten closest enhancers to each promoter when building the LMM models. A possible future improvement is to include all enhancers within a window of say 1Mb around each promoter, e.g., by using Bayesian hierarchical models, considering possible confounders and a-priori information such as ChIA-PET loops and eQTLs.
We used CT-FOCS to construct a broad, publicly available compendium of ct-links for 651 cell types, which can be useful for multiple genomic inquiries. For example, it can improve identification of known and novel cell type-specific TFs and enhance our understading of key transcriptional cascades that determine cell fate decisions. Furthermore, the integration of protein-protein intractions (PPIs) with TF identification in predicted ct-links may help identifiy cell type-specific PPI modules [32]. These modules may contain additional new proteins (e.g., co-factors and proteins that are part of the mediator complex) that shape the 3D chromatin in a cell type-specific manner. Overall, the new method and compendium may advance our understanding of cell type-specific genome regulation.
Conclusions
CT-FOCS idenified cell type-specific enhancer-promoter links (ct-links) for 651 cell types inferred from ENCODE, Roadmap Epigenomics, and FANTOM5 data. On average, ~354 ct-links were discovered per cell type. The inferred ct-links for FANTOM5 data showed substantially higher cell type-specificity scores compared to a previous state-of-the-art method.
The inferred ct-links correlate with cell type-specific gene expression and regulation.
We provided a novel way to support predicted EP links that uses ChIA-PET connected loops insead of single loops. On GM12878 cell line, 72% of the predicted GM12878-specific EP links were supported by connected loops compared to 30% by single loops.
Methods
ENCODE DHS data preprocessing
ENCODE DHS peaks of enhancers and promoters [19] were processed as in FOCS [18] with the following changes: (1) we analyzed only promoters of annotated protein-coding genes according to GencodeV10 TSS annotations (see URLs). (2) We applied a relative-log-expression (RLE) normalization [33], as implemented in edgeR [34,35]. (3) We retained promoters and enhancers that showed robust activity in at least one cell type: signal ≥ 5 RPKM in all samples of at least one cell type. Overall, we analyzed 208 sampels from 106 cell types. Our preprocessing resulted with 36,056 promoters (mapped to 13,105, 13,464, and 13,197 protein-coding genes according to HGNC_symbols, Ensembl, and Entrez, respectively) and 658,231 putative enhancers.
Enhancers closer than 10kb to the nearest promoter were discarded since we wanted to reduce false positive links due to the high signal correlation at short distances, and to predict distal interactions as suggested by [13]. The candidate enhancers for each promoter were defined as the 10 closest enhancers located within a window of 1Mb (±500Kb upstream/downstream) from the promoter’s center position.
We first applied the FOCS pipeline, including leave-cell-type-out cross validation (LCTO CV) on the promoters and their candidate enhancers, and accepted promoter models with q-value≤0.1 in the activity level test (see [18] for details). Unlike FOCS, we did not apply here regularization on the predicted EP links. Overall, the procedure resulted with 17,832 promoter models (mapped to 9,090, 9,320, and 9,160 HGNC_symbols, Ensembl, and Entrez protein-coding genes, respectively).
Roadmap Epigenomics DHS data preprocessing
Roadmap DHS peaks of enhancers and promoters [21] were processed as described above for the ENCODE data with the following change: we retained promoters and enhancers with signal ≥1RPKM in all samples of at least one cell type. Overall, we analyzed 350 sampels from 73 cell types. Our preprocessing resulted with 12,493 promoters (mapped to 10,022, 10,358 and 10,101 protein-coding genes according to HGNC_symbols, Ensembl and Entrez, respectively) and 448,356 putative enhancers.
For each promoter, the candidate enhancers for each promoter were defined as the 10 closest enhancers located within a window of 1Mb (±500Kb upstream/downstream) from the promoter’s center position. Unlike ENCODE, we did not enforce a lower bound on the distance here since ~91% of the enhancers are located within intergenic regions, thus, reducing the probability of FP links due to the high signal correlation at short distances. We applied the same FOCS pipeline on the promoters and their candidate enhancers as described above for the ENCODE data. This resulted with 8,505 promoter models for further analysis.
FANTOM5 CAGE data preprocessing
We downloaded the FANTOM5 CAGE data from JEME [14] repository (see URLs). Overall, the data contained 24,048 promoters and and 42,656 enhancers, covering 808 samples. Enhancer and promoter expression matrices were RLE normalized. We manually annotated the 808 samples with 472 cell types (Supplementary Table S5) using Table S1 from FANTOM5 [22].
For each promoter, the candidate enhancers were defined as the 10 closest enhancers located within ±1Mb from the promoter’s TSS as performed in JEME [14]. Unlike ENCODE, we did not enforce a lower bound on the distance here. We applied the same pipeline on the promoters and their candidate enhancers as described above for the ENCODE data. This resulted with 21,468 promoter models for further analysis.
CT-FOCS model Implementation
Consider a model for promoter p and its k closest enhancers that passed the preprocessing step. The activity vector of the promoter across the n samples is denoted by the n-long vector yp, and the activity level of the enhancers across the same n samples is summarized in the matrix Xe of dimensions n · (k + 1), with the first k columns corresponding to the candidate enhancers and a column of ones for the intercept. There are C cell types and each sample is labeled with a cell type.
The application of an appropriate mixed effects model to the data depends on the distribution of the promoter and enhancer activities. We observed that FANTOM5 and Roadmap data have normal-like distribution and ENCODE data have zero-inflated negative binomial (ZINB) distribution, (Supplementary Fig. 8A-C). For Roadmap and FANTOM5, we applied the regular linear mixed effect regression using lmm R function from nlme R package [36]. For ENCODE, we applied the generalized linear mixed effect regression (GLMM) using glmmTMB R function from glmmTMB package [37]. We defined the null model as the simple linear regression yp = Xeβ + ϵ, and each of the k+1 alternative models as the LMM model yp = Xeβ + Zγ + ϵ, where Xeβ is the fixed effect, Zγ is the random effect, and ϵ is a random error. Z is a nxC design matrix that groups the samples by their cell types, namely:

Where l ∈ {1,…, k + 1} is one of the variables (enhancer or the intercept). γ is a C-long vector of random effects to be predicted. In LMM, we estimate the coefficients β1, ….,βk+1 of the fixed effect, the random effect variance Var(γ) assuming that γ~N(0,Var(γ)) under the normal-like distribution (or, ZINB in GLMM), and the residual variance  . The estimated
  and
and  are used to predict γ, which is then utilized for calling cell-type specific EP links, as described below.
For each promoter model, we defined k + 1 alternative models, each corresponding to a single random effect (i.e., random slope for enhancer or random intercept for the promoter). We applied the likelihood ratio test between the residuals of the alternative and the null models k + 1 times (one for each random effect), and got k + 1 p-values. Such p-values were calculated for each of the |P| promoters, and corrected for multiple testing using the Benjamini-Hochberg FDR [38], where the number of tests performed is |P| · (k + 1).
The predicted random effect vectors, γ1,…, γk+1, of the alternative models were normalized using the median absolute deviation (MAD), i.e., γ′i = |(γi − median(γi)|/mad(γi). Positive outliers with γ′ij > 2.5 were identified as active enhancers or promoters. We chose to use the MAD statistic since the mean and the standard deviation are known to be sensitive to outliers [39].
Finally, we defined cell type-specific EP links (abbreviated ct-links) as those that had: (1) significant random effect intercept of the promoter (P) (2) significant random effect slope of the enhancer (E), both with q-value < 0.1, and (3) E and P were identified as positive outliers in the same cell type according to the MAD criterion (that is, both E and P have normalized coefficient > 2.5).
External validation of predicted EP links using ChIA-PET loops
We used ChIA–PET interactions to evaluate the performance of CT-FOCS and of other methods for EP linking. We downloaded ChIA-PET data of GM12878 cell line (GEO accession: GSE72816) assayed with RNAP2 [9]. Each ChIA-PET loop identifies an interaction between two genomic intervals called its anchors. To focus on high confidence interactions, we filtered out loops with anchors’ width >5kb or overlapping anchors. Retained loop anchors were resized to 1kbp intervals around to the anchor’s center position. We filtered out loops crossing topologically associated domain (TAD) boundaries, as functional links are usually confined to TADs [6,40–42]. For this task, we downloaded 3,019 GM12878 TADs [43], which are largely conserved across cell types [5], and used them for filtering ChIA-PET loops from all cell types.
To overcome the sparseness of the ChIA-PET loops, and the 8kb minimum distance between loop anchors[8,9], we combined loops into connected components of loop sets (CLSs) as follows: When two loops had anchors that overlapped by at least 250 bp, we put them in the same CLS (Supplementary Fig. S4A). We used the igarph R package [44] for this analysis.
To evaluate if a ct-link is confirmed by the ChIA-PET data, we checked if both the enhancer and the promoter fell into the same CLS. Specifically, we defined 1Kbp genomic intervals (±500 bp upstream/downstream) for the promoters (relative to the center position) and the enhancers (±500 bp from the enhancer center) as their genomic positions. An EP link was considered supported by a CLS if the genomic intervals of both its promoter and enhancer overlapped different anchors from the same CLS (Supplementary Fig. S4A).
We used randomization in order to test the significance of the total number of supported EP links by ChIA-PET single loops defined as Nt. We performed the test as follows: (1) For each predicted EP link, we randomly matched a control EP link, taken from the set of all possible EP pairs, with similar linear distance between E and P center positions. We restricted the matching to the same chromosome in order to account for chromosome-specific epigenetic state [25]. The matching was done using MatchIt R package (method-nearest’, distance=‘logit’, replace-’FALSE’) [45]. This way, the final set of matched control EP links had the same set of linear interaction distances as the original EP links. (2) We counted Nr, the number of control EP links that were supported by ChIA-PET single loops. We repeated this procedure for 1,000 times. The empirical P-value was  . A similar empirical p-value was computed for the CLSs.
We used the following formula to calculate the GM12878 ChIA-PET CLS support ratio (Fig. 4C):

Cell type specificity score
We quantify the intensity of an EP link in a given sample by log2 a log2 b where a and b are the enhancer and promoter activities in that sample. The signal of the link a particular cell type is the average of the signal across the samples from that cell type. Define xi as the vector of signals in cell type i of length equal to the total number n of EP links discovered in the study, and define dc,i as the Euclidean distance between the vectors xc and xi of two cell types. Following the definition of cell-type specificity from [26], cell type specificity in cell type c of a set of EP links is:

Similarly, cell-type specificity can be computed for the expression values of the genes annotated with EP links, or on the overrepresentation factors of TFs found at enhancers and promoters.
Motif finding on ct-links
We wished to check occurrences of transcription factor (TF) binding site motifs in our ct-links. Given a short TF motif, finding all its occurrences (called hits) in a large set of promoters may require checking millions of possibilities and is prone to high false positive rate. We therefore limited the serath for PWM hits to digital genomic footprint regions (DGFs) that are more likely to represent genuine TF binding sites. We downloaded ~8.4M DGFs sequences inferred from DNase-seq data from ENCODE [29]. The mean DGF length was L ≈ 20 bp, with a maximum length of 68 bp.
We looked for hits of 402 HOCOMOCO V11 [46] TF core motifs (taken from MEME suite database [47]; see URLs) in DGFs within enhancer and promoter regions of predicted ct-links. We call the resulting set of sequences the target set. Hits were found using FIMO [48] with 0-order Markov model as background created using fasta-get-markov command line from MEME suite [47]. Hits with FIMO q-value <0.1 were considered for each TF. To evaluate the significance of the findings we repeated the search on a control set from matched regions (one per target region) having similar distribution of single nucleotides and dinucleotides. Matching was done using MatchIt R package [45]; method-’nearest’, distance-’mahalanobis’. For each TF motif we used a one sided Hyper-Geometric (HG) test to compare the prevalence of TF hits in the target set with that in the background (target+control) sets. Motifs having q-value < 0.1 were selected.
If a k-long TF motif had lt hits in a target set containing mt possible k-mers in total (in both strands) and the same motif had lb motifs in the background set containing mb possible k-mers, then the overrepresentation factor of the TF is defined as (lt/mt)/(lb/mb)
Statistical tests, visualization and tools used
All computational analyses and visualizations were done using the R statistical language environment [49]. To correct for multiple testing we used the p.adjust() function (method=‘BY’). We used ‘GenomicRanges’ package [50] for finding overlaps between genomic intervals. We used ‘rtracklayer’ [51] and ‘Genomiclnteractions’ [52] packages to import/export genomic positions. Linear mixed effect regression models were created using lme R function from nlme package [36]. Generalized linear mixed effect with zero inflated negative binomial models were created using glmmTMB R function from glmmTMB package [37]. Counting reads in genomic intervals was done using BEDTools [53]. Graphs were created using graphics [49], ggplot2 [54], gplots [55], and the UCSC genome browser (see URLs).
URLs
GencodeV10 TSS annotations, ftp://genome.crg.es/pub/Encode/data_analysis/TSS/Gencodev10_TSS_May2012.gff.gz; JEME FANTOM5 promoter/enhancer processed data, https://www.dropbox.com/sh/wjyqyog3p5d33kh/AACx5qgwRPIij44ImnzvpFxUa/Input%20files/FANTOM5/1_first_step_modeling?dl=0&subfolder_nav_tracking=1; FANTOM5 sample annotation biomart, http://biomart.gsc.riken.jp/; FANTOM5 DB, http://fantom.gsc.riken.jp/; UCSC genome browser, https://genome.ucsc.edu/; MEME HOCOMOCO v11 402 core mono TF motifs, http://meme-suite.org/meme-software/Databases/motifs/motif_databases.12.18.tgz
Funding
The study is supported in part by the DIP German-Israeli Project cooperation (to R.S. and R.E.), Israel Science Foundation (grant No. 1339/18 to R.S.), the Koret-UC Berkeley-Tel Aviv University Initiative in Computational Biology and Bioinformatics (to R.E.) and Len Blavatnik and the Blavatnik Family foundation (to R.S). T.A.H. is supported in part by a fellowship from the Edmond J. Safra Center for Bioinformatics at Tel-Aviv University. R.E. is a Faculty Fellow of the Edmond J. Safra Center for Bioinformatics at Tel Aviv University.
Authors’ contributions
T.A.H., R.E., and R.S. designed the research. T.A.H. developed the computational methods. T.A.H. performed the analyses, and parsed the ENCODE, Roadmap, and FANTOM5 data. R.E. and R.S. supervised the study. All authors analyzed the data and wrote the manuscript.
Competing interests
The authors declare no competing financial interests.
Ethical approval
Not applicable.
Availability of data and material
Materials (code and data) are available at http://acgt.cs.tau.ac.il/ct-focs
The code for reproducing CT-FOCS output and figures is available at https://github.com/Shamir-Lab/CT-FOCS (under BSD 3-Clause “New” or “Revised” license).
The database of CT-FOCS is available at http://acgt.cs.tau.ac.il/ct-focs/download.html.
ENCODE DNase-seq samples (106 cell types) were downloaded from GEO dataset GSE29692 [20,56,57].
Roadmap Epigenomics DNase-seq samples (73 cell types) were downloaded from GEO dataset GSE29692 [29,56–60].
FANTOM5 CAGE data were downloaded from http://fantom.gsc.riken.jp/ [22].
Acknowledgements
This work was carried out in partial fulfillment of the requirements for the Ph.D. degree at The Blavatnik School of Computer Science at Tel Aviv University of T.A.H.
List of Abbreviations
- EP
- Enhancer-Promoter
- ct-link
- Cell-Type specific enhancer-promoter link
- DHS
- DNase-I Hypersensitive Site
- CAGE
- Cap Analysis of Gene Expression
- CLS
- connected loop set
References


