

Abstract
African trypanosomes cause sleeping sickness in humans and nagana in cattle. These unicellular parasites are transmitted by the blood-sucking tsetse fly1. In the mammalian host’s circulation, tissues, and interstitium, at least two main life cycle stages exist: slender and stumpy bloodstream forms2,3,4,5,6. Proliferating slender forms differentiate into cell cycle-arrested stumpy forms at high levels of parasitaemia. This developmental stage transition occurs in response to the quorum sensing factor SIF (stumpy induction factor)7, and is thought to fulfil two main functions. First, it auto-regulates the parasite load in the host. Second, the stumpy stage is regarded as pre-adapted for tsetse fly infection and the only form capable of successful vector transmission8. Differentiation to the stumpy form is accompanied by fundamental morphological and metabolic changes, including expression of the stumpy marker, protein associated with differentiation 1 (PAD1)9. Here, we show that proliferating slender stage trypanosomes are equally able to infect the tsetse fly, and that a single parasite is sufficient. The slender parasites complete the complex life cycle in the fly with comparable overall success rates and kinetics as stumpy forms. We further show that in the tsetse midgut, the slender parasites activate the canonical PAD1 pathway, without undergoing either cell cycle arrest or a morphological transition to the stumpy form. Instead, with the onset of PAD1 expression, the parasites directly differentiate into the procyclic (insect) stage. Our findings not only propose a revision to the traditional view of the trypanosome life cycle, but also suggest a solution to a long-acknowledged paradox in the transmission event: parasitaemia in chronic infections is typically quite low, and so the probability of a tsetse ingesting a stumpy cell during a bloodmeal is also low10,11,12,13.
Results and Discussion
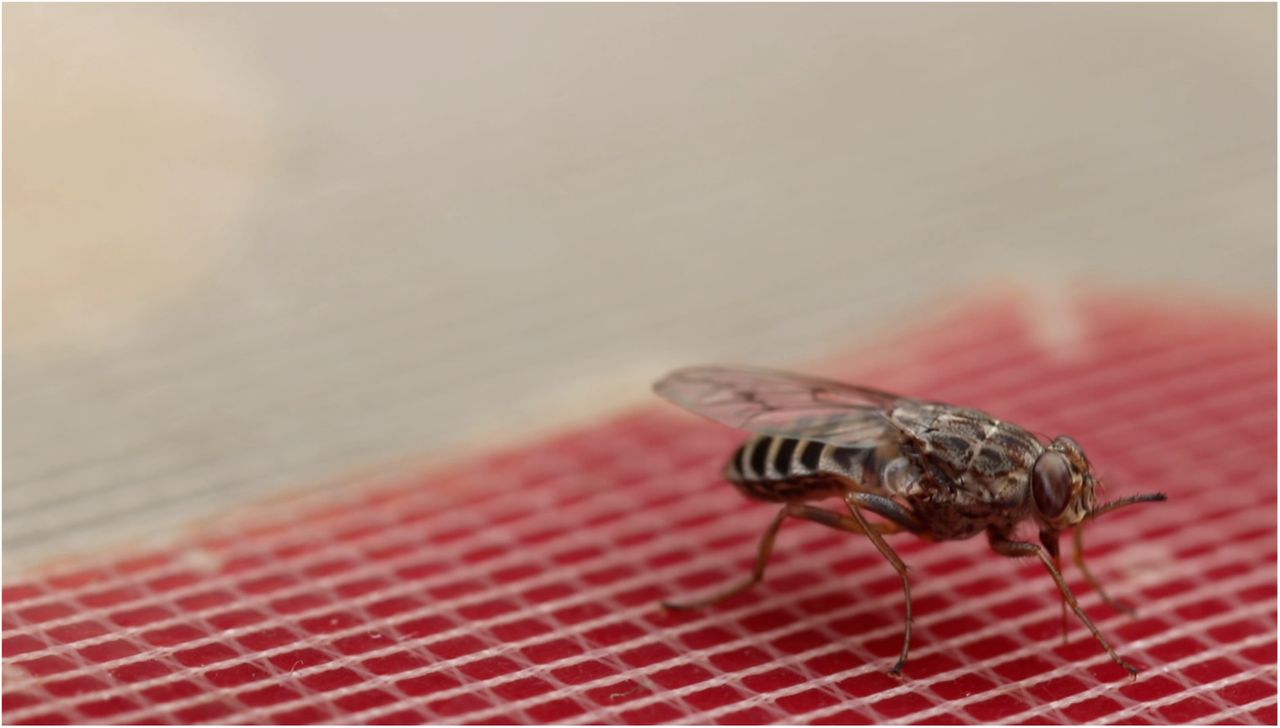
Slender and stumpy bloodstream form trypanosomes can be distinguished based on cell cycle, morphological, and metabolic criteria. The genome of the single mitochondrion (kinetoplast, K) and the cell nucleus (N) can be readily visualised using DNA stains, and their prescribed sequence of replication (1K1N, 2K1N, 2K2N) allows cell cycle stage to be inferred14. Slender cells are found in all three K/N ratios, while stumpy cells, which are cell cycle-arrested, are found only as 1K1N cells (Fig. 1A). Expression of protein associated with differentiation 1 (PAD1) is accepted as a marker for development to the stumpy stage9. Cells expressing an NLS-GFP reporter fused to the 3’ UTR of the PAD1 gene (GFP:PAD1UTR) will have GFP-positive nuclei when the PAD1 gene is active. Hence, slender cells are GFP-negative; stumpy cells are GFP-positive (Fig. 1A). We have previously shown that stumpy cells can be formed independently of high cell population density by ectopic expression of a second variant surface glycoprotein (VSG) isoform, a process that mimics one of the pathways involved in trypanosome antigenic variation15,16,17,18. These so-called expression site (ES)-attenuated stumpy cells can complete the developmental cycle in the tsetse fly18. It remained an open question whether this occurred with the same efficiency as with SIF-produced stumpy cells. To address this question, we quantitatively compared the transmission efficiency of stumpy populations generated by either SIF-treatment or through ES-attenuation. Tsetse flies (Glossina morsitans morsitans) were infected during membrane feeding (Fig. 1B; Supplementary Video 1) with defined numbers of pleomorphic trypanosomes, which are capable of completing the entire developmental cycle. Two transgenic trypanosome cell lines, both of which contained the GFP:PAD1UTR reporter construct, were used. One was subjected to ectopic VSG expression to drive ES attenuation (line ES;18). The other was treated with stumpy induction factor (line SIF). Both treatments resulted in expression of the GFP:PAD1UTR reporter and synchronous differentiation to the stumpy stage. The resulting stumpy populations were fed to tsetse flies at concentrations ranging from 120,000 to 10 cells/ml. A feeding tsetse typically ingests 20 µl of blood19, meaning that between 2,400 and 0.2 trypanosomes were ingested per bloodmeal on average (Fig. 1C, rows i-vi, column 2, Total). The trypanosomes had been previously scored for expression of the GFP:PAD1UTR reporter to confirm their identity as stumpy forms (Fig. 1C, columns 3-4). To analyse the infections, we carried out microscopic analyses of dissected tsetse digestive tracts (Fig. 1D, E). The presence of mammal-infective, metacyclic trypanosomes in explanted tsetse salivary glands indicated completion of the tsetse transmission cycle (Fig. 1F). The uptake, on average, of two stumpy parasites of either cell line produced robust infections of tsetse midgut (MG), proventriculus (PV), and salivary glands (SG) (Fig. 1C, columns 5-7). Ingestion, on average, of even a single stumpy cell was sufficient to produce salivary gland infections in almost 5% of all tsetse (Fig. 1C, row v). When the stumpy parasite number was further reduced to 0.2 cells on average per bloodmeal, 0.9% of flies still acquired salivary gland infections (Fig. 1C, row vi). As a measure of the incidence of life cycle completion in the tsetse fly, we calculated the transmission index (TI; ratio of salivary gland to midgut infections) for each condition20. We found that for flies infected with 2 trypanosomes on average, the TI was comparable between SIF-induced (TI = 0.29) and ES-induced (TI = 0.31) stumpy trypanosomes (Fig. 1C, rows iii-iv). A similar TI of 0.23 was observed in flies ingesting on average 1 trypanosome (Fig. 1C, row v). Thus, our data clearly show that a single stumpy cell is sufficient to infect a tsetse fly. As a control, infections were also carried out using a monomorphic trypanosome strain (Supplementary Table 1A). Monomorphic trypanosomes are able to infect the tsetse midgut, but are incapable of completing the developmental cycle in the fly21,22. As expected, no salivary gland infections were seen using these cells. Next, we did an experiment that was originally intended as an additional negative control: we infected tsetse flies with proliferating PAD1-negative slender trypanosomes from the two pleomorphic cell lines used (Fig. 1C, rows vii-xi). We expected these cells not to passage through the fly. Remarkably, however, there was almost no difference in the infection efficiency when the flies were fed with either 20 stumpy trypanosomes or 20 pleomorphic slender trypanosomes (Fig. 1C, compare TI for rows ii and vii). When flies were fed with on average 2 slender parasites each, the TI was actually higher for slender cells (0.60) than for stumpy cells (0.31) (Fig. 1C, compare TI for rows viii and iii). This TI of 0.60 was identical for both populations of slender cells (Fig. 1C, rows viii-ix). Next, when given on average just one PAD1-negative slender cell per bloodmeal, parasite infections still made it through the midgut, proventriculus, and salivary glands with incidences of 4.9%, 4.3%, and 2.1% respectively, at a TI of 0.44 (Fig. 1C, row x). In order to be absolutely sure that slender trypanosomes can passage through the tsetse, we repeated the experiment with naïVe slender parasites that had been freshly differentiated from insect-derived metacyclic trypanosomes, i.e. cells that had just restarted the mammalian stage life cycle (Supplementary Table 1, row iii). Infections with on average two freshly-differentiated slender trypanosomes per bloodmeal revealed 6.9% midgut and 2.5% salivary gland infections. The transmission index was 0.36.

Video of a tsetse fly taking a bloodmeal through a silicon membrane.
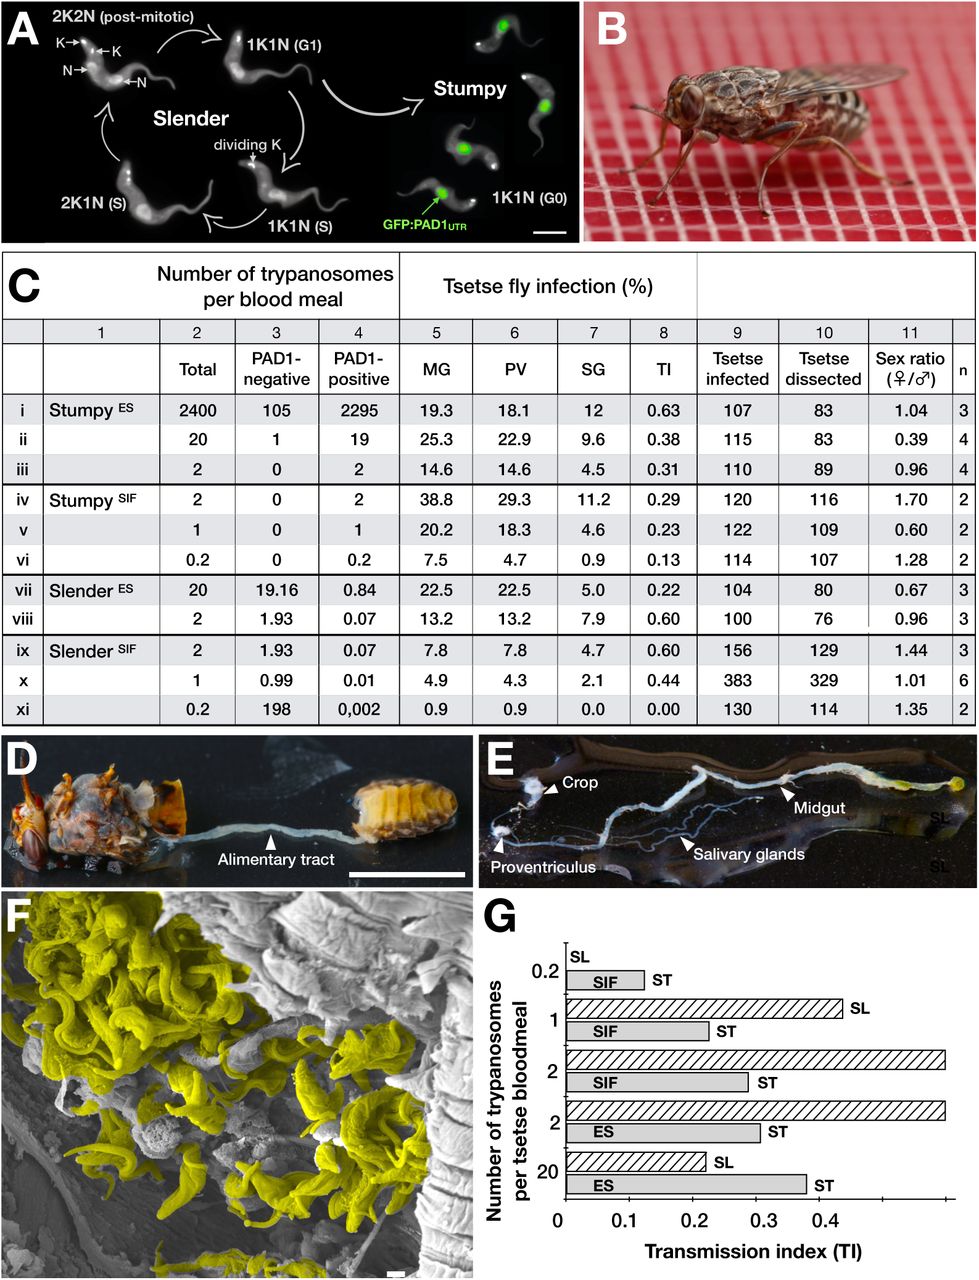
Slender trypanosomes can complete the entire life cycle in the tsetse fly vector.
(A) Cell cycle (G1/S/post-mitotic), morphology, and differentiation of bloodstream form (mammalian-infective stage) trypanosomes. Proliferation of slender trypanosomes is detectable by duplication and segregation of the mitochondrial genome (kinetoplast, K) and nuclear DNA (N) over time. Quorum sensing causes cell cycle arrest (G0) and expression of the stumpy marker PAD1. Images are false-coloured, maximum intensity projections of deconvolved 3D stacks. The green colour indicates the nuclear GFP:PAD1UTR fluorescence, while the DAPI-stained kinetoplast and nucleus, and the AMCA-sulfo-NHS-labelled parasite cell surface, are shown in grey. Scale bar: 5 µm.
(B) Trypanosome infections of tsetse flies were achieved via bloodmeal, which consists typically of 20 µl, through a silicon membrane. The corresponding video is available in the Supplementary information (Supplementary Video 1).
(C) Slender trypanosomes can complete the entire tsetse infection cycle, and a single parasite is sufficient for tsetse passage. The flies were infected with either stumpy or slender trypanosomes. Stumpy trypanosomes were generated by induction of expression site attenuation (ES), or SIF-treatment (SIF). MG, midgut infection; PV, proventriculus infection; SG, salivary gland infection; TI, transmission index (SG/MG); n, number of independent fly infection experiments.
(D) Dissection of an infected tsetse fly for explantation of the alimentary tract. Scale bar: 5 mm.
(E) Explanted alimentary tract of the tsetse, with the different subcompartments labelled. Scale bar: 5 mm.
(F) Scanning electron micrograph of a typical trypanosome infection of the tsetse salivary glands, with epimastigote and mammal-infective metacyclic trypanosomes. Parasites are pseudocoloured yellow. Scale bar: 1 µm.
(G) Graphical representation of the transmission index TI (SG/MG) of slender (striped, SL) and stumpy (solid, ST) trypanosomes at different numbers per bloodmeal (data reproduced from Figure 1C). A high TI indicates successful completion of the life cycle in the tsetse vector. At low infective doses, slender trypanosomes had a higher TI compared to stumpy parasites. There was no difference between stumpy parasites generated by SIF-treatment (SIF) or expression site attenuation (ES).
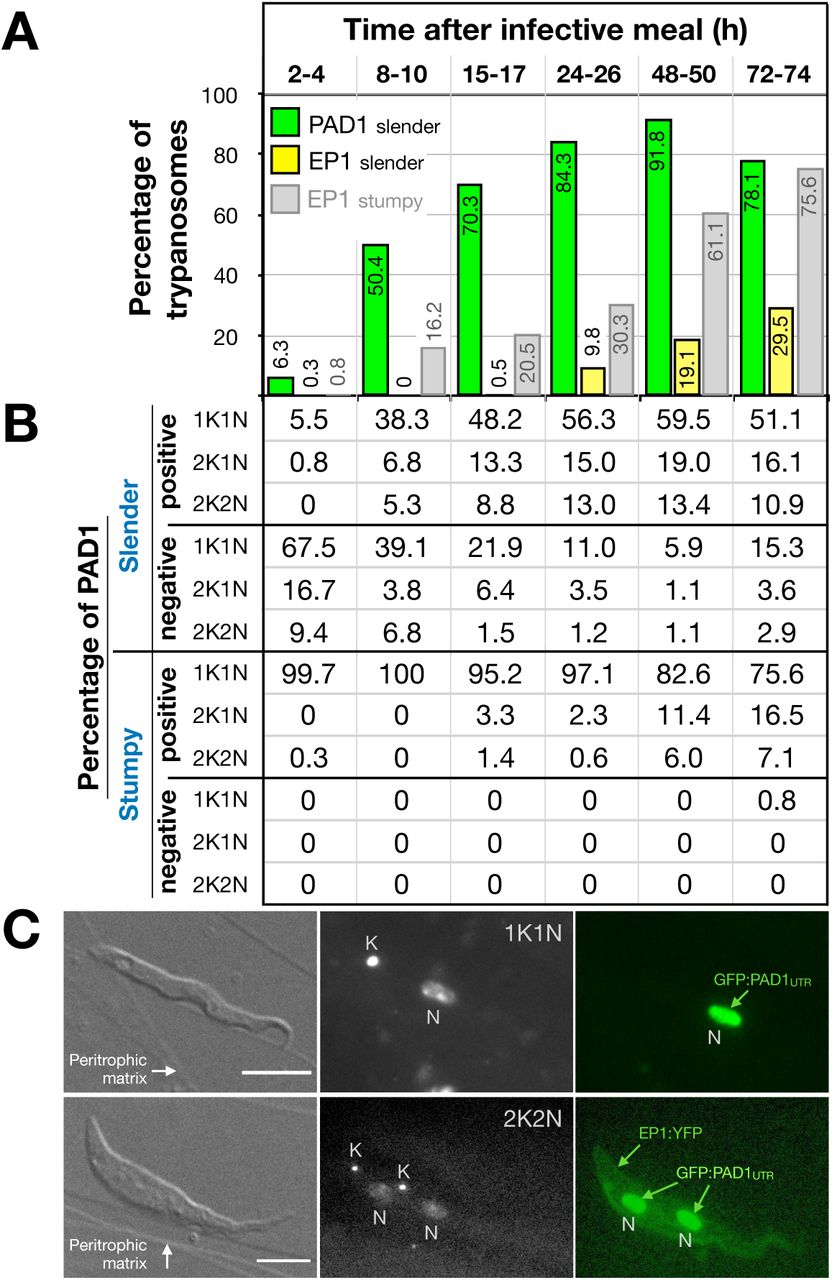
It is important to note however that while ES-attenuated cells showed similar midgut, proventriculus, and salivary gland infection incidence as either stumpy or slender forms (Fig. 1C, rows ii-iii and vii-viii), the SIF-induced stumpy cells were better at establishing infections than their slender counterparts (Fig. 1C, rows iv-vi and ix-xi). Infections with 1-2 slender cells, however, produced higher TI values than those with the same numbers of stumpy cells (Fig. 1G). This suggests that the proliferative slender cells are more capable of progressing from a midgut infection to a salivary gland one, and thus have at least comparable developmental competence to the stumpy forms. In summary, our experiments not only establish that single trypanosomes (either slender or stumpy) can infect the tsetse fly, but also strongly suggest that slender cells can efficiently complete the passage through the tsetse fly. To determine how slender trypanosomes manage to establish infections, we observed the early events following trypanosome ingestion by tsetse flies (Supplementary Video 2). The canonical version of events is that ingested stumpy (i.e. PAD1-positive) cells reactivate the cell cycle, begin to express the EP procyclin protein on their cell surface, and differentiate to the procyclic life cycle stage. We infected tsetse with pleomorphic trypanosomes, which not only contained the stumpy-specific GFP:PAD1UTR marker, but also encoded an EP1:YFP fusion23. In this way, the onset of stumpy development was observable as GFP fluorescence in the nucleus, and further differentiation to the procyclic life cycle stage as YFP fluorescence on the parasite cell surface. In addition, the cell cycle status (K/N counts, see Fig. 1A), morphology, and the characteristic motile behaviour of the trypanosomes were also assessed as criteria of developmental progress. In total, 114 tsetse flies (57 male and 57 female) were dissected after at least six independent infections with either 12,000 slender or stumpy parasites each (Fig. 2). These high initial parasite numbers allowed the microscopic analysis of individual living slender (n = 1845) and stumpy trypanosomes (n = 1237) within the convoluted microenvironment of midgut explants24. As early as 2-4 h post-infection with slender trypanosomes, a few (0.8%) dividing trypanosomes with a nuclear PAD1 signal could be observed (Fig. 2A). After 8-10 hours however, half (50.4%) of all trypanosomes in the explants were PAD1-positive. After 24 hours, 84.3% of the parasites expressed PAD1, and 9.8% had already initiated developmental progression to the procyclic insect stage, as evidenced by EP1:YFP fluorescence on their cell surface. At 48-50 h post-infection with slender trypanosomes, virtually the entire trypanosome population (91.8%) expressed PAD1, and almost one fifth (19.1%) was EP1-positive. To examine cell cycle progression, we counted the number of 1K1N, 2K1N, and 2K2N cells in the PAD1-positive and PAD1-negative slender cell populations (Fig. 2B, slender). Remarkably, 8-10 h post-infection, replicating (i.e. 2K1N, 2K2N) cells that were PAD1-positive could be readily observed. Over the duration of the experiment, PAD1-negative cells gradually decreased in numbers, while PAD1-positive slender cells at all cell cycle stages were increasingly observed (Supplementary Video 2C). Thus, the PAD1 pathway is triggered in the fly, but apparently without pushing the slender parasites towards cell cycle arrest. Of note, EP1 expression did not exactly correlate with acquisition of procyclic morphology. At 24-26h, only 9.8% of slender cells are EP1-positive (Fig. 2A), but the EP1-negative cells frequently exhibited procyclic morphology (Fig. 2C, upper panels). An example of a dividing (2K2N), PAD1-positive, EP1-positive cell is also shown (Fig. 2C, lower panels; Supplementary Video 2D). Thus, it appears that a seamless developmental stage transition from slender bloodstream forms to the procyclic insect forms takes place, which is accompanied by the typical reorganisation of the cytoskeleton and the concomitant switch of swimming styles25,24.

After uptake by the tsetse fly, slender trypanosomes promptly launch the PAD1 pathway, without arresting in the cell cycle. All videos were recorded at 250 fps, and the cell cycle position is indicated by DAPI staining.

Slender trypanosomes differentiate to the procyclic life cycle stage in the tsetse fly without undergoing cell cycle arrest. Tsetse flies were infected with either slender (3.6% PAD1-positive) or stumpy (100% PAD1-positive) trypanosomes. 72 (slender) or 42 (stumpy) flies were dissected (equal sex ratios) at different timepoints after infection. Experiments were done at least three times; data are presented as sample means.
(A) Living trypanosomes (>100 cells per time point) were microscopically analysed in the explants and scored for the expression of the fluorescent stumpy reporter GFP:PAD1UTR in the nucleus (green bar), and the procyclic insect stage reporter EP1:YFP on the cell surface (yellow bar). The grey bars show EP1:YFP expression in infections using stumpy cells. GFP:PAD1UTR expression in stumpy trypanosomes is not shown, because all cells were positive.
(B) Slender (n=1845) and stumpy (n=1237) trypanosomes scored as PAD1-positive or -negative in (A), were stained with DAPI, and the cell cycle position determined based on the configuration of kinetoplast (K) to nucleus (N) at the timepoints indicated.
(C) Exemplary images of procyclic trypanosomes in the tsetse explants 24h post-infection with slender cells. Morphology (DIC panels, left), cell cycle status (DAPI label, middle panels) and expression of fluorescent reporters (right) were scored. Note that the upper panels show a cell with procyclic morphology that is nonetheless EP1:YFP-negative, indicating that the EP1 signal underestimates the total numbers of procyclic cells in the population. Scale bar: 5 µm.
In order to directly compare the kinetics of slender-to-procyclic development with that of stumpy stage trypanosomes, we fed flies with SIF-induced, PAD1-positive stumpy trypanosomes (Fig. 2B, stumpy). These cells remained in cell cycle arrest for the first day, and re-entered the cell cycle as procyclic parasites after day 2-3. Stumpy trypanosomes showed a higher incidence of EP1:YFP expression than slender cells at all timepoints (Fig. 2A, grey bars). The procyclic marker EP1:YFP was already visible on the cell surface of 16.2 % of trypanosomes after 10 hours, showing that EP expression was initiated before release of cell cycle arrest. Uncoupling of EP surface expression from the commitment to differentiation has been reported before23.
We further investigated the developmental potential of pleomorphic slender bloodstream forms in vitro using the same cell lines and analysis as above. Differentiation to the procylic insect stage was induced by the addition of cis-aconitate and a temperature drop from 37°C to 27°C26,27,28,23 (Fig. 3). Slender trypanosomes activated the PAD1 pathway immediately, with 9.8% of all parasites being PAD1-positive within 2-4 hours, and 83.2% after 10 hours. PAD1 expression peaked after one day (98.3%), and declined thereafter (Fig. 3A). Simultaneously with PAD1 reporter expression, EP1 appeared on the cell surface of 19.6% of all parasites within 8-10 hours, increasing to 98.3% after 3 days (Fig. 3A). Throughout the timecourse, PAD1-positive 2K1N and 2K2N cells were consistently observed, demonstrating that the PAD1-positive slender parasites did not arrest in the cell cycle, and continued dividing throughout in vitro differentiation to the procyclic stage (Fig. 3B). After 3 days of cis- aconitate treatment in vitro, slender trypanosomes had established a proliferating procyclic parasite population.

Slender trypanosomes differentiate to the procyclic life cycle stage in vitro without cell cycle arrest. Cultured slender or stumpy trypanosomes were differentiated in vitro by the addition of cis-aconitate and temperature reduction to 27°C.
(A) At the times indicated, trypanosomes were analysed for the expression of the fluorescent reporters GFP:PAD1UTR and EP1:YFP, as in Fig. 2.
(B) Slender (n=1653) and stumpy (n=1798) trypanosomes were stained with DAPI and the configuration of the nucleus (N) and kinetoplast (K) was microscopically determined to identify the cell cycle stage. Data are compiled from five independent experiments, with each timepoint being analysed in at least two separate experiments.
By comparison, stumpy parasites (Fig. 3A, grey bars) responded to in vitro cis- aconitate treatment with rapid expression of the EP1:YFP marker, with 28.6% of all cells being positive within 2-4 hours. After one day, EP1 was present on almost all (96.7%) stumpy trypanosomes. The cell cycle analysis revealed that the parasites were not dividing, however (Fig. 3B). The first cells re-entered the cell cycle only after 15-17 hours, and a normal procyclic cell cycle profile was not reached until 3 days. Thus, the in vitro differentiation supported the in vivo observations, demonstrating that pleomorphic slender trypanosomes are able to directly differentiate to the procyclic stage without becoming cell cycle-arrested stumpy cells. Furthermore, the overall developmental capacity and differentiation kinetics of both life cycle stages are comparable, in vitro and in vivo.
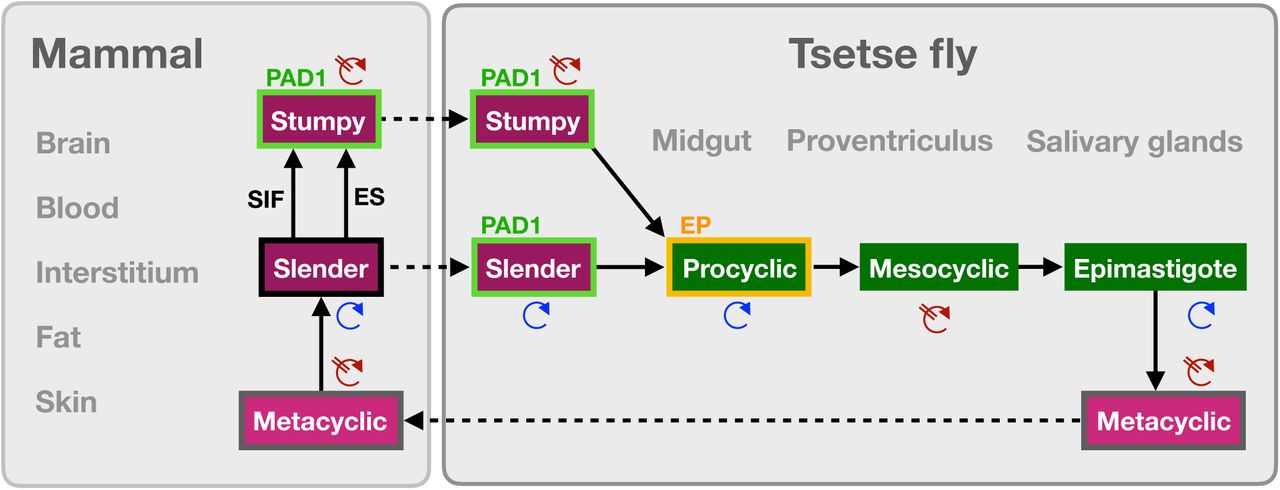
In conclusion, our observations suggest a revised view on the life cycle of African trypanosomes (Fig. 4). One trypanosome suffices to produce robust infections of the vector, and the stumpy stage is not essential for tsetse transmission. Slender parasites can complete the complex life cycle in the fly with comparable overall success rates and kinetics as the stumpy forms. The stumpy stage appears more able to establish initial infections in the fly midgut, however (Fig. 1C, column 5, MG). This may be related to a greater resistance against the digestive environment in the fly’s gut, as has been discussed29,30. On the other hand, stumpy trypanosomes are not replicative, and their lifetime is limited to roughly 3 days31. In the fly, re-entry into the cell cycle is by no means immediate, but takes at least two days. Thus, stumpy cells may run into an age-related problem. Conversely, slender-derived parasites appear to travel more efficiently to their final destination within the tsetse, the salivary glands. The significantly higher mobility of slender forms when compared to stumpy trypanosomes32, and the seamless differentiation to the motile procyclic stage could be involved in this migratory success. Along similar lines, it is worth noting that Trypanosoma congolense, the principal causative agent of the cattle plague nagana, infects tsetse flies without manifesting a cell cycle-arrested stumpy life cycle stage33. This raises the question of what the true biological function of the stumpy life cycle stage actually is.

A revised life cycle for the parasite Trypanosoma brucei. Cell-cycle-arrested metacyclic trypanosomes are injected by the tsetse fly into the mammalian host’s skin. There, the parasites re-enter the cell cycle, and proliferate as slender forms in the blood, while disseminating into the interstitium and various tissues, including fat, and brain. At least two triggers (SIF or ES) launch the PAD1-dependent differentiation pathway to the cell cycle-arrested stumpy bloodstream stage. Stumpy trypanosomes can establish a fly infection when taken up with the bloodmeal of a tsetse. This work reveals that proliferating slender stage trypanosomes are equally effective for tsetse transmission, that a single parasite suffices, and that no cell cycle arrest is required for differentiation to the procyclic insect stage.
Methods
Trypanosome culture
Pleomorphic Trypanosoma brucei brucei strain EATRO 1125 (serodome AnTat1.1)34 bloodstream forms were grown in HMI-9 medium35, supplemented with 10% (v/v) fetal bovine serum and 1.1% (w/v) methylcellulose (Sigma 94378)36 at 37°C and 5% CO2. Slender stage parasites were maintained at a maximum cell density of 5×10⁵ cells/ml. For cell density-triggered differentiation to the stumpy stage, cultures seeded at 5×10⁵ cells/ml were cultivated for 48 hours without dilution. Pleomorphic parasites were harvested from the viscous medium by 1:4 dilution with trypanosome dilution buffer (TDB; 5 mM KCl, 80 mM NaCl, 1 mM MgSO4, 20 mM Na2HPO4, 2 mM NaH2PO4, 20 mM glucose, pH 7.6), followed by filtration (MN 615 ¼, Macherey-Nagel, Germany) and centrifugation (1,400xg, 10 min, 37°C)18. Monomorphic T. brucei 427 MITat 1.2 13-90 bloodstream forms37 were grown in HMI-9 medium35, supplemented with 10% (v/v) fetal bovine serum at 37°C and 5% CO2.
For in vitro differentiation to the procyclic insect stage, bloodstream stage trypanosomes were pooled to a cell density of 2×10⁶ cells/ml in DTM medium immediately before use38. Cis-aconitate was added to a final concentration of 6 mM26,38 and temperature was adjusted to 27°C. Procyclic parasites were grown in SDM79 medium39, supplemented with 10% (v/v) fetal bovine serum35 and 20 mM glycerol40,24.
Genetic manipulation of trypanosomes
Transfection of pleomorphic trypanosomes was done as previously described18, using an AMAXA Nucleofector II (Lonza, Switzerland). Transgenic trypanosome clones were selected by limiting dilution in the presence of the appropriate antibiotic. The GFP:PAD1UTR reporter construct18 was used to transfect AnTat1.1 trypanosomes to yield the cell line ‘SIF’. The trypanosome ‘ES’ line was described previously18. It contains the reporter GFP:PAD1UTR construct and an ectopic copy of VSG gene MITat 1.6 under the control of a tetracycline-inducible T7-expression system. The EP1:YFP construct was integrated into the EP1-procyclin locus as described previously23.
Tsetse maintenance
The tsetse fly colony (Glossina morsitans morsitans) was maintained at 27°C and 70% humidity. Flies were kept in Roubaud cages and fed 3-times a week through a silicon membrane, with pre-warmed, defibrinated, sterile sheep blood (Acila, Germany).
Fly infection and dissection
Teneral flies were infected 1-3 days post-eclosion during their first meal. Depending on the experiment, trypanosomes were diluted in either TDB or sheep blood. The infective meals were supplemented with 60 mM N-acetylglucosamine41. For infection with monomorphic parasites, cells were additionally treated for 48 hours with 12.5 mM glutathione (GSH)42 and 100 µM 8-pCPT-cAMP (cAMP)7.
Tsetse infection status was analysed between 35 and 40 days post-infection. Flies were euthanized with chloroform and dissected in PBS. Intact tsetse alimentary tracts were explanted and analysed microscopically, as described previously (Schuster, 2017). For the analysis of early trypanosome differentiation in vivo, slender or stumpy trypanosomes at a concentration of 6×10⁵ cells/ml were resuspended in TDB to the required final concentration and fed to flies. The numbers of flies used and the number of independent experiments carried out are indicated in the figure legends. Results are presented as sample means.
Fluorescence microscopy and video acquisition
Live trypanosome imaging was performed with a fully automated DMI6000B wide field fluorescence microscope (Leica microsystems, Germany), equipped with a DFC365FX camera (pixel size 6.45 µm) and a 100x oil objective (NA 1.4). For high-speed imaging, the microscope was additionally equipped with a pco.edge sCMOS camera (PCO, Germany; pixel size 6.5 µm). Fluorescence video acquisition was performed at frame rates of 250 fps. For visualisation of parasite cell cycle and morphology, slender and stumpy trypanosomes were harvested and incubated with 1 mM AMCA-sulfo-NHS (Thermo Fisher Scientific, Germany) for 10 minutes on ice. Cells were chemically fixed in 4% (w/v) formaldehyde and 0.05% (v/v) glutaraldehyde overnight at 4°C. DNA was visualised with 1 µg/ml DAPI immediately before analysis. 3D-Imaging was done with a fully automated iMIC wide field fluorescence microscope (FEI-TILL Photonics, Germany), equipped with a Sensicam qe CCD camera (PCO, Germany; pixel size 6.45 µm) and a 100x oil objective (NA 1.4). Deconvolution of image stacks was performed with the Huygens Essential software (Scientific Volume Imaging B.V., Netherlands). Fluorescence images are shown as maximum intensity projections of 3D-stacks in false colours with green fluorescence in green and blue fluorescence in grey.
Scanning electron microscopy
Explanted tsetse alimentary tracts were fixed in Karnovsky solution (2% formaldehyde, 2.5% glutaraldehyde in 0.1M cacodylate buffer, pH 7.4) and incubated overnight at 4°C. Samples were washed 3-times for 5 minutes at 4°C with 0.1M cacodylate buffer, pH 7.4, followed by incubation for 1 hour at 4°C in post-fixation solution (2.5% glutaraldehyde in 0.1M cacodylate buffer, pH 7.4). After additional washing, the samples were incubated for 1 hour at 4°C in 2% tannic acid in cacodylate buffer, pH 7.4, 4.2% sucrose, and washed again in water (3x for 5 minutes, 4°C). Finally, serial dehydration in acetone was performed, followed by critical point drying and platinum coating. Scanning electron microscopy was done using the JEOL JSM-7500F field emission scanning electron microscope.
Data Availability
All datasets generated during this project are provided as online source data. The cell lines used are available from the corresponding author on request.
Author contributions
S.S. designed the experiments, performed the experiments, analysed the data, interpreted the results and wrote the manuscript. I.S. designed the experiments, performed the experiments, analysed the data and interpreted the results. J.L. designed the experiments, performed the experiments, analysed the data, interpreted the results and wrote the manuscript. H.Z., designed the experiments, performed the experiments, analysed the data and interpreted the results. C.R. designed the experiments, performed the experiments, analysed the data and interpreted the results. B.M. interpreted the results and wrote the manuscript. M.E. conceived the study, designed the experiments, analysed the data, interpreted the results and wrote the manuscript.
Competing interests
The authors declare no competing interests.
Acknowledgements
We thank Nicola Jones, Susanne Kramer, Manfred Alsheimer, Christian Janzen and Ricardo Benavente for discussion and critical reading of the manuscript. ME is supported by DFG grants EN305, SPP1726 (Microswimmers – From Single Particle Motion to Collective Behaviour), and GRK2157 (3D Tissue Models to Study Microbial Infections by Obligate Human Pathogens). ME is member of the Wilhelm Conrad Roentgen Center for Complex Material Systems (RCCM).


