

Abstract
Researchers stand to gain insight into complex biological systems by assembling multiple single-cell RNA-sequencing (scRNA-seq) studies to reveal a panoramic view of overarching biological structure. Unfortunately, many existing scRNA-seq analyses are limited by sensitivity to study-specific noise patterns, by lack of scalability to large datasets, or by integrative transformations that obscure biological relevance. We therefore introduce a novel algorithmic framework that analyzes groups of cells in coexpression space across multiple resolutions, rather than individual cells in gene expression space, to enable multi-study analysis with enhanced biological interpretation. We show that our approach reveals the biological structure spanning multiple, large-scale studies even in the presence of batch effects while facilitating biological interpretation via network and latent factor analysis. Our coexpression-based analysis enables an unprecedented view into two complex and dynamic processes—neuronal development and hematopoiesis—by leveraging a total of seven studies containing 1,460,527 cells from laboratories spanning three continents, yielding systems-level insight unattainable by any individual experiment. Our work demonstrates a path toward probing highly complex biological systems from emerging consortium-scale single-cell transcriptomics.
Introduction
Fundamental biological processes, like neuronal development or hematopoiesis, are of broad importance but are also highly complex. While researchers can now functionally interrogate such processes at a high resolution with single cell RNA-sequencing (scRNA-seq)1–7, the underlying biology is often more dynamic and multi-faceted than what can be captured by a single experiment. Instead, multiple laboratories assay different parts and stages of the process using many separate scRNA-seq experiments. A major computational and analytic challenge is to provide researchers with insight into the full biological landscape of interest (for example, across the full range of development or differentiation) not previously accessible by any individual experiment8.
Multi-study scRNA-seq analysis, however, remains challenging for a number of reasons. Such analysis involves extracting overarching, systems-level insight, but it must do so within a practical amount of computation. Moreover, biological signal in multi-study analysis is confounded by study-specific noise patterns. This problem has motivated techniques for computational batch effect correction9–15, but existing approaches integrate experiments using transformations that obscure the biological relevance of individual data values, making it difficult for downstream analyses to interpret the transformed result. Existing integrative algorithms also aim to minimize inter-study variation, thus removing relevant differences that would otherwise be useful to biological researchers.
To enable robust, consortium-scale scRNA-seq analysis, we reasoned that scRNA-seq analysis of groups of cells in the gene coexpression space (captures the similarity of gene expression changes between pairs of genes), rather than single cells in the gene expression space (focuses on the expression patterns of individual genes), would be a more favorable paradigm. Coexpression is more robust to experiment-specific noise patterns than gene expression measurements; not only are many coexpression measures (for example, Pearson correlation) robust to affine transformation, some evidence suggests that gene coexpression and information redundancy underlie cross-study replicability of single-cell experiments16–18. Coexpression also provides a rich feature space with directly meaningful values that capture pairwise dependencies among genes, allowing for graph-theoretic analysis of gene coexpression networks. There is a wealth of existing literature, developed in both single-cell and bulk settings19–23, for inferring a coexpression network and determining gene modules within a network. Previous work, however, has not focused on analyzing the meaningful variation across multiple coexpression networks over a large biological landscape.
Here we demonstrate that coexpression is a valuable paradigm for consortium-scale scRNA-seq analysis. We develop a novel algorithmic framework, which we call Coscape, that constructs a landscape of coexpression variation by piecing together information across multiple studies and resolutions to capture meaningful changes in complex biological systems. We leverage our coexpression paradigm to conduct unprecedented meta-analyses of large-scale scRNA-seq datasets profiling mouse neuronal development and human hematopoiesis. We focus on these biological systems because they have been extensively profiled across many large-scale scRNA-seq studies1–7 which have meaningful developmental differences that we do not wish to completely remove. We analyze data from laboratories spanning three continents and containing a total of 1,460,527 high quality cells and uncover rich, systems-level insight into the genes involved in functions as diverse as neuronal activation, synaptic development, neuronal cell division, lymphocyte activation, and coagulation. We obtain additional biological validation from existing literature and from other data modalities including in situ hybridization and protein interaction networks. We envision that the techniques and ideas outlined here will help enable analyses that take advantage of a wealth of scRNA-seq data generated across diverse biological systems.
Results
Coexpression-based analysis using pan-resolution clustering
Our coexpression-based analysis is fundamentally based on statistics computed over groups of cells, rather than individual cells. Coexpression is typically measured by computing a gene-by-gene correlation matrix over a cluster of cells. Coexpression measurements, however, may change with clustering resolution16,24 and single cell datasets often have meaningful multiresolution structure25. We therefore introduce a strategy that repeatedly clusters a dataset at multiple resolutions and considers all clusters for downstream analysis (Figure 1a; Methods); we refer to this strategy as pan-resolution clustering (panclustering). Panclustering ensures that our algorithm captures coexpression patterns across multiple resolutions, which, as we demonstrate below, can increase the discovery of gene interactions corroborated by other biological networks.

(a) Our algorithm for coexpression-based analysis of scRNA-seq data, which we refer to as Coscape. Cells are clustered at multiple resolutions, with groups of cells colored individually, resulting in an ensemble of clusters in which each cluster in each resolution defines a single gene-gene correlation matrix. These matrices are sparsified with a winner-take-all strategy in which weak correlations are set to zero. We use these sparsified correlation matrices as our coexpression features, where each datapoint in subsequent downstream analysis is a cluster of cells. The KNN graph of coexpression matrices forms the “coexpression landscape” that captures the topological relationships between pan-resolution clusters. Many downstream analyses are then possible, including trajectory learning and pseudotime assignment. Coexpression matrices are expressed as a combination of a few basis matrices, or “dictionary entries”; pairs of genes unique to a dictionary entry can be thought of as “marker edges,” for which we can look at enriched gene ontology (GO) processes. (b) Many of these analyses take inspiration from analogs in gene expression space. For example, rather than visualizing pan-resolution clusters in coexpression space, standard analyses visualize single cells in expression space; rather than decomposing coexpression matrices via dictionary learning, the expression matrix is decomposed via algorithms such as nonnegative matrix factorization. Coexpression space, however, enjoys enhanced interpretability, multi-study robustness, and scalability to large-scale studies. (c) A conceptual illustration of the difference between attempting to extract biological information from single-studies, each profiling different parts of a larger biological system (“Traditional single-cell expression analysis”); integrative algorithms that attempt to minimize inter-study variation but may also remove overarching biological structure (“Traditional single-cell integration”); and piecing together structure across multiple studies of complex and dynamic biological systems, which we accomplish with single-cell coexpression (“Desired unified transcriptomic landscape”).
Our implementation of panclustering is based on the Louvain community detection algorithm26, a common clustering method for scRNA-seq data. Louvain clustering iteratively merges cells into cluster “communities” until convergence, which is controlled by a resolution parameter27 (higher resolutions tend to increase the number of communities). We obtain many possible realizations of a Louvain clustering by repeating the algorithm with multiple resolution parameters and, importantly, also keeping cluster information from each agglomerative iteration (Figure 1a; Methods). Each cluster defines a single gene-by-gene correlation matrix, on which we perform an additional sparsification step that sets low correlations to zero to both reduce the influence of noisy associations and improve computational efficiency (Methods). We choose Louvain clustering due to its asymptotic efficiency, since its runtime and space usage scales with the size of the k-nearest neighbor (KNN) graph of cells (i.e., each cell is a node in the graph), rather than quadratically in the number of cells as in other hierarchical clustering algorithms.
Each datapoint in the downstream analysis therefore represents a cluster of cells featurized by coexpression. Importantly, we can then perform analyses like visualizing the KNN graph of coexpression matrices (which we refer to as the “coexpression landscape”), arranging the coexpression matrices into a trajectory, and finding common patterns within groups of similar coexpression matrices via dictionary learning (Figure 1a). We call our overall algorithm Coscape since it constructs and analyzes the coexpression landscape. Many of the parts of Coscape have analogous versions within typical analyses of single cells in gene expression space (Figure 1b), but here we demonstrate that similar lines of thinking can be transferred to pan-resolution clusters of cells in gene coexpression space. Unlike traditional scRNA-seq analysis, in which information is largely separated according to study, Coscape pieces together information across multiple studies to form a naturally unified landscape (Figure 1c). Such a landscape becomes especially valuable when researchers seek to understand the meaningful biological changes among different studies (for example, studies assaying different stages of development), which would be difficult to preserve using traditional integrative methods9–15 that attempt to minimize any inter-study variation (Figure 1c).
Unified trajectory of neuronal development across five studies containing 932,301 cells
Given a wealth of scRNA-seq datasets that profile the mouse brain, we first sought to determine if coexpression would be robust to combining data across diverse studies to construct a picture of neuronal development at an unprecedented scale. We applied Coscape to five large-scale, published scRNA-seq studies of mouse neurons spanning multiple timepoints during development from embryo to adult. The first study1 used sci-RNA-seq3 to profile 562,272 cells representing the neural tube and notochord collected at day-length intervals from a 9.5-day-old embryo (E9.5) through E13.5; the second3 used Drop-seq and 10x Chromium v2 to profile 50,363 cortical neurons from late embryonic (E13.5 - E14.5) and P10; the third2 used Microwell Seq to profile 10,796 cells across three developmental timepoints representing embryonic (E14.5), neonatal (1-day-postnatal, or P1), and adult (P56); the fourth4 used 10x Chromium v1 to profile 101,213 neurons from multiple adolescent timepoints from P12 through P27 and from a P60 adult; and the fifth5 used Drop-seq to profile 207,657 neurons from P60 through P70 adults. This data was generated by laboratories spanning both United States coasts and three continents using diverse scRNA-seq platforms and in total profiled more than 150 individual mice.
When we visualize the coexpression landscape formed by the KNN graph in which each node is a pan-resolution cluster, the graphical topology naturally arranges according to biological age (Figure 2a,b) rather than study-specific structure. Our visualization method is based on the ForceAtlas2 algorithm28, which learns a force-directed embedding of the KNN graph. Then, analogous to assigning pseudotimes to cells in gene expression space, we can likewise run a diffusion-based pseudotime (DPT) algorithm29 within the coexpression landscape. We quantify the clear visual age-dependent structure by running a DPT algorithm using the cluster with the lowest average age as the root of the diffusion process (Figure 2c,d). Pseudotimes assigned to pan-resolution clusters in coexpression space were substantially more correlated with biological age than to clusters in gene expression space with or without integration (Figure 2c; Supplementary Fig. 1).

(a) A force-directed layout of the k-nearest-neighbors graph of pan-resolution clusters in coexpression space, which we refer to as the “coexpression landscape,” reveals a temporal trajectory consistent with biological age. (b, c) Diffusion pseudotime starting from the lowest-age node is strongly associated (Spearman ρ = 0.8; n = 2,380 pan-resolution clusters) with biological age. (e-h) Coexpression matrix dictionary learning of all pan-resolution clusters yields dictionary entries that are specific to different developmental stages. Each dictionary entry can be interpreted as a graph; for each dictionary entry we visualize the ten genes with highest betweenness centrality. Genes involved in edges specific to each dictionary entry are enriched for different GO processes consistent with their respective stages of development. Two additional dictionary entries found in fewer pan-resolution clusters are shown in Supplementary Fig. 2.
If instead we use gene expression to learn two-dimensional visualizations of these datasets, either by plotting the cells themselves or by plotting pan-resolution clusters using average gene expression, the datapoints show large amounts of structure corresponding to both study of origin and neuronal subclusters, without conveying any continuous developmental structure (Supplementary Fig. 1). Study-specific and subcluster-specific structure is also present after applying existing integrative algorithms based on mutual nearest neighbors matching9 (Scanorama) or on learning a latent space parameterized by a variational autoencoder14 (scVI) (Supplementary Fig. 1); these methods are representative of many others also based on nearest neighbors matching10–12 or on learning a joint latent space13,15. Visualization and analysis that conveys such structure is not necessarily undesirable and may be useful in many cases, especially when analysis is limited to a single scRNA-seq experiment. However, in cases when we seek higher order, systems-level patterns spanning multiple datasets, such as those generated across a consortium of institutions, we find that coexpression provides a naturally unified and much more advantageous space.
Interpretation of coexpression landscape yields insight into neuronal development
A notable advantage of analysis in coexpression space is our ability to gain systems-level insight into processes occurring throughout neuronal development from embryo to adult. Like methods for clustering cells in the gene expression setting, we can facilitate interpretation by clustering coexpression matrices that share similar structure and analyzing each cluster’s unique, representative patterns. We leverage a technique known as dictionary learning to discover consistent patterns across many coexpression networks. Dictionary learning across covariance matrices has been successfully applied to diverse problems, including information retrieval30 and functional brain profiling31, and can be naturally extended to single cell coexpression. Dictionary learning is distinct from but analogous to methods like nonnegative matrix factorization (NMF) for finding the components underlying a set of gene expression profiles. In our dictionary learning setup, we represent each pan-resolution cluster as a sparse weighted sum of a few underlying coexpression matrices, or “dictionary entries,” each of which represents important patterns reproduced across many coexpression matrices. We found that only six basis coexpression matrices were required to achieve good reconstruction error of the full set of pan-resolution coexpression matrices (Methods). These basis coexpression matrices can also be interpreted as networks with genes as nodes and edges between genes with nonzero coexpression.
As a first interpretative step, we looked at genes involved in edges unique to each of the six basis networks; analogous to “marker gene” analysis in expression space, we can refer to this as “marker edge” analysis in coexpression space. We then looked for significant gene ontology (GO) process enrichments32 within the set of genes involved in marker edges for a particular dictionary entry, using a background set of all genes considered in our coexpression analysis (around two thousand highly variable genes; Methods). Within the embryonic portion of the coexpression landscape (Figure 2e), we observe differentiation and developmental processes like synapse organization (GO:0050808, hypergeometric test P = 9.2e-7), regulation of nervous system development (GO:0051960, P = 5.5e-6), and cell fate determination (GO:0001709, P = 1.6e-4). Late-fetal and early-postnatal development (Figure 2f,g) includes more growth-related processes including neuron projection development (GO:0031175, P = 3.4e-6) and mitotic cell cycle (GO:0000278, P = 4.5e-4). The adolescent and adult stages (Figure 2h; Supplementary Fig. 2) are enriched for a more diverse set of processes relative to the earlier stages, which includes cellular homeostasis (GO:0048878, P = 1.7e-5) and regulation of amyloid-β formation (GO:1902003, P = 3.9e-5).
We sought to further characterize our coexpression networks by scoring genes on their betweenness centrality, which is a general measure of node importance based on the number of shortest paths containing a particular node, in each of the basis coexpression networks33 (Methods). High betweenness genes of note include Bmp4 (dictionary entry 1, fetal), an important neural stem cell morphogen34; Cbln1 (dictionary entry 1, fetal), an important gene in synaptic formation35; Coro1a (dictionary entry 2, fetal/neonatal) and Snhg11 (dictionary entry 3, fetal/neonatal), both involved in axon growth36,37; and Htr2c (dictionary entry 4, adolescent/adult), which encodes the serotonin receptor (Figure 2e-h). These high-betweenness genes are more likely to be centrally located within the coexpression network or be involved in multiple gene modules; we also note that many other possible node and edge centrality measures can be applied to these networks to yield additional insights. We can also look at gene expression that is strongly associated with diffusion pseudotime in the coexpression landscape. The gene with the strongest positive correlation between expression and development is Fos (Spearman correlation of 0.75; n = 2,380 pan-resolution clusters), which encodes a well-known marker of neuronal activity38; the gene with the strongest negative correlation is Eomes (Spearman correlation of −0.51; n = 2,380 pan-resolution clusters), which encodes an important transcription factor in early neurogenesis39 (Figure 3; Supplementary Data).

Integrating scRNA-seq data across development enables a unified landscape over which we can compute correlations between gene expression and developmental pseudotime. We observe positive correlations between diffusion pseudotime, corresponding to development, with the expression of genes such as Fos and Bcan (Spearman correlation of 0.75 and 0.59, respectively; n = 2,380 pan-resolution clusters) and negative correlations with the expression of genes such as Eomes and Cxcr4 (Spearman correlation of −0.51 and −0.43, respectively; n = 2,380 pan-resolution clusters). Changes in expression of these genes over development are validated and spatially located by the Allen Developing Mouse Brain Atlas40. Images show locations and levels of gene expression intensity measured by in situ hybridization (ISH); blue-green is low, yellow-orange is medium, and red is high.
We found additional validation for the genes that had the strongest correlation with developmental pseudotime by using the Allen Developing Mouse Brain Atlas (ADMBA)40, which spatially locates the expression of around 2000 genes using in situ hybridization (ISH) experiments. Genes with the strongest associations with developmental pseudotime in our unified coexpression landscape also showed strong developmental changes in ISH-quantified transcriptional intensity in the expected direction, i.e., increasing or decreasing with development (Figure 3). Interestingly, for genes with increased expression over development, we observed earlier developmental expression in our scRNA-seq-based analysis than in the ISH data; conversely, for genes that decrease, we observed more persistent expression later in development in the scRNA-seq data than in the ISH data. Our analysis also reveals genes strongly associated with development, such as Thrsp, Isg15, and Top2a (Spearman correlation of 0.65, 0.55, and - 0.42, respectively; n = 2,380 pan-resolution clusters), that the ADMBA did not include in their list of assayed genes but may be important to include in future developmental studies. We make these correlations available as Supplementary Data, which may be of further interest to developmental biologists.
Two important parameters control the amount of information considered in our analysis and can be thought of as “smoothing” parameters. The first is the correlation cutoff parameter that controls the amount of sparsity in the underlying correlation matrices; lower values include more information in the analysis but may also introduce noisy associations and can greatly increase the computational burden. The second is the number of nearest neighbors to consider when building the graph representing the coexpression landscape, which impacts both visualization and diffusion pseudotime; considering more nearest neighbors results in a smoother trajectory. While we do introduce some smoothing into our analysis, the studies are consistently arranged according to their developmental order even as these parameters vary (Supplementary Fig. 3). We also observed that neither the sparsity nor size of the pan-resolution clusters was strongly correlated with coexpression landscape structure, as quantified by diffusion pseudotime (Spearman correlation of 0.38 and 0.19, respectively, compared to 0.80 for developmental age; n = 2,380 pan-resolution clusters), and changes to sparsity did not substantially affect the structure of our developmental landscape (Supplementary Fig. 3).
Coexpression-based developmental trajectories yields insight into hematopoiesis
We next sought to demonstrate the broad applicability of Coscape to other complex biological phenomena besides neuronal development. To this end, we analyzed the coexpression landscape of three large-scale hematopoietic datasets: 240,898 cells from bone marrow and 158,639 cells from cord blood, both generated by the Human Cell Atlas7, and 128,689 peripheral blood mononuclear cells (PBMCs)6. From these tissues, we expect to observe cells at most stages of hematopoiesis41 including hematopoietic stem cells and erythroid progenitors, mostly in the bone marrow and cord blood, to more mature lymphocytes and myeloid cells, mostly as PBMCs.
A large number of the PBMCs underwent fluorescence activated cell sorting (FACS) prior to scRNA-seq, giving us experimentally-determined proteomic labels for a subset of the data. We therefore labeled some clusters as containing a substantial amount of progenitor-associated (CD34+), myeloid-associated (CD14+), and lymphoid-associated (CD4+, CD8+, CD19+, CD56+) cell-surface marker expression (Figure 4, Supplementary Fig. 4); these labels allowed us to see which parts of the coexpression landscape were more associated with progenitor, myeloid, or lymphoid states. We applied the same dictionary-learning procedure (Methods) to the hematopoietic coexpression landscape, yielding four main dictionary entries. The first dictionary entry, which we call the progenitor coexpression network, corresponds to all of the CD34+-labeled clusters and also has high betweenness centrality scores for genes that have been previously implicated in early hematopoiesis including KIAA010142, APOE43,44, and TIMP345. Among the progenitor network-specific genes, the strongest GO enrichments are for processes like regulation of signaling receptor activity (GO:0010469, P = 5.9e-12), extracellular matrix organization (GO:0030198, P = 6.1e-7), and morphogenesis (GO:0048646, P = 3.9e-5). The second dictionary entry, which we call erythropoietic, includes high betweenness genes associated with erythrocytes like HBB46 and some genes associated with megakaryocyte-erythroid progenitors like FCER1A47 and F13A148. GO process enrichments related to this dictionary entry include negative regulation of hemostasis (GO:1900047, P = 1.1e-8), platelet degranulation (GO:0002576, P = 1.1e-4), and cell cycle (GO:0044843, P = 1.4e-4). The third dictionary entry, which we call lymphopoietic, includes all lymphoid-specific (CD4+, CD8+, CD19+, CD56+) clusters and is significantly enriched for GO processes related to lymphoid activation (GO:0051249, P = 2.4e-5), cell maturation (GO:0048469, P = 6.9e-7), and immunity (GO:006955, P = 9.1e-13). The fourth dictionary entry, which we call myelopoietic, includes the CD14+ clusters. High betweenness genes in this entry include the myeloid-specific gene LYZ49 and significant GO enrichments include immunity (GO:0006955, P = 3.0e-9), coagulation (GO:0050817, P = 1.8e-5), and response to bacterium (GO:0009617, P = 3.8e-4). We make the full set of dictionary entry gene sets and GO process enrichments available as Supplementary Data.

The coexpression landscape of immune cells from bone marrow, cord blood, and peripheral blood organizes largely according to erythropoietic, lymphopoietic, and myelopoietic lineages. Some of the PBMCs have FACS-derived labels, enabling us to place clusters with known surface markers in various regions of the coexpression landscape (also see Supplementary Fig. 3). Dictionary learning of the coexpression matrices separates the coexpression landscape into four main regions; looking at high-betweenness genes and GO process enrichments suggests that these dictionary entries correspond to the different, main stages of hematopoiesis.
Visualizing the coexpression landscape of the pan-resolution clusters reveals an organization consistent with the three main branches of hematopoiesis corresponding to erythropoiesis, myelopoiesis, and lymphopoiesis (Figure 4). Such organization has been similarly observed in the gene expression space25 and in the chromatin accessibility space50 of single studies in single tissues, but, importantly, here we instead show a unified hematopoietic landscape across three separate tissues generated by multiple laboratories. When we visualize either pan-resolution clusters or individual cells in gene expression space, we again observe much more substantial study-specific and tissue-specific structure (Supplementary Fig. 5). In contrast, coexpression finds the high-level, cross-dataset structure consistent with cellular differentiation.
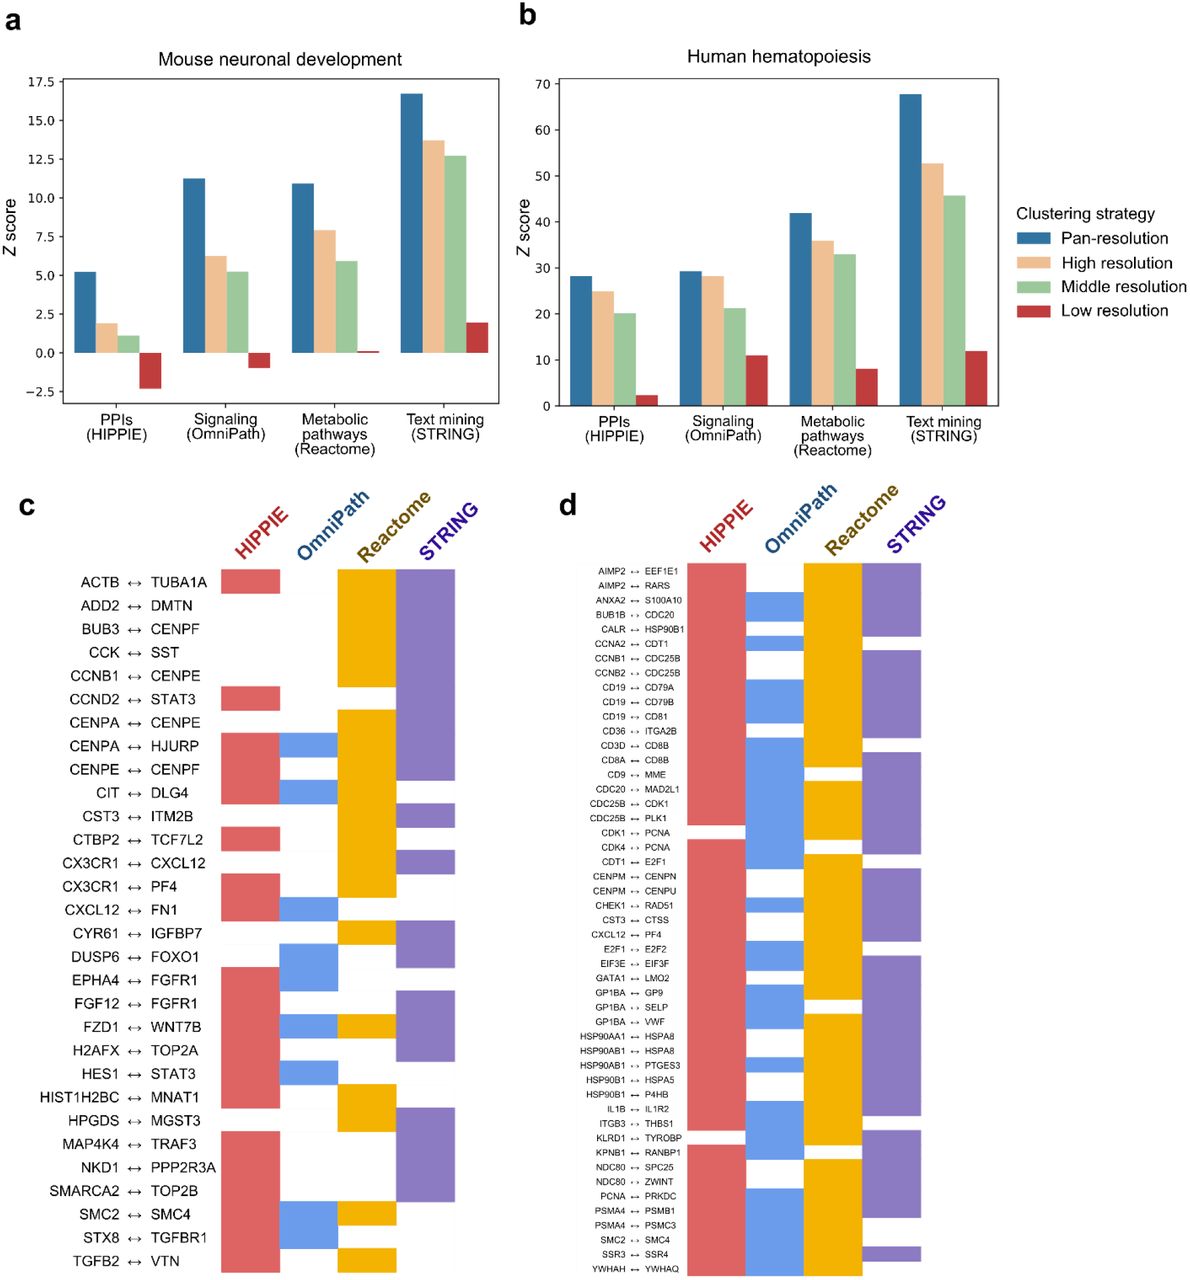
(a, b) A coexpression network learned across pan-resolution clusters has greater correspondence with other biological networks compared to that of coexpression networks learned across single-resolution clusters with a Louvain resolution parameter of 10 (“high resolution”), a Louvain resolution of 1 (“middle resolution”), or across a single “cluster” containing all cells in the dataset (“low resolution”). Z scores are computed using the number of overlapping edges between the coexpression network and a target biological network, with a null distribution of 100 random networks generated by degree distribution-preserving permutations of each of the target networks. (c, d) Rows contain coexpressed pairs of genes unique to the pan-resolution cluster setting and undiscovered by the “high resolution,” “middle resolution,” or “low resolution” methods. The pairs of genes confirmed by two or more interactions from other data modalities are shown for the neuronal development study (c) and pairs of genes confirmed by three or more interactions are shown for the hematopoiesis study (d).
We also note that we observed lower amounts of erythroid and myeloid cells within the PBMC dataset due to transcriptional quiescence and that, in general, the number of clusters does not necessarily reflect the “true” in vivo proportion of the various cell lineages. However, by combining information across multiple tissues and hundreds of thousands of cells, we are able to obtain a more complete view of the hematopoietic coexpression landscape.
Coexpression across pan-resolution clusters has greater correspondence with other known gene-gene associations
While coexpression dictionary learning across many pan-resolution clusters highlighted a wealth of biologically relevant genes, we looked to assess if the interactions captured by our analysis also had any additional biological support, as well as if our particular pan-resolution clustering strategy provided any advantage in uncovering biologically important interactions over simpler baseline techniques. More specifically, because pan-resolution clustering discovers associations across many resolutions which may not be discovered otherwise, we reasoned that our coexpression networks might also have greater overlap with real gene-gene associations.
We therefore leveraged an existing strategy23 for determining the functional quality of a coexpression network based on the intuition that a coexpression network with high correspondence to other functional interaction networks also captures more biologically relevant information. We obtained four networks representing protein-protein interactions (PPIs), cellular signaling networks, metabolic pathways, and text-mining cooccurrence (Methods) from Skinnider et al.23. We assessed overlap significance using a standard permutation-based procedure in which the four interaction networks were randomized (while controlling for the degree distribution) to construct the respective null distributions of overlap. We used the union of the dictionary entries learned across pan-resolution clusters as the coexpression network representative of our approach since we wanted to consider any evidence of a real gene-gene interaction throughout our entire analysis. As baselines, we computed (1) the coexpression network from the union of dictionary entries learned across single-resolution clusters and (2) the coexpression network learned by concatenating all cells across all studies (Methods). In all networks, an edge was added if and only if a gene pair had nonzero coexpression.
Consistently, across all four networks and both of our large-scale data collections, pan-resolution clustering had higher overlap with other biological networks than the two baselines (Figure 5a,b). We reasoned that this result is due to more discoverable gene-gene interactions (as captured by coexpression) within the pan-resolution setting because coexpression changes in strength with clustering resolution16,24. We also note that this result is not limited to the multistudy integration setting but can, in principle, also increase discovery of coexpressed genes within a single study. Many gene-gene interactions are discovered via pan-resolution clustering but not by lower resolution methods (Figure 5c,d). For example, in the neuronal development datasets, a coexpression association between Fzd1 and Wnt7b is uniquely found by panclustering with additional support from all four other biological interaction networks; this pair of genes is a part of the canonical Wnt pathway and the particular interaction has been implicated in both neuronal differentiation and amyotrophic lateral sclerosis in mice by previous studies51,52.
Coscape is practical for datasets with millions of cells
To enable consortium-scale analysis, we designed our algorithm for scalability to large numbers of cells. When designing our pipeline, our algorithmic choices are meant to balance model complexity and scalability. For example, we choose to sparsify our coexpression matrices using a nominal cutoff rather than the memory intensive strategy of preserving dense correlation matrices or the runtime intensive strategy of learning sparse covariance matrices via regularization53 (Supplementary Table 1, also see Discussion).
We performed all of our analyses in a practical amount of computational time and resources. Our entire coexpression-based procedure, which includes pan-resolution clustering through downstream analysis of the coexpression landscape, analyzes almost a million cells in a little over an hour on a standard cloud instance with 16 cores and a peak memory usage of 93.1 gigabytes (GB) (Supplementary Table 2; Methods). Our pipeline has a runtime and memory usage with a close-to-linear asymptotic scaling in the number of cells and a worst-case quadratic asymptotic scaling in the number of features (i.e., genes), but which is efficient in practice by taking advantage of sparsity (Supplementary Table 1). Once the data has been summarized as pan-resolution clusters, further downstream analysis including visualization, pseudotime assignment, and dictionary learning becomes extremely efficient due to the greatly reduced number of datapoints; in the case of mouse neuronal development, analysis is done on just 2,380 pan-resolution clusters instead of 932,301 single-cells. The resource requirements for different stages of our analytic pipeline on the mouse neuronal development analysis are provided in Supplementary Table 2.
Discussion
Our work shows that researchers can analyze an unprecedented amount of information across scRNA-seq studies by focusing on the coexpression matrix of a group of cells as the fundamental unit of analysis. Within this coexpression-based paradigm, Coscape introduces several key procedures: panclustering, which enables us to compute coexpression at multiple resolutions and reduces the amount of datapoints involved in the analysis; dictionary learning for identifying common patterns across many coexpression networks; and visualization of the coexpression landscape via a force-directed embedding of the coexpression matrix nearest-neighbors graph. Moreover, Coscape favors strong associations reproduced across many clustering realizations and studies, reducing the influence of noisy outliers.
While a large amount of recent work has focused on techniques for integrating information across multiple datasets9,10,12–15, these methods produce embeddings with values that are not directly interpretable but either only have relative meaning (for example, relative similarity to other cells in the dataset)9,10,12,13 or require a nonlinear decoder that transforms the integrated embedding into some useful statistic14,15. While these embeddings and their associated properties are useful in many contexts, reasoning about particular integrative decisions made by these algorithms, in particular in the case of over- or under-correction8, is very difficult when the final embedding values are not intrinsically meaningful. In contrast, the value of each dimension in the coexpression space is simply a bivariate correlation, a fundamental interpretive concept in biological data analysis. Distant points in coexpression space have fewer gene associations in common; closer points in coexpression space share more associations.
Another advantage of Coscape is that it naturally summarizes information over groups of cells and reduces the number of data points to consider (instead of considering all cells in expression space, analyses need only consider a smaller number of groups of cells in coexpression space). While the coexpression space may seem cumbersomely quadratic in the number of possible genes (which is usually in the tens of thousands), scRNA-seq experiments typically measure only around one or two thousand genes with nontrivial variability54; moreover, the number of meaningful correlations is sparse and usually within the same order of magnitude as the number of highly variable genes. Therefore, like data sketching55 or summarization25,56 algorithms that aim to improve scalability by capturing only the most salient features of a dataset, downstream analysis of coexpression matrices is very efficient, even on millions of cells, because a single coexpression matrix summarizes information across many cells.
Our results suggest many directions for future work. Our coexpression matrices are not positive semidefinite (PSD) for practical reasons, but efficiently learning large numbers of nontrivially sparse PSD matrices with many features is an important direction to consider. If all coexpression matrices are PSD, it may be possible to leverage the distance along the manifold represented by all PSD matrices to get more natural dictionary learning-based decompositions30 and nearest-neighbor queries (which would also involve designing new techniques for efficient nearest-neighbor search). Scalability to large coexpression matrices also remains a challenge for many approaches. This includes methods that enforce additional constraints within the dictionary learning objective (e.g., basis matrices that are PSD or valid correlation matrices) or methods for analyzing large numbers of coexpression matrices like common principal components analysis57 or other kinds of tensor decomposition58. Other considerations include exploring alternative methods for measuring coexpression23, learning coexpression modules instead of full networks, inferring causal gene regulatory networks, integrating multimodal interaction data, or exploring different clustering strategies, pan-resolution or otherwise. A larger question is whether other feature spaces exist that can take advantage of the large amount of biological data measured at single-cell resolution. While we demonstrate that coexpression as an analytic space has many useful properties including interpretability, robustness, and scalability, other spaces may exist that may work well according to the same criteria.
Coscape can also be used to newly probe many other biological systems, including pancreatic islet cells59 or lung cells60, that have been or will be deeply profiled using single cell technologies. Reasoning about the relationship between coexpression and other functional measurements of single cells, such as chromatin accessibility or methylation, also remains an important future direction. We believe the algorithms and ideas presented here provide a complementary and highly-informative way for researchers to study biological processes at single-cell resolution and at multi-institution scale. We make our analysis pipelines and data available at http://coscape.csail.mit.edu.
Methods
Mouse neuronal development dataset preprocessing
We obtained publicly available datasets from five large-scale, published scRNA-seq studies of the mouse brain at different developmental timepoints1–5. We used only the cells that passed the filtering steps of each respective study and additionally removed low-complexity or quiescent cells with less than 500 unique genes. For the embryonic dataset from Cao et al.1, we only considered cells that the study authors had assigned to the “neural tube and notochord” trajectory. For the datasets from Zeisel et al.4 and Saunders et al.5 we only considered cells that the study authors had labeled as neuronal. We then intersected the genes with the highest variance-to-mean ratio (i.e., dispersion) within each study to obtain a total of around 2000 genes that were highly variable across all studies. All studies provided data as digital gene expression (DGE) counts, which we further log transform after adding a pseudo-count of 1.
Human hematopoiesis dataset preprocessing
We obtained publicly available datasets of cord blood and bone marrow cells from the Human Cell Atlas7 (https://preview.data.humancellatlas.org/) and PBMCs from Zheng et al.6 (https://support.10xgenomics.com/single-cell-gene-expression/datasets). We removed cells with less than 500 unique genes; we also noticed a large number of cells with high percentages of ribosomal transcripts, which may indicate nontrivial amounts of ambient ribosomal RNA contamination during the scRNA-seq experiment, so we only included cells with less than 50% ribosomal transcripts in further analysis. As in the mouse neuronal dataset, we intersected the genes with the highest dispersions within each study to obtain a total of around 2000 genes that were highly variable across all studies. All studies provided data as digital gene expression (DGE) counts, which we further log transform after adding a pseudo-count of 1.
Pan-resolution clustering
We modify the Louvain clustering algorithm26,27 (implemented at https://github.com/vtraag/louvain-igraph) to store community information at each iteration. To capture a range of potential clustering results, we rerun the Louvain clustering algorithm at a diverse range of clustering resolutions (0.1, 1, and 10), storing the hierarchical cluster information for each run. The three runs of Louvain clustering are done in parallel and we cluster each study individually. To reduce the effect of noisy correlations, we consider clusters with a minimum of 500 cells, which, combined with highly variable gene filtering (described below), reduces the chance that a strong correlation is due to a few outlier cells.
Computing coexpression matrices
We compute the Pearson correlation matrix R(i) ∈ [−1,1]M×M for each of the pan-resolution clusters obtained as described above, where i ∈ [N] with N denoting the number of pan-resolution clusters and M denoting the number of highly variable genes. The entry  at row a and column b of R(i), corresponding to the ath and bth genes, takes the value
 where
where  is the Pearson correlation coefficient, and
  and
and  are the respective mean expressions. η ∈ [0, 1] is a sparsification parameter that sets low correlations to zero and can be interpreted as a smoothing parameter that preserves only the most important associations. Low values of this parameter can introduce additional structure into the analysis, but may also introduce larger amounts of noise (see Supplementary Fig. 3).
Visualization and diffusion pseudotime analysis of pan-resolution clusters
To visualize the coexpression landscape defined by the pan-resolution clusters, the symmetric correlation matrices R(i) ∈ [−1, 1]M×M are treated as vectors  on which we construct the k-nearest neighbors graph using the Euclidean distance in coexpression space as the distance metric. This graph was visualized with a force-directed embedding using the ForceAtlas2 algorithm (https://github.com/bhargavchippada/forceatlas2). For the mouse neuronal development analysis, a diffusion pseudotime (DPT) algorithm29 was applied to this graph using the pan-resolution cluster with the earlies average age as the root. Larger values of k can also increase the amount of smoothing of the structure captured by the k-nearest-neighbors graph construction and DPT analysis.
We also visualized pan-resolution clusters in gene expression space, Scanorama-corrected expression space9, and scVI-integrated latent space14. To summarize features across multiple cells into a single feature vector for each pan-resolution cluster, we use a geometric mean
 of the ath gene in pan-resolution cluster i with Ci cells, which is the same summarization strategy used by the MetaCell algorithm56. We similarly constructed the k-nearest-neighbors graph with pan-resolution clusters as nodes and Euclidean distance between the summarized gene expression values as the distance metric.
Coexpression matrix dictionary learning
We formulated the dictionary learning problem for coexpression matrices by optimizing
 where
where  is a sparse code of weights for pan-resolution cluster i, α is a sparsity-controlling parameter,
  is a dictionary of κ (vectorized) coexpression matrices, and κ is a user-defined parameter indicating the number of dictionary entries to learn. We used an iterative optimization algorithm that alternatively estimated dictionary weights and dictionary entries using a least angle regression-based procedure62 until convergence. We tune κ by plotting the objective function error versus values of κ and manually selecting a value after which there are relatively smaller drops in objective function values, a parameter selection procedure often referred to as the “elbow method.”
Interpretation of dictionary entries
We can interpret each dictionary entry Vj as a coexpression network in which genes are nodes and elements of Vj define edge weights between those genes. We identify important genes using statistics such as betweenness centrality63, which is the sum of the fraction of all-pairs shortest paths that pass through some node. We use the networkx Python package64 to compute various graph statistics. Using genes that are involved in edges that are unique to a given coexpression network, we look for gene ontology (GO) process enrichments using a background set of all highly variable genes considered in the analysis, for which P-values can be computed using a hypergeometric null model. We use the GOrilla webtool (http://cbl-gorilla.cs.technion.ac.il/)32 with default parameters, which reports all enrichments more significant than a nominal value of 1e-3. We use the REVIGO webtool (http://revigo.irb.hr/) with default parameters, which consolidates similar GO terms and visualizes terms in a two-dimensional “semantic space” that places similar terms closer together65. We limit analysis to patterns that are reproducible across many clusters and only consider dictionary entries that have nonzero weights in at least ten pan-resolution clusters.
Gene interaction network overlap analysis
We obtained four “target” gene-gene interaction networks from Skinnider et al. (2019)23, who processed interaction data from databases of PPIs, cellular signaling networks, metabolic pathways, and text mining cooccurrences. We computed the significance of overlap with coexpression networks as described in Skinnider et al. Each of the four networks was permuted to form a random graph using edge swaps to preserve the degree distribution. The number of edge swaps was ten-times the number of edges in each network. We obtained 100 random graphs for each of the four target interaction networks. We constructed four coexpression networks: the first was computed by intersecting the dictionary entries learned across pan-resolution clusters, as described above; the second and third were computed by intersecting dictionary entries learned across a single-resolution clustering (Louvain resolution parameter of 10 or 1) of the underlying data, using the same number of dictionary entries as in the panclustering analysis; and the fourth was computed as the gene-gene Pearson correlation matrix across all cells in the full dataset. For comparison with our method, all correlations that had an absolute value under 0.7 were set to zero. The number of overlapping edges between a coexpression network and a target graph was compared to a null distribution over the random graphs, which we use to compute a Z score for each coexpression network.
Runtime and memory profiling
We used Python’s time module to obtain runtime measurements and used the top program in Linux (Ubuntu 17.04) to make periodic memory measurements. We made use of default scientific Python parallelism. We benchmarked our pipelines on a Google Cloud Enterprise instance with 16 logical cores and 104 gigabytes of memory and, for memory-inefficient alternative algorithms (Supplementary Table 1), on a local 2.30 GHz Intel Xeon E5-2650v3 with 48 logical cores and 384 GB of RAM. scVI was trained on a Nvidia Tesla V100-SXM2 with 16 GB of RAM
Data Availability
We used the following publicly available datasets:
Notochord and neural plate cells from Cao et al.1 (GSE119945)
Neurons from Mayer et al.2 (GSE104158)
Neurons from Han et al.3 (https://figshare.com/articles/MCA_DGE_Data/5435866)
Neurons from Zeisel et al.4 (http://mousebrain.org/)
Neurons from Saunders et al.5 (GSE116470)
Bone marrow and cord blood cells from the Human Cell Atlas (https://preview.data.humancellatlas.org/)
PBMCs from Zheng et al.6 (https://support.10xgenomics.com/single-cell-gene-expression/datasets)
Author Contributions
All authors conceived the algorithm. B.H. implemented the algorithm and performed the computational experiments. All authors interpreted the results and wrote the manuscript.
Acknowledgements
We thank R. Chun, B. DeMeo, S. Nyquist, C. Wong-Fannjiang, and the Berger and Bryson laboratory members for valuable discussions and feedback. B.H. is partially supported by NIH grant R01 GM081871 (to B. Berger).


