

Summary
Liver X Receptors (LXRs) are important transcriptional regulators of intracellular cholesterol, fatty acid, and phospholipid levels. LXRs can dampen inflammation in macrophages by promoting cholesterol efflux and altering plasma membrane lipid rafts; microdomains enriched for cholesterol and glycosphingolipids that regulate immune-cell signalling. However, little is known about the impact of LXR activators on T cell plasma membrane lipid rafts, which are critical for T-cell antigen receptor (TCR) signalling. Here we show that the LXR synthetic agonist GW3965 significantly increases glycosphingolipid levels and reduces cholesterol and lipid order (stability) in the plasma membrane of human CD4+ T cells. Moreover, the GSL biosynthesis enzyme UGCG was identified as a novel direct target of LXR activation. Importantly, LXR-mediated changes in T cell lipid composition were associated with altered spatiotemporal distribution of lipids and signalling molecules at the immune synapse. Crucially, LXR activation altered the kinetics of proximal TCR-signalling events in activated T cells, reduced T cell proliferation and enhanced the production of IL-2 and IL-4. Thus, LXR activation influences T cell function via alteration of the plasma membrane lipid profile. Finally, the expression of UGCG and other LXR-regulated genes and lipids was significantly dysregulated in T-cells isolated from people with multiple sclerosis. Overall, a novel action of LXR has been characterised that involves modulation of lipid raft-associated cholesterol and glycosphingolipids in CD4+ T-cells, which could be of therapeutic relevance in multiple sclerosis.
Introduction
The liver-X-receptors (LXRs) LXRα (NR1H3) and LXRβ (NR1H2) are transcription factors which are activated by oxidised derivatives of cholesterol (oxysterols) (Fu et al., 2001; Janowski et al., 1996; Lehmann et al., 1997) and intermediates of cholesterol biosynthesis (Forman et al., 1997; Yang et al., 2006) to regulate gene expression. The majority of LXR target genes are involved in the metabolism of lipids. These include ATP binding cassette transporters (ABC) A1 (Costet et al., 2000; Repa et al., 2000a) and ABCG1 (Venkateswaran et al., 2000a) which efflux cholesterol from cell membranes, the inducible degrader of the LDL receptor (LDLR) (IDOL) (Zelcer et al., 2009), master regulator of de novo fatty acid biosynthesis sterol regulatory element binding protein 1c (SREBP1c, SREBF1) (Repa et al., 2000b), fatty acid synthase (FASN) (Joseph et al., 2002), and phospholipid remodelling enzyme lysophosphatidylcholine acyltransferase 3 (LPCAT3) (Rong et al., 2013).
LXRs also modulate a diverse array of immune responses through transcriptional effects on genes involved in immunity and inflammation (Pascual-García and Valledor, 2012; Steffensen et al., 2013; Waddington et al., 2015). However, to date, genome wide analyses of LXR-chromatin binding and LXR-induced gene expression in human immune cells have only been reported in macrophage models (Feldmann et al., 2013; Muse et al., 2018; Nelson et al., 2017; Pehkonen et al., 2012). This is of concern because LXR has been reported to act in a subtype specific manner (Honzumi et al., 2010; Valledor et al., 2004; Zhang et al., 2001). Whilst LXRβ is ubiquitously expressed (Repa et al., 2000b; Teboul et al., 1995), LXRα expression is restricted to metabolically active cells and tissues, including macrophages (Apfel et al., 1994; Repa and Mangelsdorf, 2000; Willy et al., 1995) but not CD4+ T cells (Bensinger et al., 2008). Thus far, LXR activation has been shown to inhibit the transcription of IL-17 in T cells via an indirect mechanism involving SREBP1c (Cui et al., 2011), and block induction of IL-9 in CD8+ T cells via transrepression of the IL-9 promoter (Ma et al., 2018). Additionally LXR ligand treatment has been reported to reduce production of pro-inflammatory cytokines (Walcher et al., 2006), inhibit migration (Walcher et al., 2010), and promote Foxp3 expression (Herold et al., 2017), although the mechanisms driving these effects remain unclear.
In certain cases, LXR activation also modulates immune cell function indirectly via effects on lipid metabolism. Indeed, perhaps the best defined effect of LXR on T cells is the inhibition of lymphocyte proliferation via induction of ABCG1-driven cholesterol efflux, likely by reducing the availability of cholesterol for membrane biogenesis (Bensinger et al., 2008). In macrophages, cholesterol efflux via ABCA1 inhibits pro-inflammatory toll-like receptor signalling by disrupting plasma membrane lipid rafts (Ito et al., 2015; Zhu et al., 2008, 2010). Lipid rafts are highly ordered cholesterol and glycosphingolipid-enriched microdomains which can selectively incorporate or exclude membrane proteins, and therefore regulate signalling complex assembly (Pike, 2006; Simons and Ikonen, 1997; Simons and Toomre, 2000). However, the effect of LXR on T cell plasma membrane lipid rafts remains unexplored, despite their well-established role in T cell activation (Klammt and Lillemeier, 2012; Wu et al., 2016).
TCR signalling was one of the first signal transduction events found to be mediated by plasma membrane lipid rafts (Simons and Ikonen, 1997). Within minutes of TCR engagement CD4+ T cell membrane undergoes extensive remodelling as the cell polarises to form an immunological synapse. Lipid rafts accumulate at the synapse (Burack et al., 2002; Janes et al., 1999; Zech et al., 2009), and facilitate the spatiotemporal distribution of signalling proteins, including lymphocyte cell-specific protein-tyrosine kinase (Lck) and linker for activation of T cells (LAT) (Janes et al., 2000). Disrupting the balance of glycosphingolipids (McDonald et al., 2014; Zhu et al., 2011), cholesterol (Mahammad et al., 2010; Surls et al., 2012; Yang et al., 2016), or fatty acids (Fan et al., 2018; Kim et al., 2008; Shaikh et al., 2012) in the plasma membrane has been shown to modulate TCR signalling and T cell function. Moreover, dysregulated lipid rafts are associated with T-cell pathogenicity in disease models of HIV (Pan et al., 2013; Simmons et al., 2005) diet-induced hypercholesterolaemia (Mailer et al., 2017), and in systemic lupus erythematosus (SLE) (Flores-Borja et al., 2007; Jury et al., 2003, 2006; McDonald et al., 2014).
Prior to this, our own work linked LXR to elevated expression of glycosphingolipids in CD4+ T cells from SLE patients (McDonald et al., 2014). Strikingly, culture of healthy T cells with serum from SLE patients induced overexpression of glycosphingolipids, and this could be inhibited by addition of an LXR antagonist. This implied that serum factors induce upregulation of glycosphingolipids in an LXR-dependent manner.
In this report, we have examined the effects on the T cell transcriptome and lipidome. Interestingly, we have discovered a novel action of LXRs on glycosphingolipid biosynthesis via transcriptional regulation of UDP-glucosylceramide synthase (UGCG). In the context of T-cell antigen receptor (TCR) stimulation, we show that LXR activation alters the distribution of lipids and signalling molecules at the immune synapse, with downstream effects on proximal TCR-signalling, cytokine production, and proliferation. Finally, we identify changes in LXR signalling in T-cells isolated from people with multiple sclerosis (MS), a chronic neurodegenerative disorder involving T-cell dysfunction (Fletcher et al., 2010) and associated with altered systemic cholesterol and oxysterol metabolism (Ďurfinová et al., 2018; van de Kraats et al., 2014; Uher et al., 2017; Zhornitsky et al., 2016).
Results
LXR activation regulates the transcription of lipid metabolic pathways in human CD4+ T cells
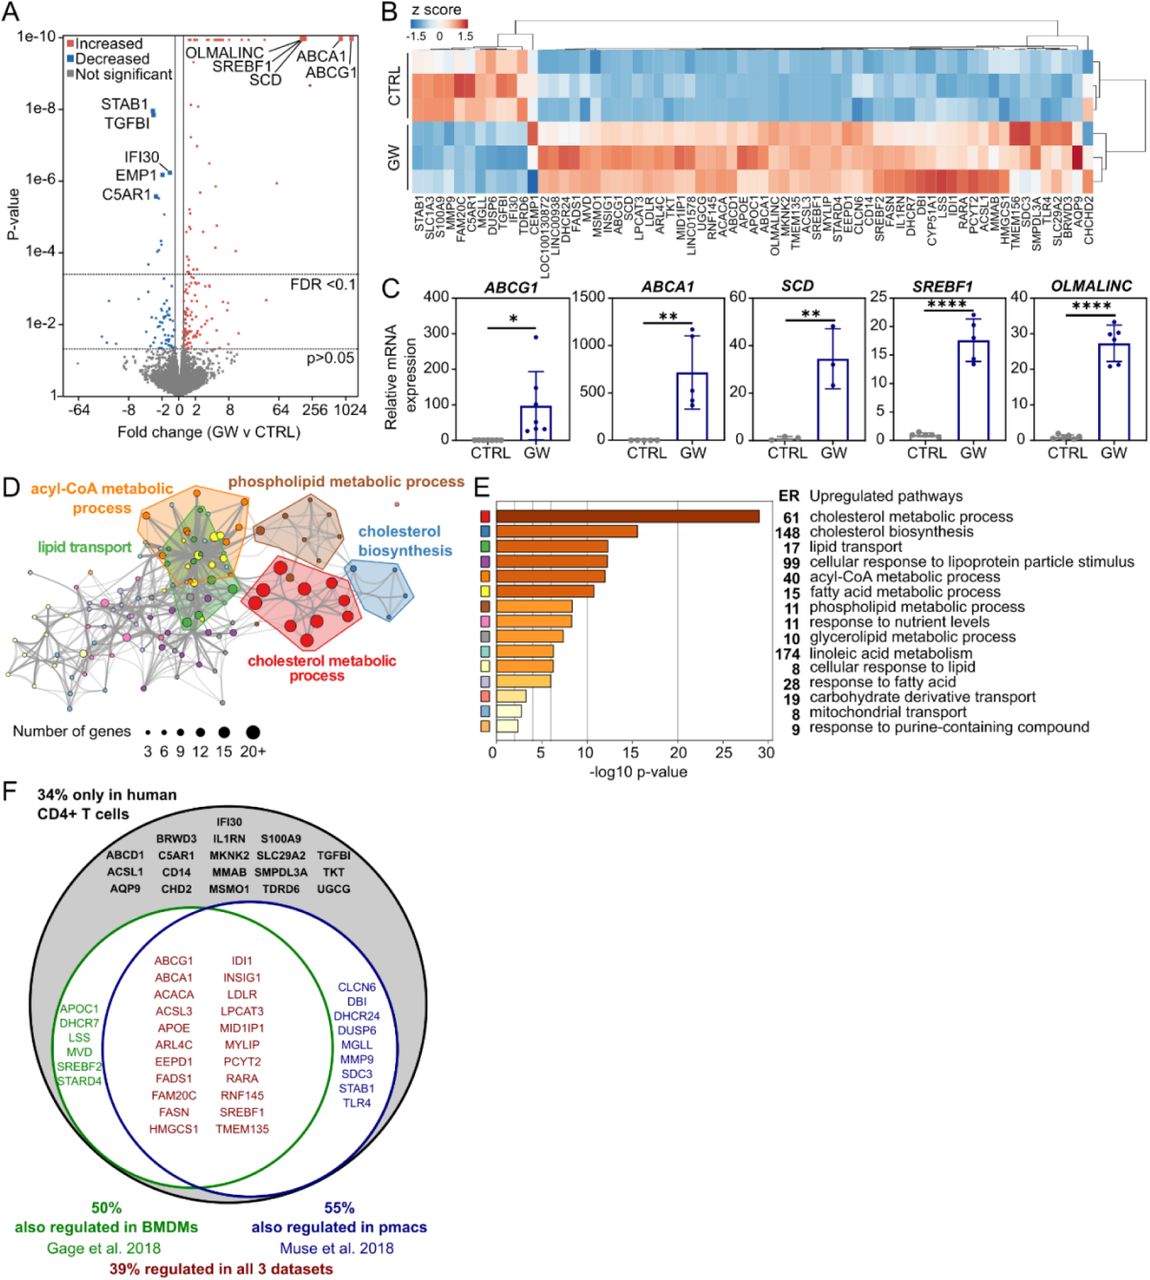
To obtain a global view of LXR function in human T cells, we used RNA-sequencing to identify genes regulated by the synthetic LXR agonist GW3965 (GW) (Collins et al., 2002). GW-treated samples are distinguishable from their controls by principal component analysis (PCA) (Figure S1A) and show 206 differentially expressed genes (DEGs) (fold change > 1.2, p < 0.05) (Figure 1A). Of these, 65 genes show statistically significant differences in expression after adjustment for multiple comparisons (Figure 1A, B) with a subset displaying a very strong ligand response (Figure 1C, S1B). These are well characterised LXR target genes (ABCG1, ABCA1, APOC1, SCD, SREBF1)(Calkin and Tontonoz, 2010), with the exception of oligodendrocyte maturation-associated long intervening non-coding RNA (OLMALINC) which to date has only been studied in brain (Mills et al., 2015) and has not been previously linked to LXR activation.

Primary human CD4+ T cells (n=3) were treated with or without LXR agonist (GW3965, GW) for 24 hours and gene expression was assessed by RNA-Seq. (A) Volcano plot showing fold changes and p-values, where coloured points represent significantly regulated genes. (B) Clustered heatmap of normalised gene counts of LXR regulated genes with adjusted p-value <0.1. (C) Regulation of a selection of genes was confirmed by qPCR in an independent set of donors (n=3-6). (D) Network diagram illustrating significantly enriched ontology terms. Similar terms with a high degree of redundancy were clustered into groups as depicted. Each node represents a significantly enriched term, with node size proportional to the number of input genes annotated with this term. (E) Bar chart plotting cluster significance annotated with enrichment ratios (ER). (F) Venn diagram showing the proportion of genes also regulated in previously published murine macrophage datasets. Bars represent the mean ± SD. Un-paired two tailed t-test; ** p < 0.01, **** p < 0.0001
Hierarchical clustering of ontology terms enriched for LXR upregulated genes yields 15 groups of enriched pathways, the most significant being ‘cholesterol metabolic process’ (Figure 1D-E). Remarkably, all 15 clusters identified are related to metabolic processes, predominantly lipid metabolism.
We were interested to identify potential T-cell specific LXR targets because, as others have shown (Bensinger et al., 2008; DiBlasio-Smith et al., 2008), the relative expression of LXR subtypes differs greatly between monocytes/macrophages and T cells (Figure S1C-D). Notably, LXRα mRNA and protein are negligible in T cells (Figure S1C-D). Furthermore, in monocytes/macrophages LXRα regulates its own expression via an autoregulatory loop (Laffitte et al., 2001) but this does not occur in T cells (Figure S1E). These differences could lead to cell-type specific responses to LXR activation. We cross-referenced our list of DEGs with publically available RNA-seq data from murine macrophages treated with GW (Gage et al., 2018; Muse et al., 2018). Almost 40% of genes are expressed in all three datasets, including well-characterised LXR targets such as ABCA1, ABCG1 and SREBF1 (Figure 1F). Interestingly, 34% of targets appear to be unique to the T-cell dataset. Because of the different species interrogated, some of these could be bona fide T-cell specific targets and some could be due to species differences; for example SMPDL3A has already been reported to only be regulated in human but not murine macrophages (Noto et al., 2012).
Thus, we have identified genes responsive to LXR activation in human CD4+ T cells, including genes not previously associated with LXR activation. Overall the predominant pattern was the upregulation of genes involved in lipid metabolism.
LXR activity regulates intracellular and plasma membrane lipid composition
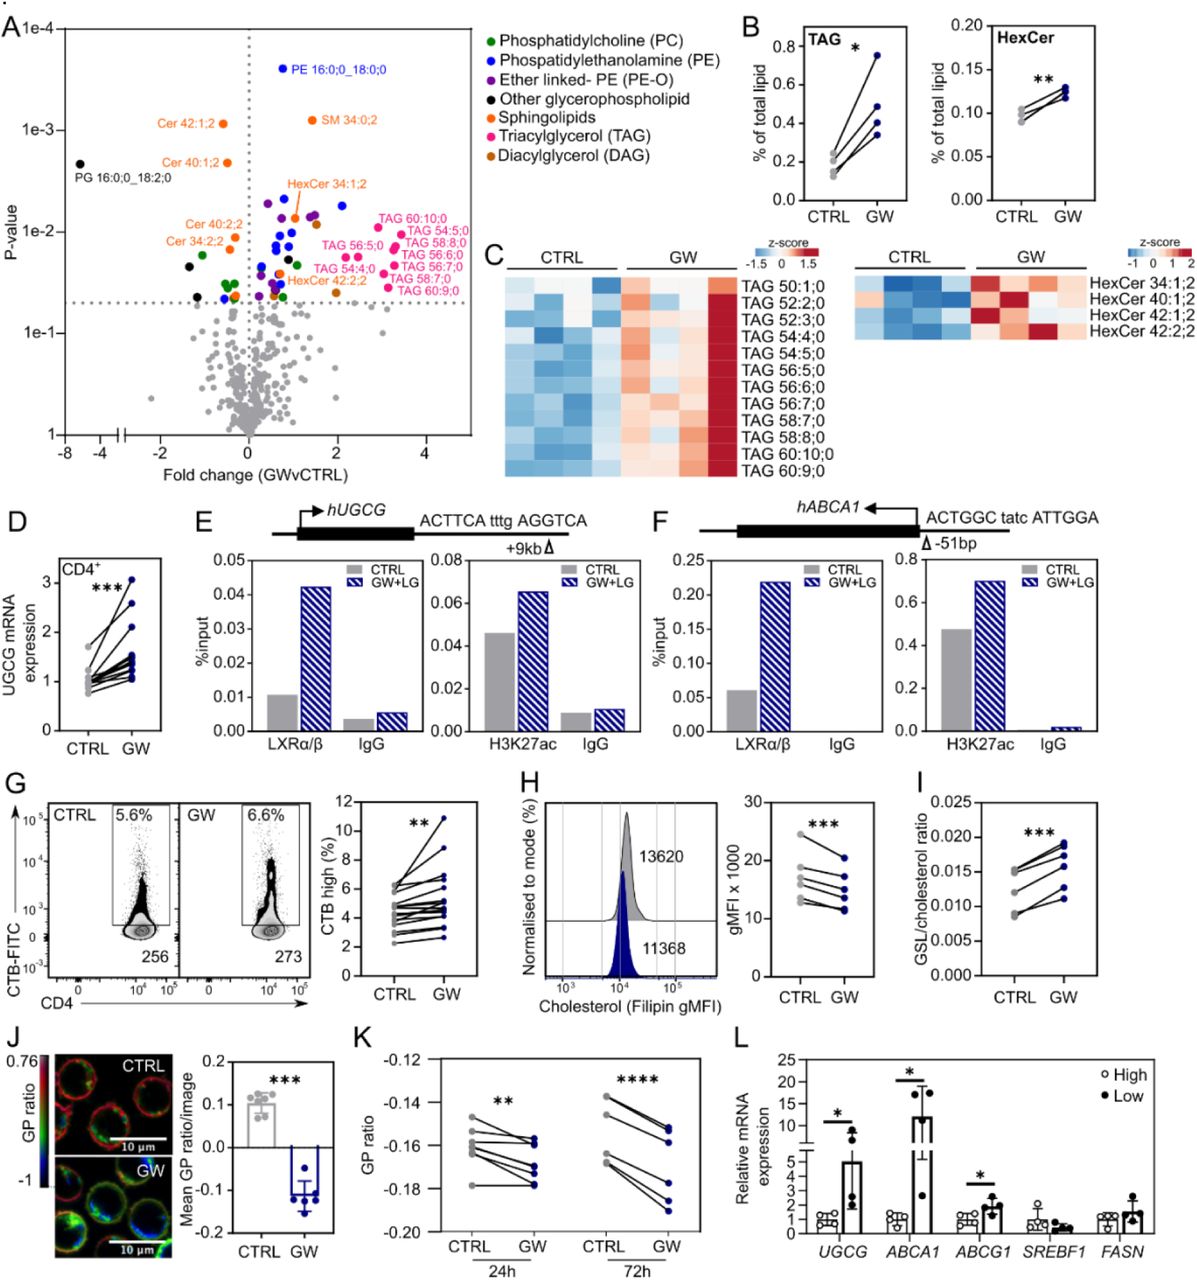
Next, we interrogated the impact of LXR activation on T-cell lipid content using lipidomic analysis. GW stimulation does not alter total lipid levels (Figure S2A), however, 15% of lipid subspecies analysed (54 out of 366) are significantly regulated by LXR activation (p < 0.05) (Figure 2A). Notably, a large proportion (>50%) of triacylglycerol (TAG) and hexosylceramide (HexCer) subspecies are induced in response to LXR activation (Figure 2B, S2B), resulting in increased overall levels both in terms of relative (mol % of total lipid) and absolute (pmol) quantities (Figure 2C, Table 1). Furthermore, GW promotes the decrease of several ceramides, suggesting an increased conversion of ceramide to HexCer, a reaction catalysed by UDP-glucosylceramide synthase (UGCG) or UDP-glycosyltransferase 8 (UGT8) (Figure S2C). Interestingly, UGCG mRNA expression is upregulated by LXR activation, whereas UGT8 is not expressed in CD4+ T-cells (Figure 2D, S2D). Additionally, GW treatment enhances UGCG expression in other immune cells including peripheral blood mononuclear cells (PBMCs) (Figure S2E), purified CD14+ monocytes, CD19+ B cells, and monocyte-derived macrophages (Figure S2F).

(A-C) Primary human T cells (n=4) were treated ± GW for 36 hours and cellular lipid content analysed by shotgun lipidomics. (A) Volcano plot represents significant changes in the expression of lipid sub-species, colour coded by broader lipid class (p<0.05). (B) Dot plots show overall change in triacylglycerol (TAG) and hexosylceramide (HexCer) levels. (C) Unclustered heatmaps represent levels of individual sub-species. (D) UGCG mRNA expression by qPCR in CD4+ T cells after 24 hours ±GW (n=13). (E-F) Cells were treated with an LXR (GW) and RXR (LG100268 or LG) ligand for 2 hours. (E) LXR occupancy and H3K27 acetylation at the putative DR4 motif confirmed by ChIP-qPCR. (F) As in E with the ABCA1 LXRE as a positive control. (G-I) Cells were cultured ± GW for 24 hours and CD4+ T cell plasma membrane lipid expression was examined. (G) Representative flow cytometry plots annotated with percentage cells highly expressing cholera toxin B (CTB) and CTB gMFI as a surrogate marker for glycosphingolipids (GSLs) as in (McDonald et al., 2014). Cumulative data shows change in percentage of cells highly expressing CTB. (H) Representative histogram of filipin staining for cholesterol, and cumulative data showing change in filipin (gMFI). (I) Cumulative data showing ratio of GSLs to cholesterol as CTB to filipin (n=6). (J) Membrane order was visualised after 72 hours using di-4-ANEPPDHQ (ANE) (n=1). Representative confocal microscopy images and a histogram of average generalised polarisation (GP) ratio per image analysed are shown. (K) Cumulative data showing the change in GP ratio of T cells (n=6) after 24 or 72 hours with GW, as determined by flow cytometry. (L) ANE-stained CD4+ T cells (n=4) were sorted into high or low membrane order by FACS, and gene expression was assessed by qPCR. Paired (B-I, K) or unpaired (J, L) two-tailed t-test; * p < 0.05, ** p = 0.05, *** p < 0.001.
CD3+ T cells were cultured ± GW3965 (GW) for 36 hours and lipids were quantified by shotgun lipidomics. Lipid concentrations (pmol) were normalised to sample cell number and expressed as a percentage of the total lipid content. Samples were compared by a paired two-tailed t-test; p-values less than 0.05 are shown in bold.
The relationship between UCGC and LXR was explored in more detail. In silico DNA motif analysis identified a potential LXR response element (LXRE) sequence in the vicinity of the UGCG gene (Figure 2E). When tested by ChIP-qPCR, we observed enrichment in LXR occupancy at this site, which is increased by ligand activation (Figure 2E). Likewise, acetylation of H3K27 was enriched at this region, suggesting this is an active transcriptional enhancer (Figure 2E). The observed LXR occupancy at the UGCG gene follows a similar pattern to that of a reported LXRE within the canonical LXR target ABCA1 (Costet et al., 2000; Ignatova et al., 2013) (Figure 2F).
UGCG is the rate limiting enzyme for the biosynthesis of glycosphingolipids (Figure S2C), which together with cholesterol are important lipid components of the plasma membrane that can influence membrane order (stability) (Miguel et al., 2011). In line with upregulation of UGCG mRNA, LXR activation consistently upregulates glycosphingolipid expression (Figure 2G), as we previously reported (McDonald et al. 2014). This is accompanied by significant downregulation of membrane cholesterol (Figure 2H), likely due to the strong induction of cholesterol efflux transporters ABCA1 and ABCG1 (Figure 1C), as previously reported in murine and human macrophages (Ito et al., 2015; Rigamonti et al., 2005; Venkateswaran et al., 2000b), and Jurkat T cells (Jiang et al., 2012). Overall, the ratio of glycosphingolipids to cholesterol is significantly increased by LXR activation (Figure 2I). This leads to a reduction in membrane order, quantified by the polarity-sensitive probe di-4-ANEPPDHQ (ANE) (Owen et al., 2012; Waddington et al., 2019) (Figure 2J-K). Indeed, low order cells show higher expression of LXR target genes that influence plasma membrane lipids – namely ABCA1, ABCG1 and UGCG – whereas genes involved in fatty acid biosynthesis remain unaltered (SREBF1, FASN) (Figure 2L). This suggests endogenous LXR activity relates to lower membrane order in T cells.
LXR activation alters responses to T cell antigen receptor signalling
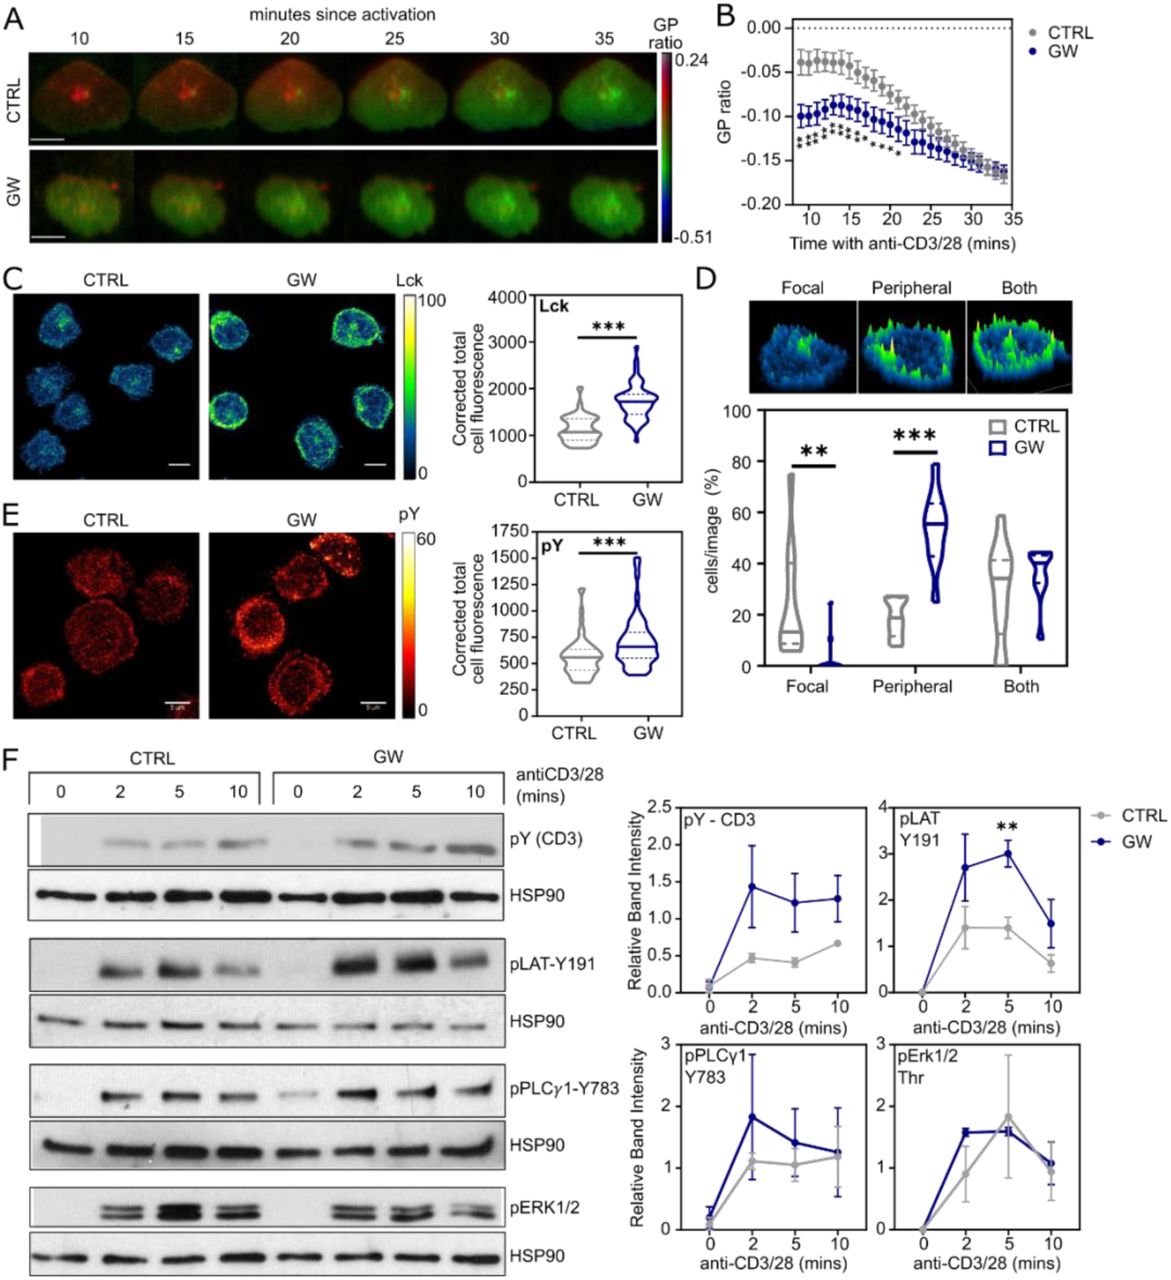
In activated T cells, membrane order is related to the stability of the immune synapse - lower order is associated with a smaller, more transient synapse and TH1 functional phenotype (Miguel et al., 2011). We used ANE-staining to quantify the kinetics of lipid reorganisation at the ‘synapse’ between CD4+ T cells and antibody-coated glass coverslips (Figure 3A). Cells treated with GW have a significantly lower generalised polarisation (GP) ratio up to 20 minutes post-activation (Figure 3B). In addition, GW promotes Lck receptor tyrosine kinase levels at the synapses (Figure 3C) and a preference for Lck to accumulate at the synapse periphery (Figure 3D), typically associated with active signalling (Varma et al., 2006). Global phosphotyrosine expression at the T cell/coverslip interface is also increased in response to LXR activation (Figure 3E). Specifically, we found GW treatment increases phosphorylation of CD3 and the adaptor molecule LAT (Figure 3F), but not Erk or PLCγ1. Together, these data suggest LXR activation alters the distribution of lipids and signalling proteins at the immune synapse, with effects on proximal TCR signalling.

(A-F) CD4+ T cells were cultured +/− GW for 48 hours before addition to chamber slides coated with anti-CD3/28 for immune synapse formation. (A-B) T cells were stained with di-4-ANEPPDHQ and immune synapse formation was recorded for 30 minutes using TIRF microscopy. (A) Representative images at 5 minute intervals, scale bar = 5 μM. (B) GP ratio was quantified at each minute (n= 10-12 cells/condition). (C-E) Immune synapses (n=2 donors) were fixed at 15 mins post activation and immunostained for Lck (C-D: CTRL=68 cells, GW=52 cells) and phosphotyrosine (E: CTRL=59 cells, GW=52 cells). Representative images and quantification of corrected total cell fluorescence (CTCF) (C, E) or classification of Lck distribution patterns (D). (F) Signalling protein phosphorylation after 2, 5 and 10 minutes of TCR engagement by Western blotting. Band intensities relative to HSP-90 were calculated for 2-3 independent experiments (n=2-4). Violin plots show median and quartile values, and line graph shows mean +/− SEM. Multiple unpaired t-tests corrected for multiple comparisons (B), Mann Whitney U (C-E), or unpaired t-test two-tailed (F); * p < 0.05, ** p < 0.01, *** p < 0.001. Abbreviations: Lck – lymphocyte-specific protein tyrosine kinase; pY – phosphotyrosine; CD3 – cluster of differentiation 3; LAT – linker for activation of T cells; PLCγ – phospholipase Cγ1; Erk – extracellular signal related kinase; HSP90 – heat shock protein 90.
As well as influencing early TCR-mediated responses, LXR activation also increases the production of IL-2 and IL-4, both the percentage of cytokine-producing cells and amount of cytokine produced per cell (Figure 4A, B). In contrast, there were no statistically significant changes in the percentage of cells producing IFNγ, TNFα or IL-10 (Figure S3A). Furthermore, in line with previous reports (Bensinger et al., 2008; Zhang et al., 2016), CD4+ T cell proliferation is significantly reduced in cells exposed to the LXR ligand (Figure 4C-D, S3B). These changes were associated with modified plasma membrane lipid composition after TCR stimulation, with LXR activation enhancing TCR-induced upregulation of glycosphingolipids but inhibiting the upregulation of cholesterol (Figure 4E-F). Therefore, LXR activation continues to modulate plasma membrane composition throughout the course of activation.
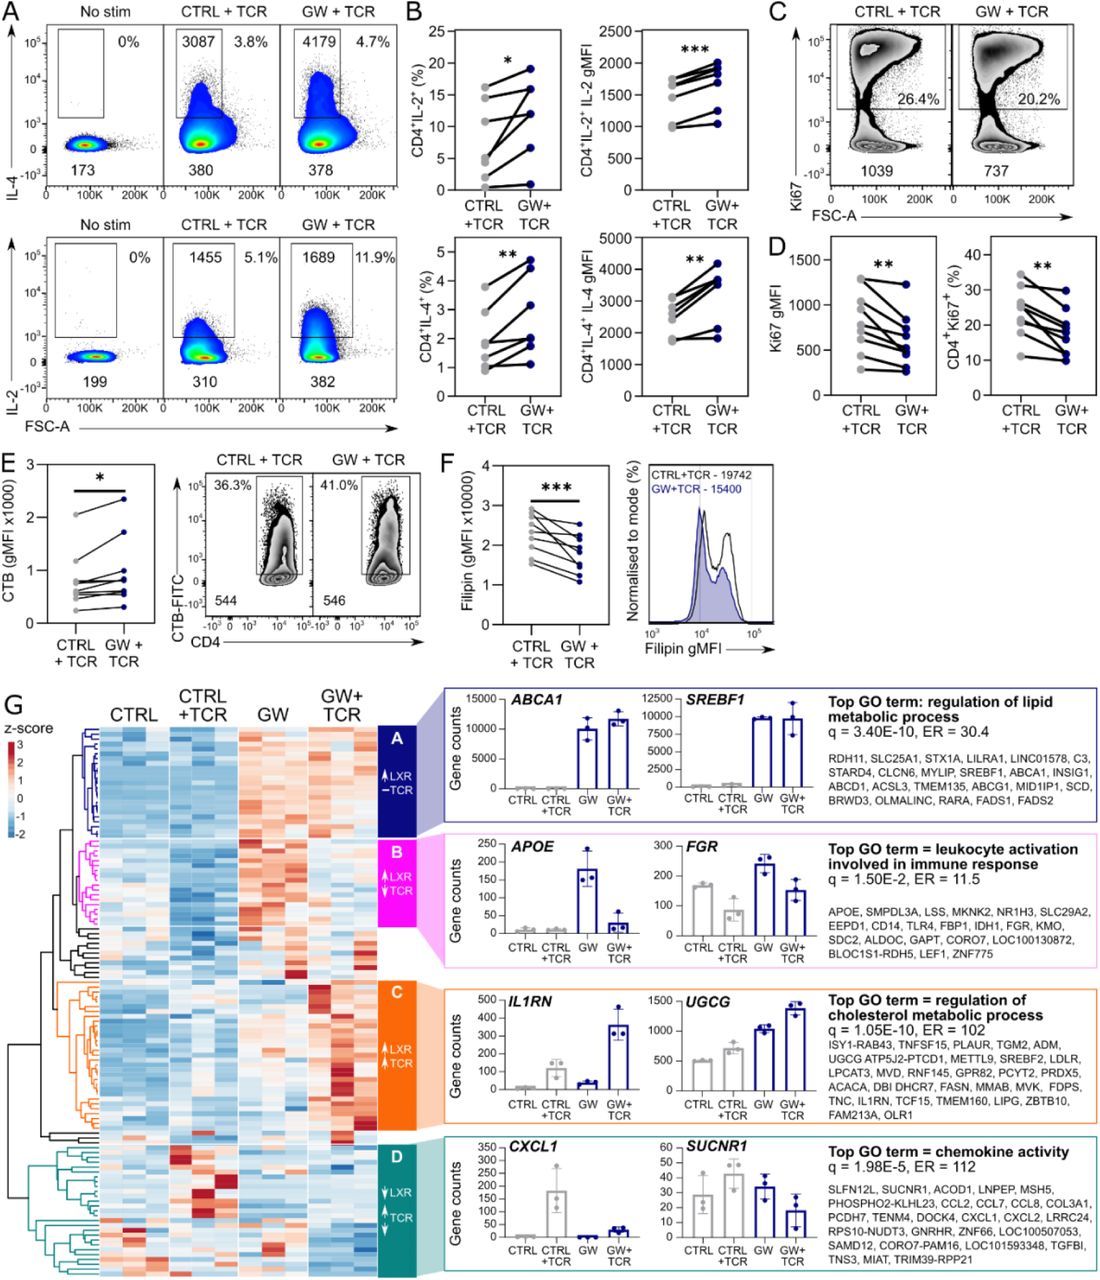
(A-G) CD4+ T cells (n=7) were activated with anti-CD3/CD28 (1 μg/ml) for 72 hours ± GW. (A-B) Intracellular cytokines were analysed by flow cytometry after additional treatment with PMA (50 ng/mL), ionomycin (250 ng/mL) and GolgiStop for 5 hours. (A) Representative flow cytometry plots labelled with percentage of positive cells and geometric mean fluorescence intensities (gMFI) of both the cytokine-producing population and whole population are shown. (B) Cumulative data from three independent experiments shows percentage of cytokine producing cells, and the gMFI of the cytokine-positive population. (C-D) Expression of proliferation marker Ki67 was analysed by flow cytometry. Representative flow cytometry plots and cumulative data from four independent experiments are shown. (E-F) Changes in plasma membrane GSL (E) and cholesterol (F) content of CD4+ T cells (n=5– 9) were assessed by flow cytometry using cholera toxin B (CTB) and filipin, respectively. Cumulative data from 4 independent experiments is shown, with representative flow cytometry plots. (G) CD4+ T cells (n=3) were treated with or without GW (2 μM) before TCR stimulation with anti-CD3/CD28 with the continued presence of GW or control. Samples were analysed by RNA-seq. Four patterns of gene expression (clusters A-D) were identified amongst differentially expressed genes by hierarchical clustering of normalised gene counts. Histograms of counts of two representative genes from each cluster are displayed, as well as the most significantly enriched gene ontology (GO) term and the genes in the cluster annotated with the term. Paired two-tailed t-tests; * p < 0.05, ** p < 0.01, *** p < 0.001.
Transcriptomic analysis showed that over 3000 genes are significantly regulated by TCR activation, but the majority of these are regulated irrespective of the presence of GW (Figure S3C). Likely more subtle differences do not reach statistical significance due to the heterogeneity in response to stimulation between the healthy donors. This is evident from the much greater spread of the stimulated points compared to unstimulated on a PCA plot (Figure S3D). Yet, there are 113 DEGs between T cells activated in the presence or absence of GW in TCR-activated cells (Figure S3E-F). Clustering of these 113 genes based on their expression in both activated and resting cells reveals 4 major patterns of expression (Figure 4H). Many genes upregulated by GW in resting cells were upregulated to an equal or greater extent in GW/TCR co-activated cells (clusters A and C, Figure 4G). These clusters are enriched for genes involved in lipid and cholesterol metabolic processes, including canonical LXR target genes ABCA1 and SREBF1. In contrast, GW/TCR co-stimulation reduces the induction of a subset of genes involved in leukocyte activation (cluster B, Figure 4G). Interestingly, some genes were only or mostly activated (cluster C) or repressed (cluster D) by LXR activation in the context of TCR stimulation. Therefore, crosstalk between LXR and TCR stimulation modulates transcription in a gene-specific manner. Overall, the most significantly enriched functional terms relate to the upregulation of genes involved in lipid metabolic processes (Figure S3G), suggesting this may be the dominant mechanism by which LXR regulates T–cell function rather than direct effects on immune-related genes.
Plasma membrane lipid metabolism is dysregulated in T cells from people with multiple sclerosis
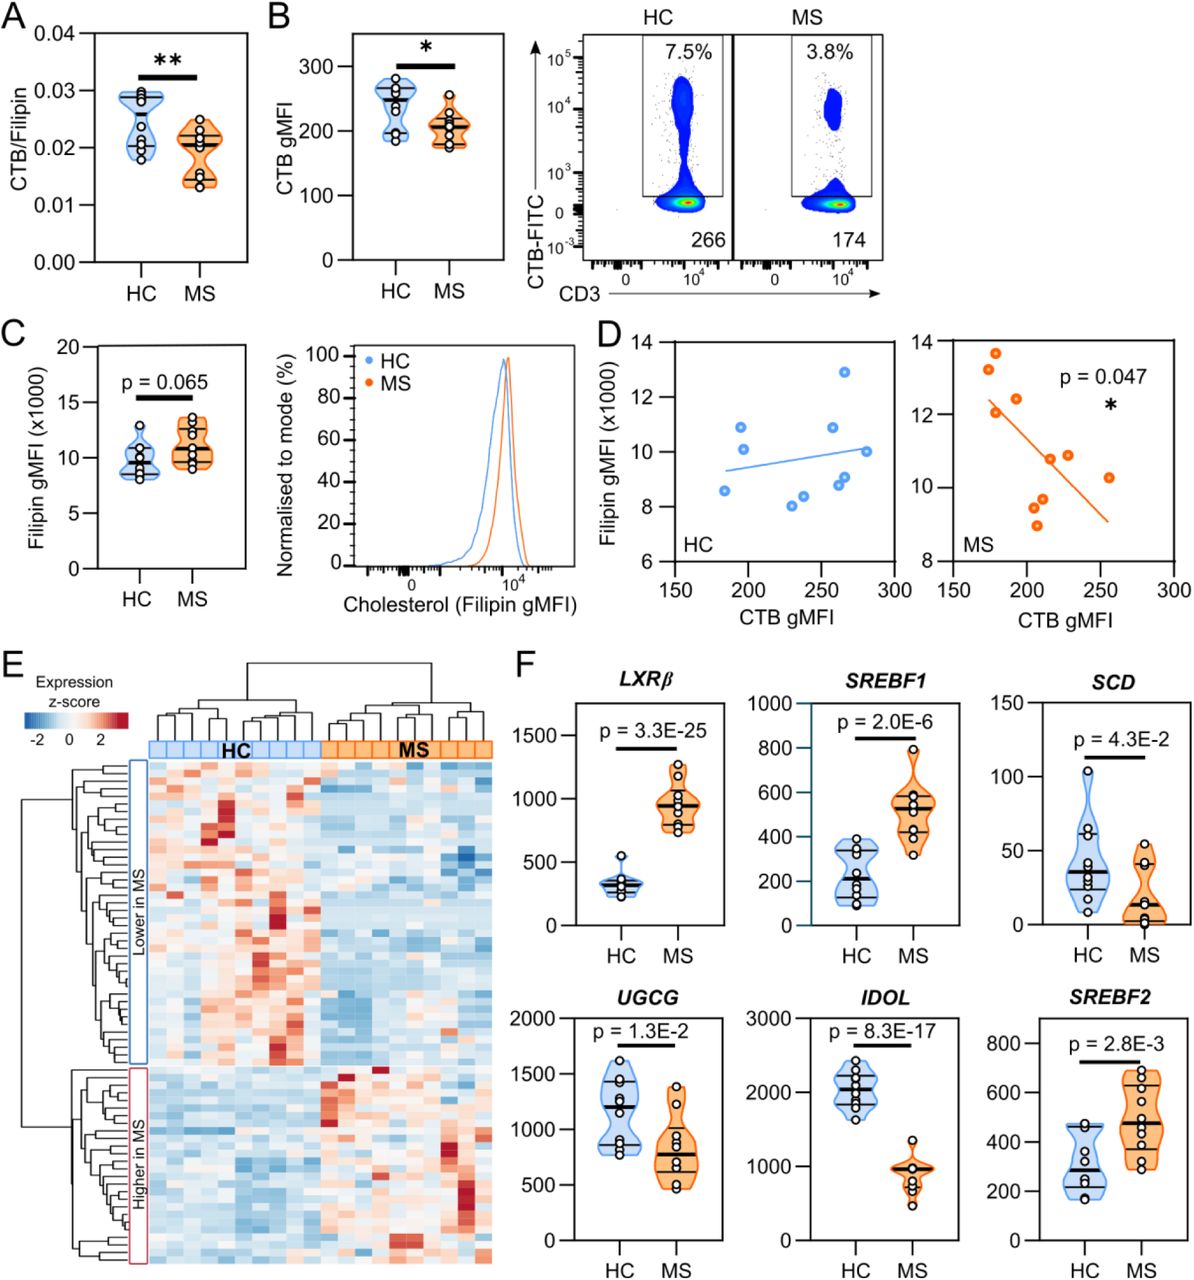
In view of our findings, we next examined whether LXR-regulated membrane lipids in these cells could be disrupted in diseases involving T cell dysfunction and altered lipid homeostasis, such as multiple sclerosis (MS) (Cermenati et al., 2013; Fletcher et al., 2010; Goverman, 2009; Zhornitsky et al., 2016) (refer to Table S1 for demographic information). Indeed, the ratio of glycosphingolipids to cholesterol in the plasma membrane was significantly lower in T cells isolated from people with MS compared to healthy controls (HCs) (Figure 5A). This was mainly caused by a decrease in the expression of glycosphingolipids (Figure 5B), and a trend towards increased cholesterol levels (Figure 5C). No differences in the proportion of CD4+ T cells (Figure S4A) or distribution of functional T cell subsets (Figure S4B) were observed between MS and HCs, and the differences in glycosphingolipid and cholesterol expression were conserved amongst all the T cell subsets (Figure S4C-D). Furthermore, while no correlation exists between T cell glycosphingolipid and cholesterol levels in HCs, a negative correlation is seen in T cells from people with MS (Figure 5D) suggesting an altered relationship between these lipid species specific to MS. Neither glycosphingolipid nor cholesterol levels correlate with age, BMI, vitamin D levels, EDSS score or number of relapses (all p > 0.23, Table S2).

(A-D) Cells from healthy controls (HC; n=10) or people with MS (MS; n=10) were stained with cholera toxin B (CTB) and filipin to measure CD4+ T cell expression of GSLs and cholesterol, respectively, in four independent experiments. Cumulative data shows (A) the ratio of CTB and filipin gMFI, (B) CTB gMFI with representative flow cytometry plots and (C) filipin gMFI with representative histogram. (D) Correlation of CTB and filipin levels in HC (blue) and MS (orange). (E) CD4+ T cells from HCs (n=10) and people with MS (n=10) were analysed by RNA-seq. Clustered heatmap shows expression of GW-responsive genes which are significantly different between HCs and MS. (F) Violin plots show normalised gene counts for regulated genes of interest. Violin plots show median and interquartile range. Unpaired two-tailed t-test (A-C); * p = 0.026, ** p = 0.009, or Pearson’s correlation (D).
We next performed RNA-seq on ‘ex vivo’ CD4+ T cells isolated from HCs and people with MS and compared the expression of the genes we identified as regulated by LXR ligand treatment in resting or activated T cells from healthy donors (Figures 1A, 4G). Overall 26% (66 out of 256) of LXR responsive genes are differentially expressed in T cells from people with MS, and unsupervised clustering of these genes can distinguish HCs from people with MS (Figure 5E). LXRβ levels are almost tripled in MS (Figure 5F), although as a ligand-dependent transcription factor this does not necessarily mean LXR is more active in this condition. Indeed, some LXR responsive genes are increased, with more being reduced, and others remained unchanged in MS including classic LXR target genes ABCA1 and ABCG1 (Figure S4E). This suggests LXR target gene expression is altered in a gene-specific manner. Amongst the differentially regulated genes were several known to regulate the metabolism of lipids, including fatty acids (SREBF1, SCD), cholesterol (SREBF2, IDOL) and glycosphingolipids (UGCG) (Figure 5F). The decreased expression of glycosphingolipid biosynthesis enzyme UGCG is consistent with the reduction in glycosphingolipid expression (Figure 5B). Decreased expression of the inducible degrader of the LDLR receptor IDOL may be implicated in increased cholesterol uptake, whereas elevated SREBF2 levels could boost cholesterol biosynthesis, both of which would contribute to the modest increase observed in plasma membrane cholesterol (Figure 5C).
Interestingly, a recent report showed that genes controlling cholesterol metabolism are dysregulated in the brains of people with MS (Voskuhl et al., 2019), consistent with our finding in circulating T cells. We next compared the genes reported to be differentially regulated between HC and MS in 6 regions of the brain with our list of LXR-responsive genes identified in T cells (Figure S4F). Intriguingly, differences in LXR regulated genes occur in 2 out of 6 brain areas; the corpus callosum and optic chiasm. Fold changes of these genes are represented as a clustered heatmap with the difference observed in T cells for comparison (Figure S4F). Although most genes did not share their expression pattern between tissues, a subset of genes was regulated in all three (Figure S4G), including the UGCG gene identified in this study to be a novel LXR target. This suggests glycosphingolipid metabolism may be important in both circulating T cells and within the brain of people with MS.
Overall, we have shown that LXR-responsive genes and lipids are dysregulated in T cells from people with MS.
Discussion
Increasingly, it is recognised that lipid metabolism is an important modulator of T cell function. Cholesterol levels have been shown to regulate proliferation (Bensinger et al., 2008; Kidani et al., 2013), TCR signalling (Swamy et al., 2016; Yang et al., 2016), and cytokine production (Ma et al., 2018), and fatty acids play an essential role during early TCR signalling (Angela et al., 2016). Although LXR activation has been shown to modulate plasma membrane lipid order in murine macrophages, fibroblasts and enterocytes (Hashidate-Yoshida et al., 2015; Ito et al., 2015), this remained unexplored in T cells. Here we have comprehensively assessed the action of LXR in human CD4+ T cells using transcriptomic and lipidomic analyses combined with cell biology plasma membrane-focused approaches. Our findings revealed a novel regulation of glycosphingolipid biosynthesis by LXR in these cells that may be replicated in other immune cells. The upregulation of glycosphingolipids coupled with downregulation of membrane cholesterol by LXR activation contribute to an overall reduction in membrane lipid order, which modulates immune synapse formation and proximal T cell signalling in the context of TCR activation.
LXR activation has previously been reported to inhibit the production of several cytokines (Cui et al., 2011; Walcher et al., 2006; Wu et al., 2014). However, we instead detected an increase in the production of both IL-2 and IL-4, and in contrast to previous studies did not observe the inhibition of IFN-γ or TNF-α. Because the anti-inflammatory actions of LXR are context dependent (Fontaine et al., 2007; Ishibashi et al., 2013a; Waddington et al., 2015), it is likely that differences in T-cell stimulation, or the type of LXR-ligand used could explain this discrepancy. We have confirmed LXR activation also inhibits T cell proliferation, as previously described (Bensinger et al., 2008). We propose plasma membrane lipids are important in mediating these functional effects, and this is likely to be a relevant mechanism complementary to others shown to be exerted by LXRs, including transcriptional regulation of cytokine mRNA (Cui et al., 2011; Walcher et al., 2006) and modulation of endoplasmic reticulum cholesterol content (Bensinger et al., 2008).
It is worth noting that Bensinger et al. (2008) observed TCR-induced repression of LXR transcriptional activity, attributed to reduced availability of endogenous LXR ligands due to their modification by the sulfotransferase SULT2B1. However, in the present study we observed very low levels of SULT2B1 by RNA-seq (<11 gene counts, Figure S3H) in human CD4+ T cells, and it was not found to be regulated by TCR activation. Furthermore, we observed only a subset of LXR target genes were downregulated in response to TCR stimulus, and genes involved in lipid biosynthesis - including UGCG and fatty acid synthase - were upregulated by TCR stimulation (Figure 4H, cluster C). This suggests the relationship between LXR and TCR signalling may be different in murine and human cells, or in circulating T cells compared to the tissue resident (splenic) T cells used by Bensinger et al. (2008).
The discovery that LXR activation upregulates UGCG expression in PBMCs provides a novel mode of action for LXR in the immune system. UGCG is a ubiquitously expressed, highly conserved gene that lacks a TATA box and CAAT motif – previously considered hallmarks of a housekeeping gene (Ichikawa et al., 1998). However, UGCG expression has been shown to be strongly upregulated by a variety of inflammatory signals (Brennan et al., 2011; Iyer et al., 2015; Köberlin et al., 2015; Pandey et al., 2017), in response to inhibition of prenylation by statin treatment (Binnington et al., 2015), and by mTORC2 during tumorigenesis (Guri et al., 2017; Khan et al., 2015). To date no post translational modifications have been identified, and transcriptional regulation appears to be the main determinant of UGCG activity (Ishibashi et al., 2013b). It will be important to establish whether LXR-mediated regulation of UGCG extends to other cell-types and tissues, as this could have wide-reaching implications for the therapeutic activation of LXR. For example, elevated expression of UGCG has repeatedly been linked to acquisition of multi-drug resistance and resistance to apoptosis in cancer models (Lavie et al., 1996; Liu et al., 2013; Wegner et al., 2018), which could undermine anti-tumour effects of LXR activation.
The role of LXR activation in T cells during the course of MS is still poorly understood. LXR agonist treatment has been shown to ameliorate the severity of the experimental autoimmune encephalitis (EAE) experimental model, and has been suggested to act by reducing infiltration of T cells into the central nervous system (Hindinger et al., 2006), and inhibiting IL-17 production via actions of SREBF1 (Cui et al., 2011). However, expression of LXRβ is increased in PBMCs from people with MS (Giorelli et al., 2007), as confirmed in CD4+ T cells in the present study (Figure 5F). Additionally, LXR signalling is upregulated in T cells during adoptive transfer model of EAE (Hoppmann et al., 2015). Here we demonstrate that LXR-regulated genes and lipids are dysregulated in T cells isolated from people with a form of the disease (relapsing remitting MS; RRMS) (Figure 5).
Most notably, expression of UGCG and glycosphingolipids are significantly reduced in MS. Supporting this observation, UGCG was also reduced in a microarray comparing CD4+ T cells from people with clinically isolated syndrome to healthy donors (FC = −2.14, p = 2.00E-07, (Corvol et al., 2008)), and more recently, in the brains of people with MS (Voskuhl et al., 2019). In addition, altered levels of ceramides and their downstream metabolites (HexCer and LacCer) have been reported in the serum, plasma and immune cells from people with MS (Kurz et al., 2018; Lötsch et al., 2018). Interestingly, Kurz et al. (2018) reported elevated expression of UGCG in a whole white blood cell population (of which the majority are neutrophils), suggesting UGCG expression may be perturbed in cell type-specific manner. Moreover, UGCG mRNA is upregulated in T cells in response to treatment with fingolimod, an immunomodulatory drug used for the treatment of RRMS (Friess et al., 2017), and IFNβ (FC = 2.326, adj p = 0.037, unpublished observation), strongly suggesting that therapeutic intervention modulates glycosphingolipid biosynthesis.
It should be acknowledged that whilst we have identified a subset of LXR responsive genes that are dysregulated in MS, it is likely that other lipid-regulated nuclear receptors and/or other transcription factors are contributing to their regulation in this context. In addition, differential LXR target gene expression is likely to be altered in a gene specific manner, as like other nuclear receptors LXR activity is orchestrated by a complex combination of factors including interactions with co-activator and co-repressor complexes, cross-talk with other nuclear receptors (Kidani and Bensinger, 2012), changes in the accessibility of LXREs due to remodelling of the chromatin landscape, availability of endogenous ligands and post-translational modifications of receptor activity (Becares et al., 2017; Bensinger and Tontonoz, 2008; Boergesen et al., 2012; Khorasanizadeh and Rastinejad, 2016; Kidani and Bensinger, 2012; Pehkonen et al., 2012).
In conclusion, our findings show for the first time that LXR regulates glycosphingolipids and TCR signalling, which strongly impact plasma membrane lipid composition and determine T-cell function. This novel mechanistic angle could be of therapeutic relevance to disorders characterised by defects in T-cell signalling and metabolism, including MS (as exemplified here), but also other autoimmune diseases, cardiovascular disease and cancer.
Materials and Methods
Antibodies and reagents
Western blotting
Primary antibodies were anti-LXRα (clone PPZ0412, Abcam, ab41902), anti-LXRβ (Active Motif, 61177), anti-phosphotyrosine (clone 4G10, Millipore 05-321) anti-phospho-LAT (Y191) (Cell Signaling, 2751), anti-phospho CD3ζ (Y142) (clone EP265(2)Y, Abcam, ab68235), anti-p42/p44 MAPK(Thr202/204) (Cell Signalling, 9101) and anti-HSP90 (clone H-114, Santa Cruz, sc7947). Secondary antibodies were goat anti-rabbit IgG (Dako P0448 or Cell Signalling 7074) or anti-mouse IgG (Sigma).
Confocal microscopy
Primary antibodies were anti-phosphotyrosine (clone 4G10, Millipore 05-321) and anti-Lck (Santa Cruz, sc13). Secondary antibodies were goat anti-Ms IgG2b-AlexaFluor633 (Invitrogen) and goat anti-Rb IgG-AlexaFluor488 (Invitrogen).
Flow cytometry antibodies
CTB and filipin staining
CD4-BV711 (clone RPA-T4, BioLegend, 300558), CD25-BV510 (clone MA251, BD BioScience, 563351), CD127-PEDazzle594 (clone A019D5, BioLegend, 351336), CD19-APC (clone HIB19, BioLegend, 302212), CD14-efluor450 (clone 61D3, eBioScience, 48-0149-42).
ANE experiments
CD4-BUV395 (clone SK3, BD Biosciences, 563550), CD25-APC (clone BC96, BioLegend, 302610) and CD127-BV421 (clone A019D5, BioLegend, 357424).
T-cell panel for comparison of HC and MS
CD45RA-BUV737 (clone HI100, BD Biosciences, 584442) CD27 – APC (clone M-T271, BioLegend, 356409), CD4-AF700 (clone OKT4, eBioscience, 56-0048-82), CCR7-BV421 (clone G043H7, BioLegend, 353207), CD69-BV510 (clone FN50, BioLegend, 310936), CD8-BV711 (clone RPA-T8, BioLegend, 301044), CD3-BV785 (clone OKT3, BioLegend, 317330), CD25-PE (clone M-A251, BioLegend, 356104), CD127-PE-Cy7 (clone A019D5, BioLegend, 351320).
Functional experiments
Intracellular cytokine staining was performed with IFNγ-efluor450 (clone 4S.B3, eBioScience, 48-7319-42), IL4-APC (clone MP4-25D2, BioLegend, 500812), IL10-PE (clone JES3-19F1, BD Pharmingen, 554706), TNFα-BV421 (clone Mab11, BioLegend, 502932) and IL2-FITC (clone 5344.111, BD Biosciences, 340448). Proliferation was analysed using the PE mouse anti-human Ki67 set (BD Pharmingen) or Cell Trace Violet reagent (Invitrogen).
Fluorescence activated cell sorting (FACS)
CD14-v450 (clone MφP9, BD Biosciences, 560349), CD8a-FITC (clone RPA-T8, BioLegend, 301006), CD19-APC-Cy7 (clone SJ25C1, BD Biosciences, 557791), CD4-BV605 (clone OKT4, BioLegend, 317438).
Human samples
50 mL of peripheral blood was collected from healthy controls (HCs), or people diagnosed with relapsing remitting MS or clinically isolated syndrome according to the Revised McDonald Criteria 2010 (Polman et al., 2011). Table S1 provides demographic information for the people with MS and the matched HCs used for experiments in Figure 5. For RNA-sequencing and lipidomic analysis of healthy T cells (Figure 1), blood leukocyte cones were purchased from NHS Blood and Transplant. Peripheral blood mononuclear cells (PBMCs) were separated on Ficoll-Paque PLUS (GE Healthcare) using SepMate tubes (StemCell Technologies). PBMCs were cryopreserved in liquid nitrogen until use. Ethical approvals for this work were obtained from the University College London Hospitals National Health Service Trust research ethics committee (Reference numbers 06/Q0506/79, 15-LO-2065, 16/YH/0306, 18/SC/0323 and 15/SW/0109) and the Medical Ethics Committee of the General University Hospital in Prague (125/12 and Evropský grant 1.LF UK-CAGEKID). All participants provided informed written consent.
Cell subset purification
Magnetic assisted cell sorting (MACS)
CD4+ T cells and CD19+ B cells were negatively selected using magnetic bead based separation (EasySep, StemCell Technologies). CD14+ monocytes were positively selected (EasySep, StemCell Technologies). To obtain monocyte-derived macrophages, monocytes were plated in low-serum media (1% FBS) for 1-2 hours in 12-well Nunc-coated plates (ThermoFisher Scientific) to promote adherence, then cultured for 7 days in complete media (RPMI 1640 (Sigma) supplemented with 10% heat-inactivated foetal bovine serum (Labtech) and 20 μg/mL gentamycin (Sigma)).
Fluorescence activated cell sorting (FACS)
CD3+ T cells for lipidomics analysis (Figure 1) and HC and MS CD4+ T cells (Figure 5) were sorted by FACS. Cells were washed in MACS buffer (PBS with 2% FBS (Labtech) and 1 mM EDTA (Sigma) and stained with antibodies against surface markers for 30 minutes. Sorting was performed on a BD FACSAria II.
Cell culture
Culture with LXR ligands
PBMCs or purified T cells were cultured in in 96 well plates (1 ×10⁶ cells/well) in complete media. Cells treated with GW3965 (1 μM, Sigma-Aldrich) were compared either to vehicle (dimethylsulfoxide, Sigma), or the LXR antagonist GSK1440233 (1 μM, GSK) in the case of the RNA sequencing experiments. For chromatin immunoprecipitation experiments cells were also treated with LG100268 (100 nM, Sigma). For western blotting experiments cells were treated with LXR ligands for 48 hours, then serum starved (1% FBS) for 1 hour prior to TCR-stimulation in PBS for 2 – 10 minutes.
Functional assays
To activate the TCR, cells were stimulated with 1 μg/mL plate bound anti-CD3 (UCHT1, eBioscience, 16-0038-85) and 1 μg/mL anti-CD28 (CD28.2, eBioscience, 16-0289-81) either in solution (for 72 hour cultures) or also plate bound (for short term stimulations). For microscopy experiments glass-bottomed 8-well chamber slides (Ibidi) or dishes (WillCo-dish) were coated with 5 μg/mL anti-CD3 and anti-CD28 antibodies.
Lipidomics
Mass spectrometry-based lipid analysis was performed by Lipotype GmbH (Dresden, Germany) as described (Sampaio et al., 2011). (See Supplementary Methods).
RNA sequencing and analysis
For experiments in Figures 1 and 4, CD4+ T cells (3 × 10⁶) were treated with GSK1440233 (CTRL, 1 μM) or GW3965 (GW, 2 μM) for 24 hours. For TCR stimulation cells were transferred to anti-CD3/28 coated plates for the last 18 hours. Total RNA was extracted using TRIzol reagent (Life technologies) followed by DNA-free™ DNA Removal Kit (Invitrogen). For experiments in Figure 5, CD4+ T cells from pwMS or HCs were isolated by FACS. Due to low cell numbers RNA was isolated using the PicoPure RNA isolation kit (Applied Biosystems). RNA integrity was confirmed using Agilent’s 2200 Tapestation. UCL Genomics (London, UK) performed library preparation and sequencing (see Supplementary Methods).
Analysis of gene expression
Gene expression was measured by qPCR as previously described (Becares et al., 2019; Gage et al., 2018). Primers were used at a final concentration of 100 nM, and sequences are provided in Table S3.
Flow cytometry
Flow cytometry staining was performed as previously described (Miguel et al., 2011; Smith et al., 2016; Waddington et al., 2019). (See Supplementary Methods).
Immunoblotting
Cells were lysed in RIPA buffer and immunoblotting performed as previously described (Gage et al., 2018). Semi-quantitative analysis was performed using the ImageJ (National Institutes of Health, USA) (Schneider et al., 2012) gel analysis module (Peterson, 2010).
Chromatin immunoprecipitation
15 – 20 ×106 PBMCs were rested overnight in complete media at 5×10⁶/mL in 6-well plates. Cells were treated with 1 μM GW ± 100 nM LG100268 (LG) for 2 hours, then washed in cold PBS. Samples were double crosslinked, first with 2 mM disuccinimidyl glutarate (ThermoFisher Scientific, 20593) for 30 minutes at RT, followed by 10 minutes with 1% formaldehyde (Pierce 16% methanol free, ThermoFisher Scientific). Nuclei were isolated as previously described (Gage et al., 2018), and chromatin was sonicated for 12 cycles of 30s on and 30s off in an ultrasonic bath sonication system (Bioruptor Pico sonication device (Diagenode)). 6 μg of pre-cleared chromatin was immunoprecipitated with 2 μg/IP anti-Histone H3K27Ac (Abcam), 4 μg/IP of anti-LXRα/β(provided by Knut Steffensen, Karolinska Institute, Sweden) or 4 μg/IP anti-rabbit IgG control (Sigma-Aldrich), Two IPs were performed for LXR and pooled prior to DNA purification.
To identify potential LXRE sequences we used NHR scan to interrogate the UGCG gene ±20kb (Sandelin and Wasserman), as in (Becares et al., 2019). Primers sequences are provided in Table S4. Human Negative Control Primer Set 1 (Active Motif, 71001) was used as a negative control.
Microscopy
Confocal microscopy
Single slices were acquired on a Leica SPE2 confocal microscope with an x63 oil-immersion objective and 488 and 633 nM excitation solid state lasers, using the following settings: 1024×1024 pixels, 600 Hz and line average of 3.
Total Internal Reflection Fluorescence (TIRF) Microscopy
To record live cells stained with ANE a customised two-channel set up was used as described by Ashdown et al. (2018), with a 488 nm laser set to 40% power. 30-minute movies were acquired at a rate of 1 frame per minute.
Image analysis
Image analysis was performed using ImageJ 1.51 (National Institutes of Health, USA) (Schneider et al., 2012). Corrected total cell fluorescence (CTCF) was calculated as follows: CTCF = integrated density – (cell area x MFI of background) (McCloy et al., 2014). The background MFI was based on three measurements taken from the area surrounding each cell. To analyse TIRF movies of ANE-stained cells ordered and disordered channels were aligned using the Cairn Image Splitter plugin. Membrane lipid order was calculated as a GP ratio, using the plugin provided by Owen et al. at https://github.com/quokka79/GPcalc (Owen et al., 2012).
Statistical analysis
Statistical tests were performed in GraphPad Prism 8 (GraphPad Software, La Jolla California USA, www.graphpad.com) unless otherwise stated. The D’Agostino & Pearson omnibus K2 test was used to check whether datasets were normally distributed. Un-paired two-tailed t-tests or Mann-Whitney U were used to compare between groups and are represented as bar charts (mean ± SD) or violin plots (median and interquartile range). A paired two-tailed t-test was used to compare results within an individual donor, and are represented as line graphs. The two-stage linear step-up procedure of Benjamini, Krieger and Yekutieli was used to correct for multiple comparisons at Q=5%. A chi-squared was used to compare categorical demographic information (sex, ethnicity), and Pearson’s correlation co-efficient was calculated for correlations.
Author Contributions
KEW performed most experiments and data analysis, and prepared figures. KEW, GAR, MA, K-S P, LMG, E C-A and SA performed flow cytometry experiments and qPCR analysis. K-S P identified the in silico LXRE for UGCG. B R-C performed western blotting experiments. DMO and II acquired confocal and TIRF ANE images and provided guidance for image analysis. PN, EKH and RF helped with recruitment of MS patients. KEW, IPT and ECJ designed experiments, interpreted the data, and prepared the manuscript. IPT and ECJ conceived the study, secured the funding and supervised all aspects of the work.
Declaration of Interests
Nothing to declare.
Acknowledgements
We are grateful to Knut R. Steffensen for the provision of the LXR antibody used for chromatin immunoprecipitation.
KEW was funded by a British Heart Foundation PhD Studentship (FS/13/59/30649). IPT was funded by a Medical Research Council New Investigator Grant (G0801278), a British Heart Foundation Project Grant (PG/13/10/30000) and an Academy of Medical Sciences Newton Advanced Fellowship. ECJ was funded by Arthritis Research UK Fellowships (20085 and 18106), Lupus UK, The Rosetrees Trust (M409), MS Society (Grant 76), and University College London Hospital Clinical Research and Development Committee project grant (GCT/2008/EJ and Fast Track grant F193).
Footnotes
↵# Shared senior authorship
Funding acknowledgements have been updated.
References


