

Abstract
Mutations that a population accumulates during evolution in one (“home”) environment may cause fitness gains or losses in other conditions. Such “pleiotropic” fitness effects shape the evolutionary fate of the population in variable environments and can lead to ecological specialization. It is unclear how the pleiotropic outcomes of evolution are shaped by the intrinsic randomness of the evolutionary process and by the deterministic difference between selection pressures in different environments. To address this question, we evolved 20 replicate populations of the yeast Saccharomyces cerevisiae in 11 laboratory environments and measured their fitnesses across multiple other conditions. We found that evolution in all home environments led to a diversity of patterns of pleiotropic fitness gains and losses, driven by multiple types of mutations. Both generalists and specialists evolved in almost all home environments. Nevertheless, individuals evolved in the same home environment were more phenotypically and genetically similar to each other than to individuals evolved in different conditions. The average pleiotropic fitness increment of a population was smaller (and more negative) in conditions less similar to its home environment. To explain our observations, we propose a model which we call “opportunity-cost pleiotropy”, a generalization of both the “mutation accumulation” and the “antagonistic pleiotropy” models. Our results indicate that the intrinsic randomness of evolutionary dynamics can play as important a role in determining the patterns of pleiotropy as the deterministic differences in selection pressures between environments.
Introduction
Populations adapt by accumulating mutations that are beneficial in their current environment, along with linked hitchhiker mutations [1]. If the environment changes, these mutations may confer fitness costs or benefits in the new condition. These “pleiotropic” effects of adaptation in one condition on fitness in others can expand the organism’s ecological niche [2] or lead to the emergence of ecological specialists [3, 4]. Fitness trade-offs also allow us to create attenuated antiviral vaccines [5], slow down the evolution of multi-drug resistance [6], and offer the opportunity to use fluctuating drug treatments to reduce the probability of drug failure [7]. However, we still lack a basic understanding of the general structure of pleiotropy. That is, what are typical statistical patterns of the pleiotropic effects of adaptation in one condition for fitness in others?
Much of what we know about pleiotropy comes from laboratory evolution experiments with microbial and viral populations where the environment can be controlled and the fitnesses of individual genotypes can be directly measured [3, 8–26]. A variety of outcomes are observed in these experiments, with fitness trade-offs in some cases [3, 8, 9, 11–20, 22, 25] but not in others [10, 12, 14, 17, 21, 23, 24, 27]. The reasons for these differences are not entirely clear [17, 26, 28]. One possibility is that the pleiotropic outcomes depend primarily on the differences in selection pressure between the home and the non-home environments [17, 22]. In other words, it is possible that adaptation to any given home environment leads to the accumulation of mutations with some typical, home-environment dependent, fitness effects in other conditions. Then, the observed differences in pleiotropic outcomes of evolution would be primarily determined by the choice of home and non-home environments. Another possibility is that chance events play an important role [14, 17, 26]. In other words, different mutations might have dramatically different pleiotropic effects, and since different populations acquire different sets of mutations, we would expect to observe different pleiotropic outcomes even among populations that evolved in the same condition.
To understand the role of selection and chance events in determining pleiotropic fitness gains and losses, we evolved populations of yeast Sacchromyces cerevisiae in a variety of laboratory environments and measured the fitness of the evolved clones in multiple panels of non-home conditions. We find that both selection and chance are important. Due to the intrinsic randomness in the accumulation of mutations, evolution in the same home condition can lead to a diversity of pleiotropic outcomes. At the same time, clones evolved in the same home environment generally have more similar pleiotropic fitness gains or losses than clones evolved in different conditions, suggesting that selection constraints pleiotropic outcomes. Finally, we find that the average pleiotropic outcome in any one environment after evolution in another can be to some extent predicted based on similarity between these environments.
Results
To investigate the pleiotropic consequences of adaptation, we experimentally evolved 20 replicate S. cerevisiae populations in 11 different laboratory environments (a total of 220 populations). Each population was founded from a single colony isolated from a common clonal stock of a laboratory strain. We chose the 11 laboratory environments to represent various degrees of several different types of physiological stresses (e.g. osmotic stress, temperature stress). A complete list of all 11 evolution conditions, plus two additional conditions used for assays, is provided in Table 1.
Environmental conditions used in this study
We evolved each population in batch culture at an effective size of about Ne ≈ 2 × 10⁵ for about 700 generations using our standard methods for laboratory evolution (see Methods for details). Seven populations were lost due to pipetting errors during evolution, leaving a total of 213 evolved lines. We randomly selected a single clone from each evolved population for further analysis.
Specialization is the typical outcome of adaptation
To assess how adaptation to one (“home”) environment alters the fitness of the organism in other (“non-home”) environments, we measured the competitive fitnesses of each evolved clone relative to their common ancestor across multiple conditions (Methods). We first chose a “diagnostic” panel of eight conditions that represent different types of physiological stresses (see Table 1) and asked how clones that evolved in each condition changed their fitness in their home environment and across the other seven non-home environments.
Figure 1 shows the median change in fitness of these clones across the eight diagnostic conditions. As expected, all clones gained fitness in their home environment. Moreover, they specialized to their home environment, in the sense that the clones evolved in an environment are usually more fit in that environment than clones evolved in other environments. There are a few exceptions to this overall pattern: the median clone evolved in Gal gained slightly less fitness in Gal than clones evolved at Low Temp and at Low Glu, and the median clone evolved at pH 3 gained less fitness in pH 3 than clones evolved in Gal, High Temp and Low Temp. These exceptions may simply reflect the inherent stochasticity in the evolutionary process. Alternatively, they could also arise if some mutations are beneficial in multiple environments but provide benefits of different magnitude (e.g. larger benefit in High Temp than in pH 3). Since mutations with larger benefits have a higher chance of surviving drift and fix faster, evolution in one environment (High Temp) would lead to larger fitness gains in the second environment (pH 3) than evolution in the second environment during the same period of time. We observed the same pattern in a previous evolution experiment [29], and a recent theoretical model suggests that this may be a generic property of evolution of complex modular systems [30].

Fitness gains and losses are reported per 700 generations of evolution.
Underlying this overarching pattern of specialization, there is a diversity of pleiotropic consequences of adaptation to different conditions. In some cases, pairs of environments appear to show evidence of trade-offs. For example, adaptation in SC led to a decline in median fitness in High Salt, and vice versa. Similarly, adaptation to pH 7.3 typically led to a decline in fitness in pH 3, and vice versa. In other pairs of environments, there is evidence of correlated adaptation. For example, adaptation to Low Glu led to fitness increases at pH 3 and vice versa. These pleiotropic consequences of adaptation are not always symmetric. For example, adaptation to pH 3 led to large fitness declines in several other conditions, but the converse is not true. Finally, there are some unexpected similarities between pleiotropic consequences of evolution in apparently unrelated conditions: adaptation to High Salt, pH 3 and pH 7.3 led to similar and large median fitness losses in “permissive” conditions (SC, Gal, and Low Temp).
Evolution leads to diverse but environment-specific pleiotropic outcomes
The patterns of median pleiotropic fitness gains and losses shown in Figure 1 may be driven by differences in selection pressure between environments, such that mutations acquired in different environments have systematically different pleiotropic effects in other conditions. Alternatively, these patterns could have arisen because each clone stochastically acquired a different set of mutations and each set of mutations produces its own idiosyncratic pattern of pleiotropic fitness gains and losses across environments.
To discriminate between these two possibilities, we need to quantify the variation in the patterns of pleiotropic fitness gains and losses around the medians observed in Figure 1. To this end, we examined the pleiotropic fitness changes of evolved clones individually. Each clone is described by its “pleiotropic profile”, the 8-dimensional vector containing its fitness changes (relative to the ancestor) in the eight test environments. If clones isolated from the same home environment cluster together in this 8-dimensional space, it would indicate that evolution in this environment leaves a stereotypical pleiotropic signature. Lack of clustering would suggest that the patterns in the median pleiotropic profiles shown in Figure 1 are driven by evolutionary stochasticity and idiosyncratic pleiotropy.
To visualize the clustering of pleiotropic profiles, we used t-stochastic nearest neighbor embedding (t-SNE) to project the 8-dimensional profiles onto two dimensions (Figure 2A,B). This t-SNE embedding is useful in looking for cluster structure because it has the property that points close together in the two-dimensional embedding correspond to clones with similar pleiotropic profiles (in contrast to principal components analysis, which instead chooses dimensions that explain the most variance between clones). In Figure 2C, we show the patterns of pleiotropy associated with each of the measured clones. Each clone is colored consistent with its color in Figure 2B.

A. t-SNE dimensional reduction of the pleiotropic profiles. Each point represents a clone; the eight-dimensional vector of clone fitnesses across the eight conditions was projected into two dimensions using t-SNE. Clones are colored according to home environment. B. t-SNE projection as in A. Colors are assigned based on t-SNE coordinate 1, and opacity based on t-SNE coordinate 2. C. The pleiotropic profiles of clones from each home environment. Profiles are colored as in B. Error bars represent ±1 SE on clone fitnesses.
The observed t-SNE embedding reveals that there are two large and clearly separated clusters, both of which contain clones from all home environments (Figure 2A). The main features that discriminate the two clusters are the fitness in permissive conditions SC, Gal and Low Temp (Figure 2B,C). Clones that belong to one cluster (which we call V−, for reasons that will become clear in the next section) lost 10 to 40 percent in these permissive conditions, whereas clones that belong to the other cluster (which we call V+) did not (Figure 2 B,C).
The distribution of clones between V+ and V− clusters is not uniform. Clones from some home environments are more likely to be found in the V− cluster than clones from other environments (χ2-test, p = 6.8 × 10⁻⁸). For example, 16/20 clones evolved in High Temp are V− but only 3/20 clones evolved in Gal are V−. In fact, this non-uniform distribution of V+ and V− clones among evolution environments explains the large median fitness losses in permissive conditions exhibited by clones evolved in High Salt, pH 3 and pH 7.3 which we saw in Figure 1 (see also Figure S1).

Median fitness gains and losses among groups of clones from the same home environment, excluding V− clones. Fitness gains and losses are reported per 700 generations of evolution.
The distribution of clones within the V+ and the V− clusters is also not uniform. Clones from some environments tend to form smaller clusters within the large V+ and V−clusters. For example, High Salt clones cluster together both within V− and within V+, High Temp clones cluster together within V−. Clones from some other home environments (e.g., Low Glu) do not show clear fine-scale clustering; and in general, there is a substantial overlap between the distributions of clones evolved in different home environments (Figure 2A). Nevertheless, neighbors of a clone are more likely to be from the same home environment: on average, 2.8 of the 5 nearest neighbors are from the same environment, compared with 0.60 ± 0.12 under random permutation.
Taken together, these observations show that evolution in all home environments leads to a variety of pleiotropic outcomes. Yet, the home environment leaves a distinct signature in the clone’s pleiotropic profile, such that clones evolved in the same condition tend to be more similar to each other than clones evolved in different conditions. This suggests that randomness of the evolutionary process is an important determinant of pleiotropy but it does not overwhelm the deterministic differences in selection pressure between conditions.
The genetic basis of pleiotropic outcomes
Next, we sought to determine the genetic basis underlying the diverse pleiotropic outcomes that we observed above, using two approaches. First, we used DNA staining and flow cytometry (see Methods) to look for ploidy changes because this is a common mode of adaptation in yeast [31–35]. Second, we sequenced the full genomes of the evolved clones. Sequencing failed at the library preparation stage or due to insufficient coverage in 15 cases, leaving us with 198 sequenced clones. Using standard bioinformatic methods for calling SNPs and small indels (Methods), we identified a total of 1925 de novo mutations. We note that because our sequencing and analysis pipeline can results in false negatives (i.e. certain mutations are difficult to confidently identify), our results represent a subset of all mutations in each sequenced clone.
Loss of killer virus causes the V− pleiotropic profile
We began by looking for the genetic differences between the V+ and V− clones. We found no association between V+ or V− phenotypes and ploidy or any of the mutations identified in the sequencing data. Instead, multiple lines of evidence demonstrate that the V− phenotype was caused by the loss of the yeast killer virus, a toxin-antitoxin system encoded by a ~ 2 kb cytoplasmic dsRNA [36–40] that was present in the ancestor of our experiment (and was retained in the V+ clones).
First, we directly looked for the presence or absence of the corresponding band in a gel electrophoresis assay (Methods). We found that both the ancestor and 7 out of 7 randomly selected V+ clones displayed the killer-virus band, while all of the 7 randomly selected V− clones did not (Figure 3A).

A. Gel electrophoresis of total DNA and dsRNA extracted from 15 clones. Anc is the common ancestor of the experiment; evolved clones 1 through 7 are from the V+ cluster (Figure 2), i.e., without a fitness defect at 21°C; evolved clones 8 through 14 are from the V− cluster, i.e., with a fitness defect at 21°C. The upper (~ 4 kb) band is consistent with the helper virus, and the lower (~ 2 kb) band is consistent with the killer virus. B. Fitness of all evolved clones relative to the ancestor and to the ancestor cured of the killer virus.
Second, we cured the ancestor strain of the killer virus (Methods) and competed all our evolved clones against this new cured reference strain at Low Temp. We observed that the severe fitness defect that the V− clones have at Low Temp when they compete against their direct ancestor entirely disappears in competitions against the cured ancestor (Figure 3B). In addition to these two experiments, we obtained several other pieces of evidence (see Methods) which support the conclusion that the loss of the killer virus is the cause of the V− phenotype.
Our results suggest that the severe fitness defect at Low Temp is not due to an inherent growth disadvantage. Rather, V− clones suffer large losses of fitness in competitions against the virus-carrying ancestor because they succumb to the virus expressed by the ancestor. Such losses are particularly severe in permissive conditions where the activity of the virus is known to be the highest [41]. Surprisingly, virus loss evolved even in these environments, despite the severe cost (Figure 2 C). This observation could be explained if virus loss occurs in two steps: genotypes that lost virulence but retained resistance to the virus first spread in the population, and genotypes without resistance then subsequently spread. In support of this explanation, we find that some evolved clones have very similar fitness relative to both the ancestor and the virus-cured ancestor (Figure 3B, horizontal blue lines), suggesting they are resistant but non-virulent [42].
Diversity at the genetic level underlies diversity of pleiotropic outcomes
We next looked for the genetic basis for the fine-scale phenotypic variation between clones that we observed in our t-SNE plot (Figure 2A, B). We found that 35 out of 213 clones became diploid during evolution. Diploids evolved more often in some environments than in others (p = 1.3 × 10⁻⁴, χ2-test) and 24 out of 35 diploids retained the killer virus, while 11 lost it (Figure 2 B). Moreover, 13 V+ diploid clones that evolved in Low Temp and Gal formed a small cluster in the t-SNE space (Figure 2 A, squares), suggesting that a change in ploidy, irrespective where it evolved, leads to certain characteristic changes in the pleiotropic profile, perhaps in conjunction with other mutations.
We next used our full-genome sequencing data to call SNPs and indels that putatively evolved under positive selection. We identified putatively beneficial mutations as nonsynonymous, nonsense, or frameshift changes within “multi-hit” genes, defined here as genes that were mutated in four or more clones across all home environments or in two or more clones from the same home environment (see Methods). In total, we identified 176 such mutations in 42 multi-hit genes (Figure 4). Only three individual multi-hit genes (SIR3, HNM1, and PDE2) are significantly associated with one home environment (p < .01, Bonferroni-corrected permutation test; see Methods). In particular, mutations in SIR1, SIR3, and SIR4, which are involved in chromatin organization, arose only in High Temp (Figure 4); mutations in HNM1 arose only in High Salt; and mutations in PDE2 arose primarily in pH 3.
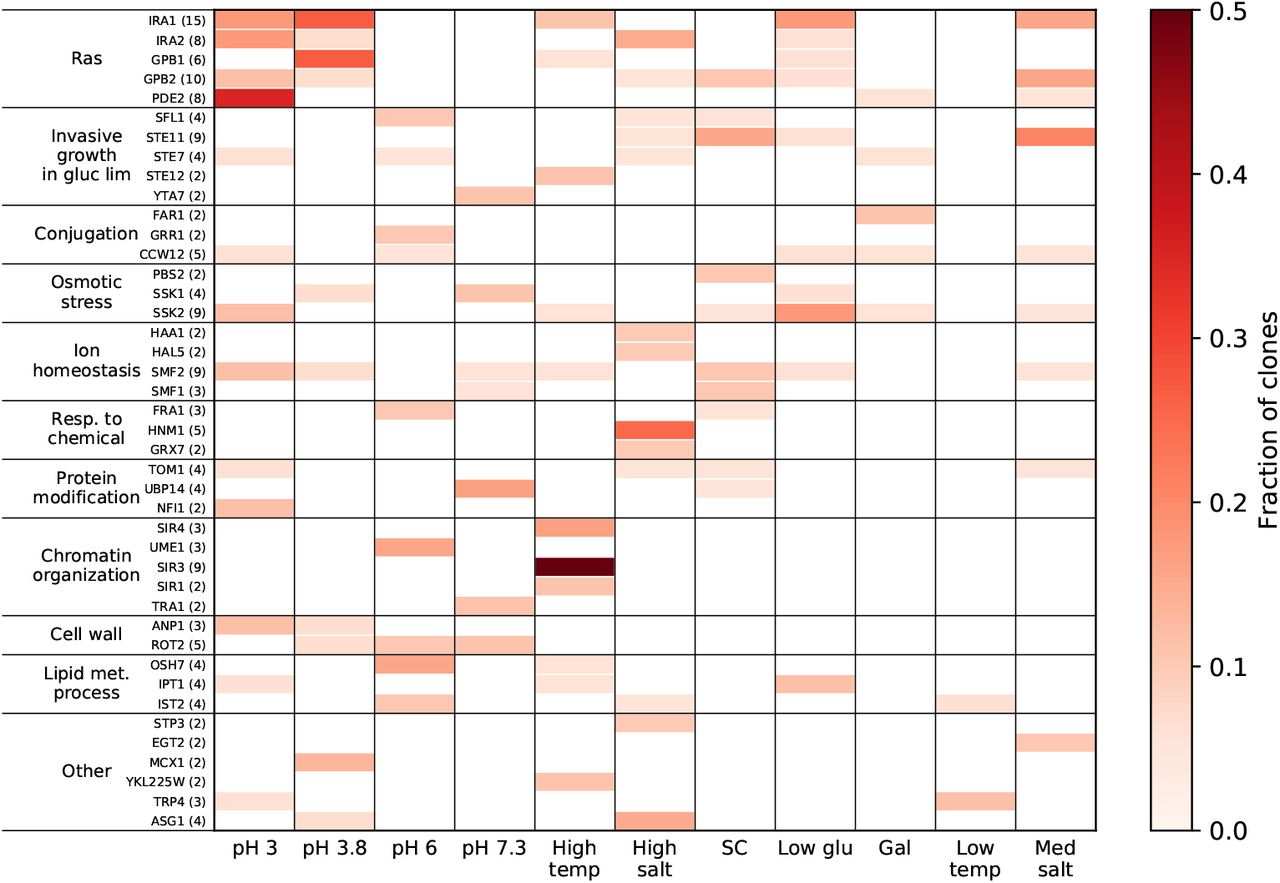
Genes with four or more nonsynonymous mutations across the experiment, or two or more within one home environment, organized into the Ras pathway and thereafter by GO slim process. Number of nonsynonymous mutations is indicated in parenthesis with each gene name.
Mutations in the vast majority of multi-hit genes spanning many biological processes arose in multiple home environments (Figure 4). For example, mutations in the RAS-pKa signaling pathway, which controls the cessation of growth under low glucose conditions [33], occurred in clones evolved in 8 out of 11 conditions except for pH 6, pH 7.3 and Low Temp. Despite a high overlap in the genomic targets of selection in different environments, we observed that mutations in the same genes arose in different environments with different frequencies, and we found a significant association between the identities of multi-hit genes and the home environment where they arose (p < 10−4, Methods).
In summary, multiple types of genetic changes accumulate during evolution in all our environments, including point mutations in a diverse set of target genes, diploidization and killer-virus loss. The same genetic changes often occur in populations evolving in different environments, which leads to substantial uncertainty in the outcome of evolution at the genetic level. Nevertheless, the probabilities of observing any given type of mutation are different in different environments. Therefore, the home environment leaves a statistically detectable footprint in the genome of an evolving organism which in turn gives rise to the organism’s home-environment-specific pleiotropic profile.
Fitness trade-offs are not inevitable but their frequency increases with dissimilarity between environments
We observed that clones adapted to a home environment concomitantly gain fitness in some non-home conditions and lose fitness in some other non-home conditions (Figures 2 and S1). We also established that these patterns of pleiotropic gains and losses are different depending on the home environment. We next sought to understand factors determining whether a clone evolved in one environment will gain or lose fitness in another condition. Our hypothesis is that fitness is pleiotropically gained in conditions that are in some sense similar to the home environment and lost in conditions that are dissimilar to the home environment [17]. Testing this hypothesis in our original diagnostic panel of 8 environments is difficult because it is not clear how similar or dissimilar they are. Therefore, we focused on three panels of environments where in each panel yeast is exposed to a particular type of physiological stress: salt, temperature or pH stress (see Table 1). Within each panel, the test environments differ by the intensity of that stress, so that similarity between conditions within a panel is well defined. For this analysis, we chose to focus on V+, non-diploid clones.
Specifically, in the “Salt panel”, we measured the fitness of clones that evolved in High Salt, Med Salt and Zero Salt (i.e, SC) in environments with four different concentrations of NaCl. In the “pH panel”, we measured clones that evolved in pH 3, pH 3.8, pH 4.5 (i.e., SC), pH 6, and pH 7.3 in environments with these pH values. Finally, in the “temperature panel”, we measured clones that evolved at Low Temp, optimal temperature (i.e., SC) and High Temp in environments with four different temperatures. Note that in some of these cases, we are considering clones evolved in intermediate environments which were not part of the diagnostic panel analysed above. To identify V− clones that arose in these home environments and remove them from the analysis, we measured fitness relative to the original and cured reference at Low Temp, and used behavior in this assay as a classifier (Methods, Figure S6).

Individual reconstructions of the six nonsynonymous mutations called in one High-Salt evolved clone on the ancestral background. Fitness of the evolved clone and the six reconstructions was measured relative to the ancestor in four environments. (Error bars: ±1 SE on reconstructed clone fitnesses.)
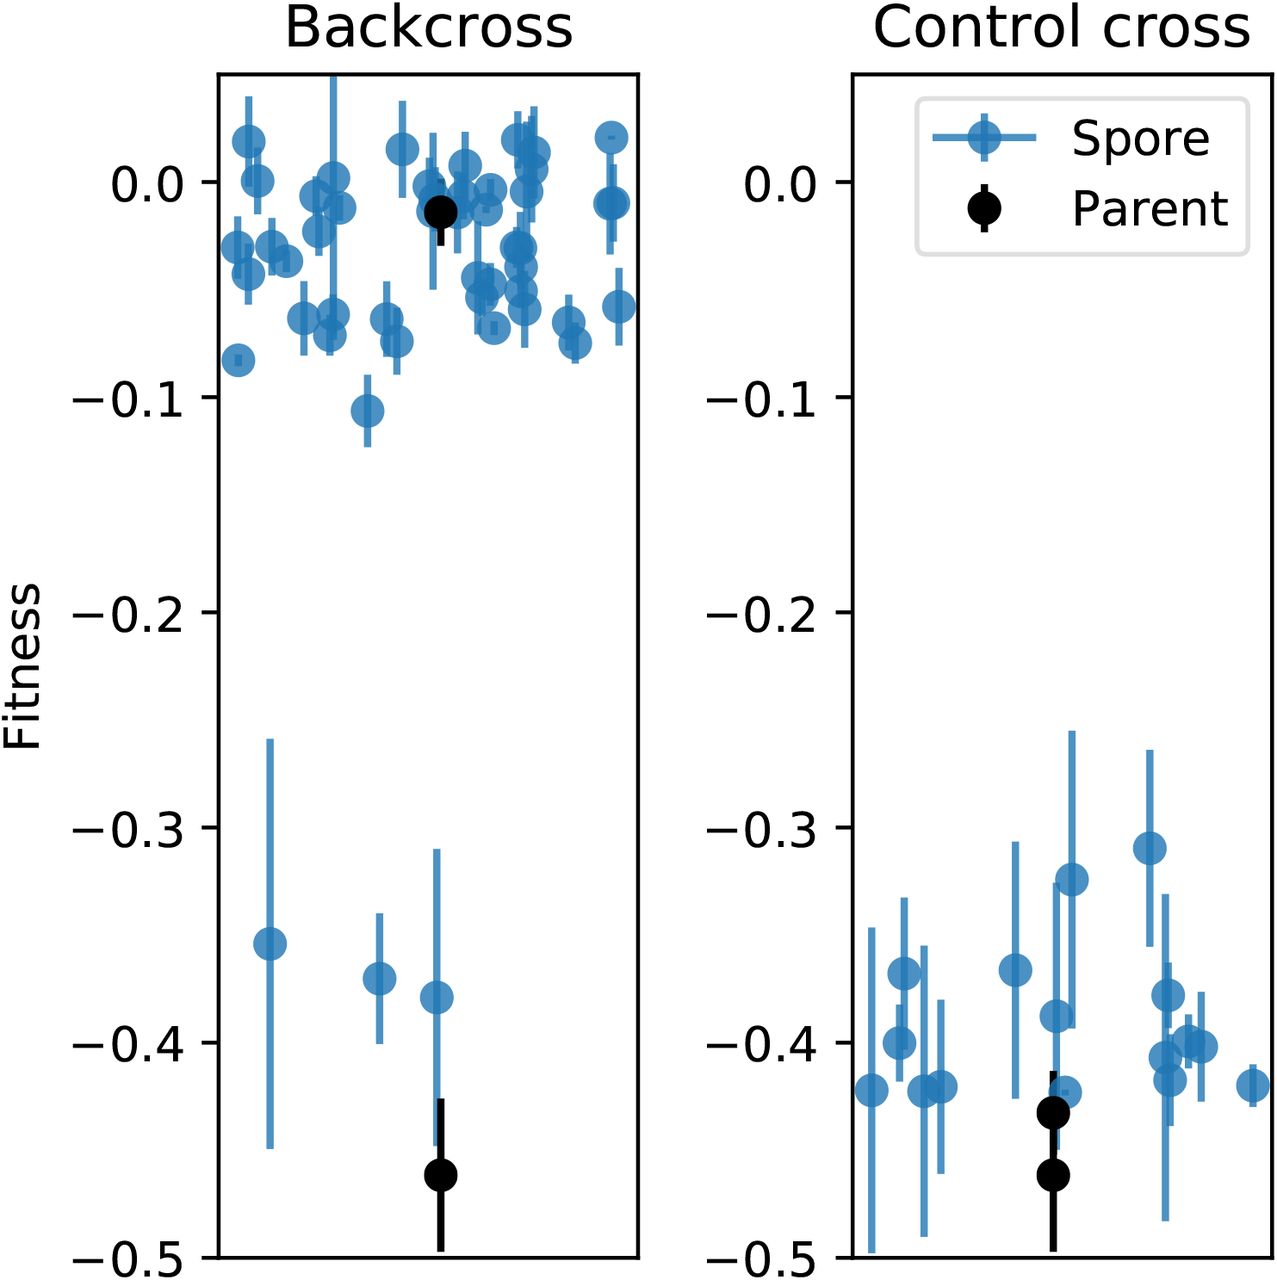
A backcross of a clone evolved in high salt with the large fitness defect at low temperature, to the common ancestor. Each circle represents the fitness of a spore from a four-spore complete tetrad, while squares show the fitness of the parents. (Error bars: ±1 SE on clone fitnesses.) The control panel shows the cross between the evolved clone and a matα version of the same genotype. The small number of clones inheriting the defect in the backcross indicates that the effect is non-Mendelian.

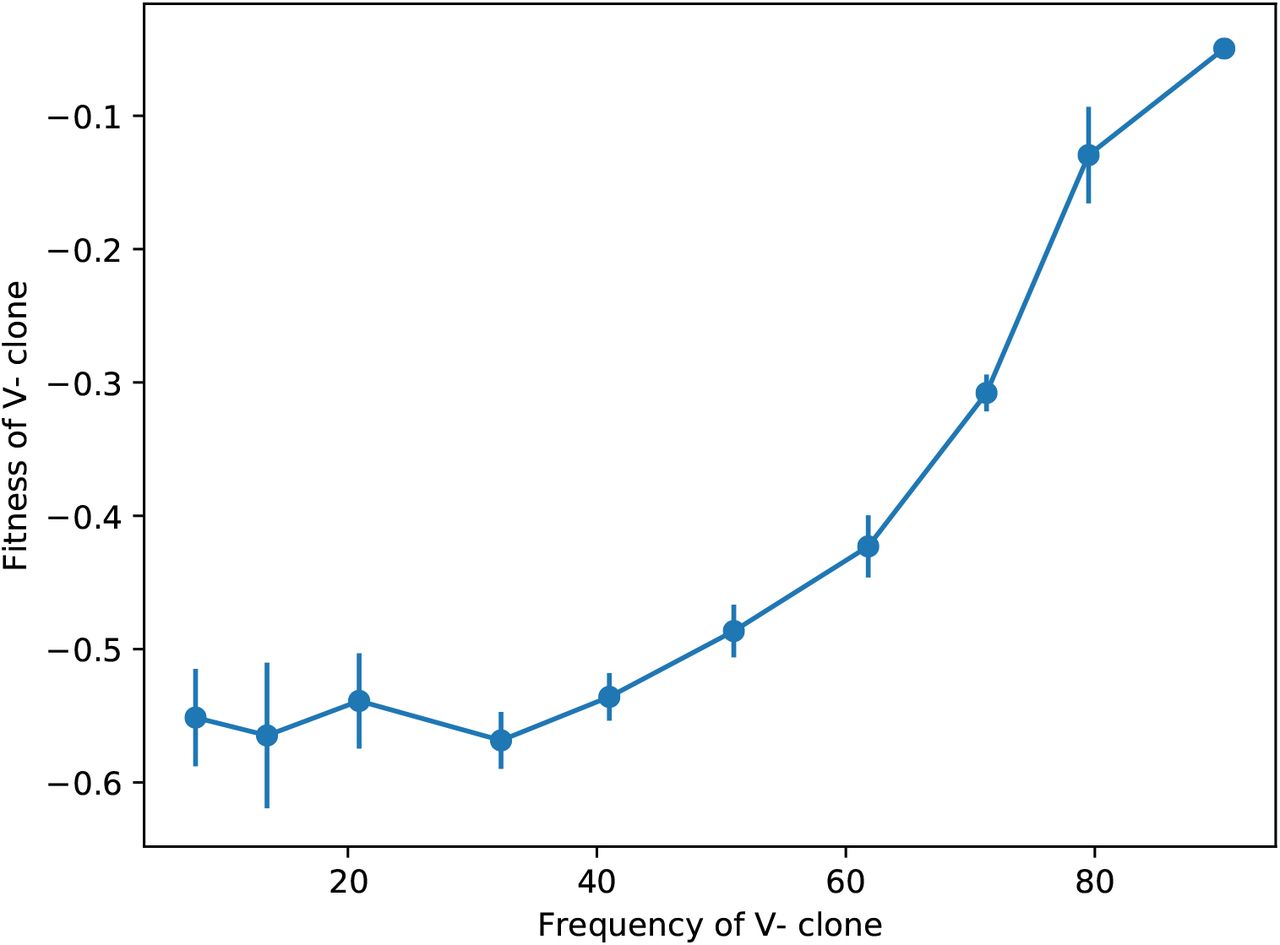
A clone with the fitness defect, competed against the ancestor at Low Temp, at different starting frequencies of the competitors. The strong frequency dependence of the fitness effect suggests that it might be caused by a direct interaction between the competitors. (Error bars: ±1 SE on clone fitnesses.)

Enrichment of multi-hit genes across evolved lines. A. Number of genes with particular numbers of ‘hits,’ where a hit is defined as a nonsynonymous mutation in an independent clone. The null distribution represents all nonsynonymous mutations redistributed amongst the yeast genes, under a multinomial distribution with probability proportional to the gene length. B. Same as in A, where numbers of hits were counted within each environment, and the results were averaged across the environments.

Fitness of clones relative to the original and virus-cured ancestor. As in Figure 3B, but for clones from the 3 environments not included in the diagnostic environments panel. Red clones were classified as V−, blue as V+.
We first asked whether the physico-chemical similarity between environments explains the average patterns of pleiotropic fitness gains and losses. Analogously to Figures 1 and S1, we found that clones usually gained more fitness on average in their home environment than clones evolved in other conditions in the same panel (Figure 5A–C). In addition, we observed that the mean fitness of a clone steadily declines in conditions progressively less similar to its home environment. These results support the hypothesis that similarity between environments determines the patterns of pleiotropy, at least on average.

Panels A, D, G refer to the salt panel; panels B, E, H refer to the pH panel; and panels C, F, I refer to the temperature panel. A-C. Average fitness of clones from each home environment (colors) across multiple test conditions (x-axis). Squares represent individual clone fitnesses. D-F. Fraction of clones from each home environment (colors) that gained fitness in each test condition (x-axis). Error bars represent ±1 SE. G-I. Fraction of clones from each home environment (x-axis) that gained fitness across all test conditions in the panel. Error bars represent ±1 SE.
The fact that clones evolved at one extreme of a panel on average lost fitness at the other extreme (Figure 5A) suggests that there may be inherent physiological trade-offs between fitness in dissimilar environments. However, we found that many clones evolved at one extreme of each panel actually gained fitness at the other extreme of the panel (Figure 5D,E,F). For example, while the majority of V+ clones evolved in SC experienced fitness declines in High Salt, 3/15 experienced fitness increases, including two clones with fitness improvements of about 5% (Figure 2D). The only exception were the clones evolved in the more acidic environments all of which lost fitness in the most basic conditions (Figure 5E,H). However, some of the clones evolved in the more basic environments gained fitness in the more acidic conditions. In fact, we found a number of clones from a variety of home environments within each panel that improved in fitness across the entire panel (Figure 5G–I). While generalist clones arise in almost all environments, clones that gain fitness in more dissimilar environments are less common than clones that gain fitness in more similar conditions. (Figure 5D–F).
These results demonstrate that there exist mutations that are beneficial across the entire range of environments that vary along one physico-chemical axis. Thus, the trade-offs between fitness even in the most dissimilar conditions (along one environmental parameter axis) are not physiologically inevitable. To further corroborate this conclusion, we measured the correlation between fitness of clones in pairs of environments in each panel (Figures S7–S9). If fitness trade-offs between a pair of conditions were physiologically inevitable, we would expect a negative correlation between fitness measured in these conditions. Instead we observe diverse and complex fitness covariation patterns, but there is a notable lack of strong negative correlations between clone fitness even in the most dissimilar pairs of environments.

Correlations between clone fitnesses in different salt conditions. Each panel below the diagonal shows clone fitnesses in a particular pair of environments. (Error bars: ±1 SE on clone fitnesses.) The diagonal shows the correlation between technical replicates in the fitness assay in each condition. Panels above the diagonal are colored by and display the Pearson correlation coefficient between clone fitnesses in the corresponding pair of environments.
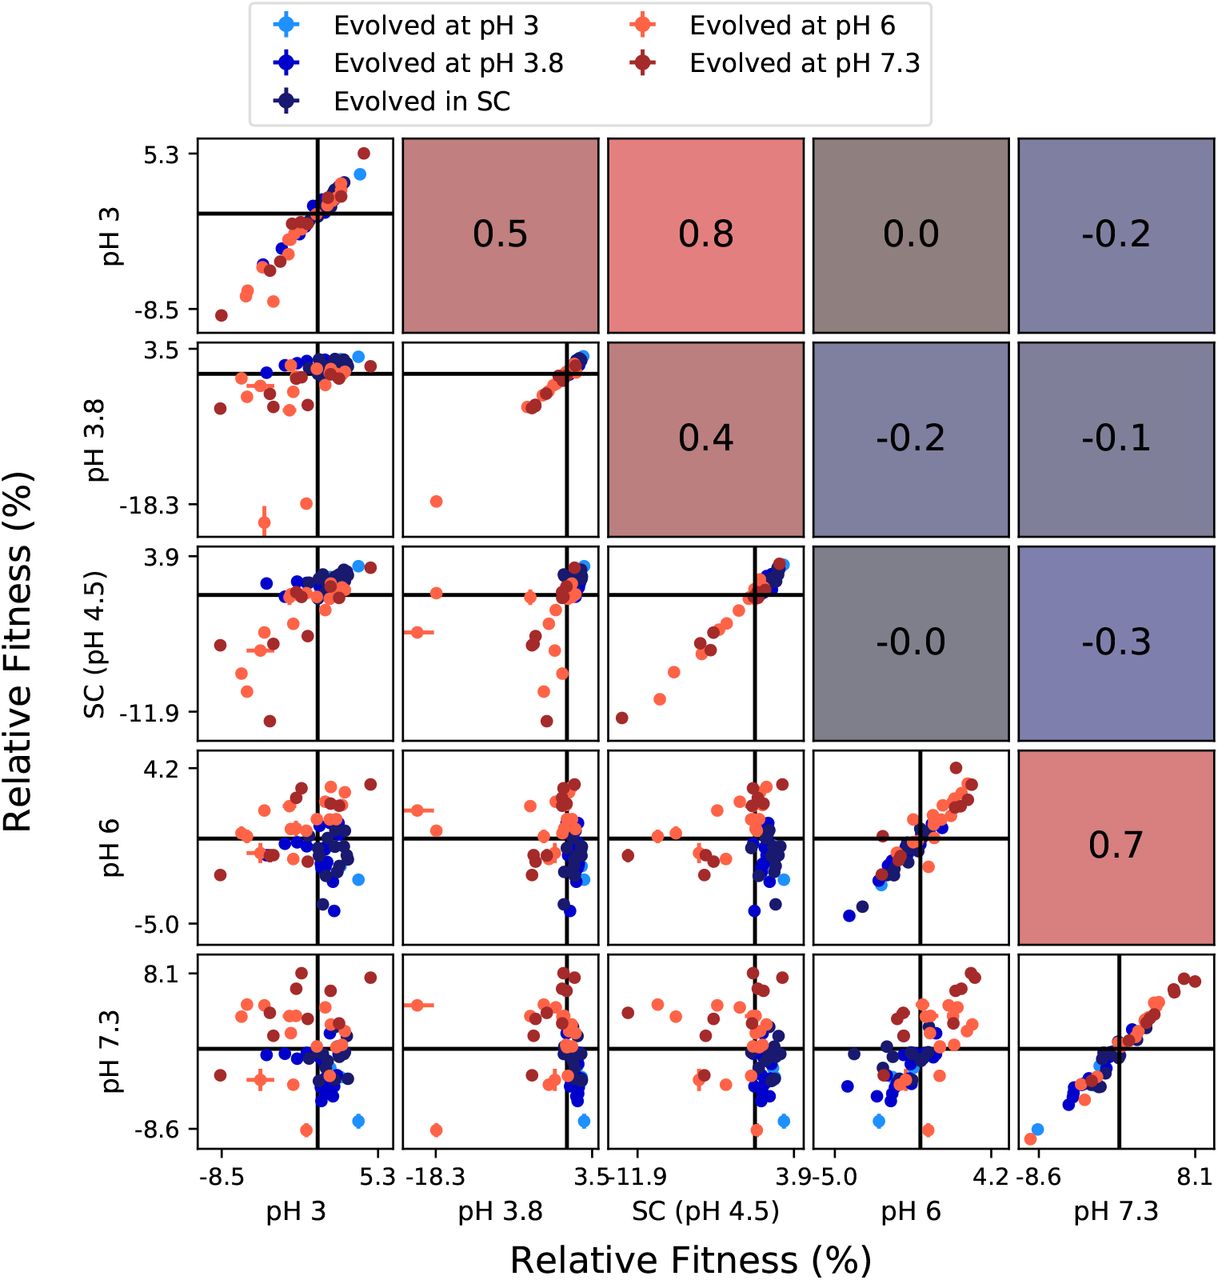
Correlations between clone fitnesses in different pH conditions. Each panel below the diagonal shows clone fitnesses in a particular pair of environments. (Error bars: ±1 SE on clone fitnesses.) The diagonal shows the correlation between technical replicates in the fitness assay in each condition. Panels above the diagonal are colored by and display the Pearson correlation coefficient between clone fitnesses in the corresponding pair of environments.

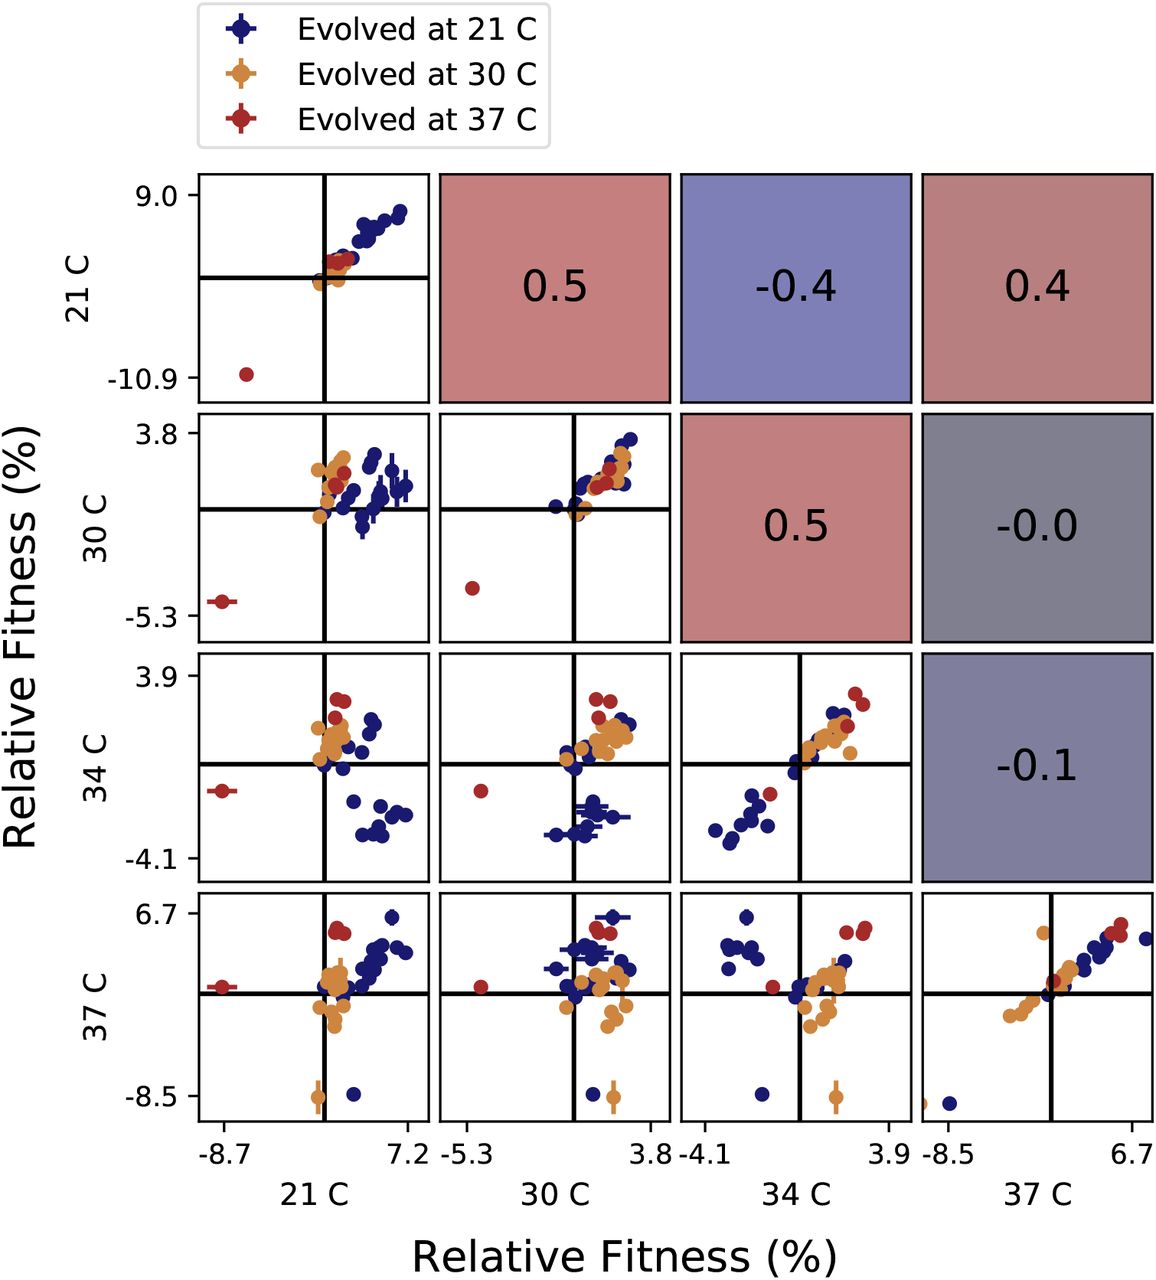
Correlations between clone fitnesses in different temperature conditions. Each panel below the diagonal shows clone fitnesses in a particular pair of environments. (Error bars: ± 1 SE on clone fitnesses.) The diagonal shows the correlation between technical replicates in the fitness assay in each condition. Panels above the diagonal are colored by and display the Pearson correlation coefficient between clone fitnesses in the corresponding pair of environments.
Discussion
To assess how chance and necessity in evolution affect the fitness of an organism across multiple environments, we evolved populations of budding yeast in a variety of laboratory “home” conditions. We characterized each population by its “pleiotropic profile”, i.e., the vector of fitness gains and losses in an array of diagnostic environments. We found that diverse sets of pleiotropic profiles arose during evolution in all home environments (Figure 2). At the genetic level, we similarly found that clones evolved in the same condition often acquired different types of new mutations, including loss of the killer virus, diploidization and mutations in many nuclear genes (Figures 3 and 4). We showed that killer virus loss and diploidization cause some of the distinct pleiotropic profiles. Many of the genetic changes arose in parallel in different home environments (Figure 4) which led some individuals from different home environments to have similar pleiotropic profiles (Figure 2). Since it is unpredictable which mutations occur at what time in any given population and since different mutations have different pleiotropic effects, we conclude that the pleiotropic outcomes of evolution are in large part governed by chance.
Despite this genetic and phenotypic randomness at the level of an individual population, clear and repeatable patterns emerge when we consider ensembles of populations evolved in the same home environment. The pleiotropic profiles of individuals evolved in the same home environment tend to be statistically more similar to each other than those of individuals from different home environments (Figure 2). On average, evolution leads to specialization, so that an average individual evolved in an environment is usually (but not always) more fit in that environment than an average individual evolved elsewhere (Figure 1). The magnitude of average pleiotropic fitness gains or losses in non-home conditions depends predictably on how similar these conditions are to a population’s home environment: the average fitness gains are smaller or turn into losses in environments that are more dissimilar to the home environment (Figure 5). When comparing the genomes of individuals evolved in different conditions, we find that, even though the same types of mutations arise in different home environments, they do so with different frequencies. This leads to statistically distinct patterns of observed mutations across home conditions that underly the statistically distinct patterns of pleiotropy. The most obvious explanation for these differences is that different environments exert different selection pressures on the organism. However, we cannot exclude the possibility that there may also be different spectra and rates of mutations in different environments, as a recent report shows can occur in yeast [45]. We conclude that subtle differences in selection pressures and possibly mutational biases shift the statistical patterns of pleiotropy and the distribution of fixed mutations, leading to an average degree of specialization that depends on the dissimilarity between environments.
An important caveat is that all observations we made here are based on clones that were sampled from populations of a particular size after a particular number of generations of evolution in the home environment. The contributions of chance and necessity may be different in populations of different size and/or after shorter or longer periods of adaptation to a home environment. To understand these broader patterns, one would need to know the shape of the joint distribution of fitness effects of new mutations and how it varies across genotypes due to epistasis.
Our results help us better understand the evolution of specialists and generalists, a long-standing problem in evolutionary ecology [46]. Many models require the existence of explicit trade-offs, or antagonistic pleiotropy, between traits for specialists to evolve [28, 46]. On the other hand, it has long been appreciated that mutation accumulation can also lead to fitness losses in alternative environments, through the degradation of unused functions [23]. We propose a model which we call “opportunity cost” pleiotropy, which combines these two perspectives. In our model, the fitness effects of mutations in a particular pair of home and non-home environments form a continuum, such that some of the mutations that accumulate in the home environment (both drivers and hitchhikers) incur pleiotropic fitness costs in the non-home environment and some others provide pleiotropic fitness benefits. Thus, both ‘antagonistic pleiotropy’ and ‘mutation accumulation’-type mutations exist as part of this continuum of mutations. If mutations that incur a pleiotropic cost are more common than those that provide a pleiotropic benefit, the populations will tend to lose fitness in the non-home environment. This represents an “opportunity cost” since the population misses an opportunity to improve fitness in both environments. Further, the physico-chemical similarity between the home and non-home environments determines the fraction of mutations that are beneficial in both, such that this fraction is close to one if the environments are similar and declines as environments become less similar. If the fraction of such “universally beneficial” mutations is zero, a trade-off between the fitness in the two conditions is physiologically inevitable, i.e., the organism finds itself at the Pareto front [30, 43, 44]. Our results show that specializaton can arise due to subtle shifts in this distribution between different conditions, even in the absence of physiological trade-offs, far from a Pareto front.
Materials and methods
Experimental evolution
The S. cerevisiae strain yGIL104 (derived from W303, genotype Mata, URA3, leu2, trp1, CAN1, ade2, his3, bar1∆ :: ADE2, [47]) was used to found 220 populations for evolution. Each population was founded from a single colony picked from an agar plate. Populations were propagated in batch culture in 96-well polystyrene plates (Corning, VWR catalog #29445-154). Except for the galactose and low glucose conditions, all media contained 2% dextrose (BD, VWR catalog #90000-904), 0.67% YNB with nitrogen (Sunrise Science, catalog #1501-500), and 0.2% SC (Sunrise Science, catalog #1300-030). The galactose condition contained 2% galactose (Sigma-Aldrich, #G0625) instead of dextrose, and the low glucose condition contained 0.07% dextrose. Other conditions contained the following in addition to SC-complete. Low salt: 0.2 M sodium chloride. Medium salt: 0.4 M sodium chloride. High salt: 0.8 M sodium chloride. pH 3: 0.02 M disodium phosphate, 0.04 M citric acid. pH 3.8: 0.0354 M disodium phosphate, 0.032 M citric acid. pH 6: 0.0642 M disodium phosphate, 0.0179 M citric acid. pH 7.3: 0.0936 M disodium phosphate, 0.00032 M citric acid. Buffered media were filter sterilized; all other media were autoclaved.
All populations were grown at 30°C, except for the high temperature lines (37°C) and the low temperature lines, which were grown at room temperature (21 ± 0.5°C). In the SC, high temperature, medium salt, low glucose, pH 3, pH 3.8, and pH 6 conditions, dilutions were carried out once every 24 hours. In the galactose, low temperature, and high salt conditions, dilutions were carried out every 36 hours. All dilutions were carried out on a Biomek-FX pipetting robot (Beckman-Coulter). Before each transfer, cells were resuspended by shaking on a Titramax 100 orbital plate shaker at 1200 rpm for at least 1 minute. In the pH 7.3 condition, dilutions were carried out every 48 hours. At each transfer, all populations were diluted 1:512 except for the low glucose populations, which were diluted 1:64. This maintained a bottleneck size of about 104 cells in all conditions. Populations underwent approximately the following numbers of generations (doublings): SC, high temperature, medium salt: 820. Low glucose: 730. pH 3, pH 3.8, pH 6: 755. High salt, galactose, low temperature: 612. Every 7 transfers, populations were mixed with glycerol to final concentration 25% (w/v) and stored at −80°C. Each 96-well plate contained blank wells; no contamination of blank wells was observed during the evolution. Over the course of evolution, 7 populations were lost due to pipetting errors, leaving 213 evolved lines.
To pick clones for further analysis, each final population was streaked onto SC-complete with 2% agar. One colony per population was picked, grown in 128 µl of SC at 30°C, mixed with 25% (w/v) glycerol, and stored at −80°C.
Competitive fitness assays
We conducted flow-cytometry-based competitive fitness assays against yGIL104-cit, a fluorescently-labeled derivative of the common ancestor, yGIL104. To construct the fluorescent reference strain, we amplified the HIS3MX6-ymCitrineM233I construct from genomic DNA of strain yJHK111 (courtesy of Melanie Muller, John Koschwanez, and Andrew Murray, Department of Molecular and cellular Biology, Harvard University) using primers oGW137 and oGW138 and integrating it into the his3 locus.
Fitness assays were conducted as has been described previously [48, 49]. Briefly, we grew all test strains and the reference strain from frozen stock in SC at 30°C. After 24 hours, we diluted all lines into the assay environment for one growth cycle of preconditioning. We then mixed the reference strain and the test strains 50/50. We monitored the relative numbers of the reference and test strain over three days in co-culture. We measured fitness as  where τ is the number of generations between timepoints, nit is the count of the test strain at the initial timepoint, nft is the count of the test strain at the final timepoint, and nfr, nir are the counts for the reference.
Library preparation and whole-genome sequencing
Libraries were prepared for sequencing as has been described previously [50]. Briefly, genomic DNA was extracted from each of the 213 clones using the PureLink Pro 96 Genomic Purication Kit (Life Technologies catalog #K1821-04A) and quantified using the Qubit platform. The multiplexed sequencing library for the Illumina platform was prepared using the Nextera kit (Illumina catalog #FC-121-1031 and #FC-121-1012) and a modified version of the Illumina-recommended protocol [50]. Libraries were sequenced on a Nextera Hi-seq 2500 in rapid-run mode with paired-end, 150 bp reads.
Nucleic acid staining for ploidy
Clones were grown to saturation in YPD (2% dextrose, 2% peptone, 1% yeast extract). Saturated cultures were diluted 1:10 into 120 µl of sterile water in a 96-well plate. The plate was centrifuged, and cultures were resuspended in 50 µl of fresh water. 100 µl of ethanol was added to each well, and the wells were mixed slowly. Plates were incubated for one hour at room temperature, or overnight at 4°C. Cells were centrifuged, ethanol solution removed, and 65 µl RNAase solution added (2 mg/mL RNAase in 10 mM Tris-HCl, pH 8.0, plus 15 mM NaCl). Samples were incubated at 37°C for 2 hours. To stain, 65 µl of 300 nM SYTOX green (ThermoFisher, S-34860) in 10 mM Tris-HCl was added to each well, for a final volume of 130 µl. Plates were incubated at room temperature, in foil, for 20 minutes.
Fluorescence was measured via flow cytometry on a Fortessa analyzer (FITC channel). Fluorescence peaks were compared to known haploid and diploid controls to score ploidy. For 19/213 clones we observed smeared peaks intermediate between the haploid and diploid peaks; we called these clones as undetermined and included them with the haploids in analysis.
SNP and indel identification
We called SNPs and small indels as described previously [29], with the following two modifications: first, we aligned reads to a custom W303 reference genome [1]. Second, for clones called as diploid via staining, we called mutations as heterozygous if they occurred at frequencies between 0.4 and 0.8, and homozygous otherwise. We called mutations in all other clones if they occurred at a frequency of at least 0.8. We included both heterozygous and homozygous mutations in subsequent analyses.
For 95.4% (1925) of the mutations that we called, the mutation was found in one clone (i.e. the mutation was unique at the nucleotide level). The remaining 4.6% (88) of mutations were found in two or more clones. These mutations may have originated from standing genetic variation in the starting strain, and thus we excluded them from our analysis of de novo mutations.
Analysis of genetic parallelism
To test for parallelism at the gene level, we redistributed the observed nonsynonymous mutations across the genes in the yeast genome, under a multinomial distribution with probabilities proportional to the gene lengths. We determined that genes with four nonsynonymous mutations across the experiment, or two nonsynonymous mutations within one evolution condition, were enriched (Figure S5). To divide these genes into categories, we first classified genes as belonging to the Ras pathway based on de novo mutations in the same pathway found in previous studies [1, 33]. We classified the remainder of the genes using GO-SLIM ‘biological process’ analysis, placing genes into GO-SLIM categories in order of the process enrichment score.
To test for associations between individual multi-hit genes and home environments, we redistributed the observed mutations in each gene across environments, preserving the number of mutations per gene and the number of mutations per environment, but ignoring which mutations occurred in which clones. We calculated the nominal P-value by comparing the maximum number of hits to a particular gene in any environment in the permuted and original data. To correct for multiple testing, we multiplied the obtained nominal P-value by the total number of genes (Bonferroni correction).
We used a mutual-information based test statistic to test for overall association between the evolution environments and mutated genes. We defined the mutual information as:
 where m is the number of significant genes, n is the number of evolution environments, pij is the probability of a clone from environment i having a mutation in gene j, pj is the probability of any clone having a mutation in gene j, and pi is the proportion of clones evolved in environment i. By convention pij log2(pij) = 0 if pij = 0, and probabilities were estimated based on the observed frequencies of the events. We determined significance by comparing M to the null distribution under permutation, preserving the number of mutations per gene and the number of mutations per environment. For the null distribution, M was .67 (.62,.73), whereas for the data M was 1.15. Code used for analysis and figure generation is available at: https://github.com/erjerison/pleiotropy. The number of sequenced clones from each environment was: SC (19), High Salt (20), High Temp (18), Low Glu (17), Gal (18), Low Temp (18), pH 3 (17), pH 7.3 (18), pH 6 (19), pH 3.8 (15), Med Salt (19).
t-SNE and clustering analysis
We used the sklearn.manifold.t-SNE class in the python package scikit-learn 0.2, with 2 dimensions and perplexity 30, to project the 8-dimensional fitness vectors into a 2-dimensional t-SNE space. We then used the sklearn.cluster.KMeans class to perform k-means clustering with k=2 in the t-SNE space. We used this cluster assignment to call V+ and V− phenotypes. These clusters correspond to those identifiable visually in Figure 2. The number of clones from each ‘extreme’ environment was: SC (19), High Salt (20), High Temp (20), Low Glu (20), Gal (19), Low Temp (19), pH 3 (18), pH 7.3 (20).
dsRNA extraction and gel electrophoresis
Yeast cell pellets from 1.5 mL of an overnight culture were re-suspended in 50µl of a zymolyase based enzymatic digest to lyse the cells (5mg/mL Zymolyase 20T, 100mM sodium phosphate buffer pH 7.4, 10mM EDTA, 1M Sorbitol, 20mM DTT, 200µg/mL RNAse A, 0.5% 3-(N,N-Dimethylmyristylammonio)propanesulfonate and incubated at 37°C for an hour. The spheroplasted cells were then lysed with 200µl of lysis/binding buffer (4.125M guanidine thiocyanate, 25% isopropanol, 100mM MES pH 5). After a brief vortexing, the clear solution was passed through a standard silica column for DNA purification, and washed two times with 600µ l of wash buffer (20mM Tris-Cl pH 7.4, −80% ethanol). After drying the column, the DNA and dsRNA was eluted with a low salt elution buffer (10mM Tris-Cl pH 8.5).
Total extracted genomic material was subjected to standard gel electrophoresis (1% agarose gel, TAE running buffer, stained with 0.5µ g/mL ethidium bromide).
Curing the killer virus
Strain yGIL104-cit-V-was constructed from yGIL104-cit as follows. yGIL104-cit was grown from frozen stock overnight in YPD. Saturated culture was diluted 1: 105 and 250 µ L was plated on YPD. Plates were incubated at 39°C for 72 hours. Colonies were picked and the presence of the virus dsRNA band was tested as described above. 2/9 colonies tested displayed the helper virus band but no killer virus band; 7/9 retained both bands. The two V−colonies were restreaked and a clone from each was grown in YPD, mixed with glycerol to 25%, and stored at −80°C. Competitive fitness assays were performed with both clones against yGIL104, at several starting frequencies, in SC, 21°C, 37°C, and high salt. Fitnesses of the two clones at each frequency and condition were the same, so one clone was designated yGIL104-cit-V- and was used as a cured reference in all subsequent assays.
We used fitness relative to the original and cured ancestor to classify clones from the 3 environments not included in the diagnostic panel as either V+ or V− (Figure S6). We also note that one clone (High Temp clone 20) was lost from the cured reference fitness assay.
Determining the cause of the Low Temp fitness defect: additional experiments
We performed several types of experiments to determine the genetic basis of the large observed fitness defects in the Low Temp environment. First, we reconstructed all six nonsynonymous mutations called in one evolved clone with the fitness defect on the ancestral background. The strain background used for reconstructions was yERJ3, which was constructed from yGIL104 by amplifying the HIS3 construct from yGIL104-cit using primers 3 and 4, which target the URA3 locus. This construct was transformed into yGIL104 using standard techniques [51], plated on CSM-His dropout media, and replica plated to 5FoA and CSM-Ura to verify the His+/Ura-phenotype.
We used the delitto-perfetto method for the reconstructions [52]. Briefly, we amplified a URA3-Hph construct from plasmid pMJM37 (provided by Michael J. McDonald) using primers 6-17, which target the yeast genome 5 bp upstream and downstream of the mutations of interest. We selected on CSM-Ura and hygromycin-B, picked two clones, and transformed each with two complementary 90 bp repair oligos (18-29), that contain the mutation of interest and the flanking genic region. We selected on 5FoA and replica plated to hygromycin to determine the phenotype. We used primers 30-41 to amplify the locus in the reconstructed line for Sanger sequencing.
We performed fitness assays of yERJ3, the reconstructed lines, and the knockout intermediates, against yGIL104-cit in the SC, 37°C, 21°C, and high salt conditions. For one mutation, in the gene CUE4, one reconstruction replicate displayed a significant fitness defect across all conditions, while the other replicate did not. We discarded this clone as a likely reconstruction artifact.
We note that the reconstruction background, yERJ3, had an apparent fitness defect of a few percent in the high salt environment, potentially due to the engineered URA3 auxotrophy. We report fitnesses of reconstructed lines relative to yERJ3 in Figure S2. These mutations account for the fitness advantage in the clone’s home environment (High Salt), but none of them carries the characteristic large fitness defect at Low Temp.
To determine whether the defect was caused by a mutation that we did not detect during sequencing, we back-crossed three evolved clones that displayed the defect to the common ancestor and picked four-spore complete tetrads. The strain yERJ10 (genotype Matα yGIL104 ura3::HIS3) was constructed from yGIL104 as described above for yERJ3. The mating type was switched using an inducible Gal::HO plasmid, pAN216a-URA3-GAL::HO-Ste2pr::SkHIS3-Ste3pr::LEU2. The strain was transformed with the plasmid and plated on CSM-Ura dropout media. A colony was grown in SC-Ura dropout media with 2% sucrose overnight. 1 mL of culture was centrifuged and resuspended in SG-Ura dropout media (2% galactose) to induce. Cells were plated on SC-Leu dropout media directly after transfer to SG-Ura and 60 minutes later colonies were streaked on SD-Complete + 5FoA to eliminate the plasmid. Matα versions of evolved lines were constructed in the same way. After mating, diploids were selected on CSM-Ura-His dropout media. Diploids were sporulated in Spo++ media [51] plus 0.5% dextrose at 21°C for 3-5 days. Tetrads were dissected according to standard yeast genetics methods [51]. Four-spore complete tetrads from each mating were grown in SC, mixed with glycerol to final concentration 25%, and frozen at −80°C. Fitness assays of four-spore complete tetrads from each mating, competed against yGIL104-cit, were conducted as described above at 21°C. We also constructed a mitochondrial-cured version of the reference and of the evolved lines; the fitnesses of spores from crosses involving these lines were not distinguishable from the corresponding ρ+ crosses, so spore fitnesses were pooled.
In Figure S3, we show data from a representative one of these crosses: yERJ10 Matα × High Salt-17 Mata (backcross) and High Salt-17 Matα × High Salt-17 Mata (control cross). We observed that the fitness defect did not segregate 2:2, as would be expected for a Mendelian trait; rather, very few of the segregants from the back-cross displayed the defect. This observation is consistent with a cytoplasmic genetic element (the virus) that is carried by one parent (the ancestor) but not the other (evolved line), and is usually re-inherited by segregants upon mating.
Given that the defect did not appear to be caused by a nuclear genetic mutation, we next addressed whether there was evidence of a direct interaction between strains during competition. To do so, we asked whether the size of the fitness defect depended on the frequency of the competitors. In Figure S4, we show an example of such a competition experiment, between the putative virus-carrying reference and the cured ancestor at Low Temp. The strong frequency-dependence of the fitness defect is consistent with secretion of a toxin by one competitor: the strain lacking the virus (and thus the antitoxin) is at a larger disadvantage when the virus-carrying competitor is at high frequency.
Together with the direct observation of the virus band through gel electrophoresis and the competition of all of the evolved lines against the cured ancestor, as described in the main text, these observations support the conclusion that loss of the killer virus particle in some evolved lines caused the large fitness defect at Low Temp.
Data availabilty
Data used in Figures 1,2,5 is provided in Supplementary Table S1. Data used in Figure 3 is provided in Supplementary Table S2. Data used in Figure 4 is provided in Supplementary Table S3. Code used for analysis and figure generation is available at https://github.com/erjerison/pleiotropy. The sequences reported in this paper have been deposited in the BioProject database (accession number PRJNA554163). All strains are available from the corresponding authors upon request.
Supplementary Tables
Supplemantary Table S1. Fitness measurement data.
Supplemantary Table S2. Fitness measurement data in 21°C with respect to the cured reference.
Supplemantary Table S3. Identified mutations.
Supplemantary Table S4. Primers used in this study.
Acknowledgments
We thank members of the Desai and Kryazhimskiy labs for experimental assistance and comments on the manuscript. MMD acknowledges support from the Simons Foundation (Grant 376196), grant DEB-1655960 from the NSF, and grant GM104239 from the NIH. SK acknowledges support from the BWF Career Award at Scientific Interface (Grant 1010719.01), the Alfred P. Sloan Foundation (Grant FG-2017-9227), and the Hellman Foundation.
Footnotes
References


