

ABSTRACT
The identification of the potential mechanisms of resistance while tumor cells still respond to therapy is critical to develop combination therapies to delay resistance. Cetuximab, an anti-EGFR therapy, is the only targeted therapy available for head and neck squamous cell carcinoma (HNSCC). We generated the first comprehensive multi-omics, single cell data and bulk in sensitive HNSCC cells to identify relevant transcriptional and epigenetic changes that are an immediate response to cetuximab in sensitive cells. These changes include genes from two pathways potentially associated with resistance: regulation of growth factor receptors by TFAP2A, and epithelial-to-mesenchymal transition (EMT) process. Single cell RNA-sequencing demonstrates inter-cell lines heterogeneity, with cell specific TFAP2A and VIM expression profiles in cetuximab treated and untreated clones, and an independent role of each pathway. RNA-seq and ATAC-seq confirmed the heterogeneity and demonstrate that there are global transcriptional and epigenetic changes in sensitive cells treated with cetuximab. Lack of TFAP2A reduces HNSCC growth in vitro and this effect is enhanced with cetuximab and a stronger effect is observed with JQ1, an inhibitor of other receptor tyrosine kinases. Corroborating our scRNA-seq observation, TFAP2A silencing does not affect cell migration, supporting the lack of interplay with the EMT pathway.
Implications Overall, our study shows that relevant pathways to resistance are altered in vitro only a few days of cetuximab therapy initiation. Although heterogeneous, these immediate changes can be targeted by a multiple-target drug, JQ1, that in combination with cetuximab in the early stage of treatment present better efficacy in controlling tumor growth.
INTRODUCTION
Cancer targeted therapies block specific relevant pathways for tumor progression inhibiting tumor growth and providing prolonged survival (1). However, these therapies are not curative since acquired resistance develops within a few years of therapy (2). The mechanisms behind tumor evolution from responsive to resistant state are not fully understood (3,4) but can involve mutations to the target gene, activation of downstream genes or of alternative pathways (5). Studies aiming to characterize the mechanisms of resistance have shown an important role of tumor heterogeneity and from cell adaptive responses to these therapies as sources of resistance (6). The presence of a multitude of cell clones increases the chances of the existence of intrinsic resistant small populations that are selected and will keep growing despite the treatment (6). In addition, the sensitive cell clones have the ability of activating alternative pathways to overcome the blockade of such essential cell growth pathways (7). Investigating the relevant adaptive mechanisms that are potential drivers of resistance is critical to introduce early alternative therapies before the phenotype evolves as the dominant among the cancer cells.
Acquired targeted therapeutic resistance is pertinent for neck squamous cell carcinoma (HNSCC). Currently, cetuximab is the only FDA approved targeted therapeutic for HNSCC (8) and was selected based on pervasive overexpression of EGFR and its associations with outcomes in HNSCC (9,10). As with other targeted therapies, virtually all HNSCC patients develop acquired resistance and disease control is just temporary limiting its clinical application (11). The near universal emergence of resistance and intermediate time rate at which it occurs mark cetuximab treatment in HNSCC as an ideal model system to study resistance. Little is known about the immediate transcriptional and epigenetic changes induced by cetuximab. Others and we have found that compensatory growth factor receptor signaling, regulated by TFAP2A and EMT, both associated with resistance, are altered while cells are still sensitive to therapy (12,13). Transcriptional changes to these pathways occur while HNSCC cells are still responsive to cetuximab (12,13). Nevertheless, their precise role in resistance and timing at which they induce phenotypic changes remains unknown. It is critical to isolate the timing and effect of each of these pathways during cetuximab response to delineate their subsequent role in resistance.
Here, we hypothesize that the mechanisms of resistance are up-regulated while HNSCC cells are still sensitive to cetuximab and that some of these mechanisms are associated with chromatin remodeling induced as an immediate response to therapy. Our previous study showed in vitro up-regulation of TFAP2A only one day after cetuximab treatment (12). Since some of its targets are growth factor receptors (14,15), it is very probable that this is one of the mechanisms activated by HNSCC cells to overcome EGFR blockade and that will induce resistance. Schmitz et al. (13) also demonstrated that mechanisms of resistance to cetuximab arise early in the course of HNSCC therapy by detecting EMT up-regulation after only two weeks of patients’ treatment. The stimulation of the EMT phenotype is a common mechanism of resistance to different cancer therapies, including cetuximab (16–18). There is no reference in the literature to a possible interplay between the transcription TFAP2A and EMT genes. Since transcriptional factors regulate multiple targets, we also investigate in this study this potential interaction.
To verify our hypothesis, we performed single cell RNA-sequencing (scRNA-seq) to understand how different cell lines and each of their clones respond to a short time course cetuximab therapy. Then, using bulk RNA-sequencing (RNA-seq) and ATAC-seq we investigated the changes to two relevant pathways: TFAP2A and EMT. We verified cell line specific adaptive responses to cetuximab and clear disturbances in both pathways. TFAP2A regulates HNSCC growth in vitro and in its absence cells proliferate less. A potential interplay with the EMT was not verified, suggesting that TFAP2A does not directly regulate this mechanism of resistance. The response to the combination therapy cetuximab + JQ1, although heterogeneous, is more efficient to cell growth control than anti-EGFR block alone suggesting that combined therapies blocking multiple growth factors are beneficial at therapy early stages.
MATERIAL AND METHODS
Cell culture and proliferation assay
UM-SCC-1 (SCC1), UM-SCC-6 (SCC6) and SCC25 cells were cultured in Dulbecco’s Modified Eagle’s Medium (DMEM) and Ham’s F12 supplemented with 10% fetal bovine serum and maintained at 37°C and 5% carbon dioxide. A total of 25,000 cells were plated in quintuplicate in 6-well plates. Cetuximab (Lilly, Indianapolis, IN) was purchased from Johns Hopkins Pharmacy and JQ1 from Selleck Chemicals. All cell lines were treated daily with cetuximab (100nM), JQ1 (500nM), the combination, or vehicle (PBS+DMSO; mock) for 5 days starting 24 hours after seeding. Proliferation was measured using alamarBlue assay (Thermo Scientific), as described by the manufacturer. Briefly, 10% sample volume of alamarBlue reagent was added to each well and fluorescence (excitation 544nm, emission 590nm) was measured after 4 hours of incubation at 37°C. A media only well was used as blank. The treatment and proliferation assays were repeated in 3 independent experiments. To calculate the growth rate we used the formula: 
Where k(0) represents the fluorescence measured for non-treated cells and k(c,t) is the fluorescence measured for cetuximab treated cells (19).
The parental cell lines were authenticated using short tandem repeat (STR) analysis kit PowerPlex16HS (Promega, Madison, WI, USA) through the Johns Hopkins University Genetic Resources Core Facility.
Single cell RNA sequencing (scRNA-seq)
Cetuximab treated and untreated HNSCC cell lines were trypsinized, washed and resuspended in PBS. Cell counts and viability were made using Trypan Blue staining (ThermoFisher) in the hemacytometer. Single cell RNA labeling, library preparations and sequencing were performed by the SKCCC Experimental and Computational Genomics Core using the 10X Genomics Chromium™ Single Cell system and Chromium™ Single Cell 3’ Library & Gel Bead Kit v2 (10X Genomics, San Francisco, CA, USA), following manufacturer’s instructions. An input of 8,700 was used to recover a total of 5,000 cells. Sequencing was performed using the HiSeq platform (Illumina, San Diego, CA, USA) for 2X100bp sequencing and 50,000 reads per cell. Each sample was sequenced in duplicate. Sequences were filtered and aligned using the CellRanger software (10X Genomics). Data normalization, pre-processing, dimensionality reduction (method: UMAP), cell clustering (method: louvain), differential expression analysis and visualization was performed using Monocle 3 alpha (version 2.10.1).
The scRNA-seq data for the cell lines in this study are available from GEO (GSEXXXX).
RNA isolation and bulk RNA-seq
RNA isolation and sequencing were performed for each of the cetuximab and PBS treated cells at the Johns Hopkins Medical Institutions Deep Sequencing & Microarray Core Facility. Total RNA was isolated from at least 1,000 cells collected on 1ml of QIazol reagent (Qiagen, Hilden, Germany), directly from the cell culture plate, following manufacturer’s instructions. The concentration and quality were measured at the 2100 Bioanalyzer (Agilent, Santa Clara, CA, USA) system. An RNA Integrity Number (RIN) of 7.0 was considered as the minimum threshold. Library preparation was performed using the TrueSeq Stranded Total RNAseq Poly A1 Gold Kit (Illumina), according to manufacturer’s recommendations, followed by mRNA enrichment using poly(A) enrichment for ribosomal RNA removal. Sequencing was performed using the HiSeq platform (Illumina) for 2X100bp sequencing. Transcript abundance from the RNA-seq reads was inferred using Salmon (20). To import the transcript abundance from Salmon and export into estimated count matrices we used tximport (21). DESeq2 was used for differential expression analysis between cetuximab and PBS groups.
All RNA-seq data from this study are available from GEO (GSE114375).
Nuclei isolation and chromatin accessibility analysis of the cetuximab treated cells
ATAC-seq library preparation was performed as previously described (22). Cetuximab treated cells and PBS controls were collected after 5 days of treatment (100,000 cells for each group). Briefly, cells were scraped, washed in PBS and lysed. Nuclei tagmentation and adapter ligation by Tn5 was performed using the Nextera DNA Sample Preparation kit (Illumina) and followed by purification with MinElute PCR Purification kit (QIagen), according to manufacturers’ instructions. Transposed DNA fragments were amplified for 5 cycles using the NEBNext Q5 HotStart HiFi PCR Master Mix with regular forward and reverse barcoded primers. Additional number of amplification cycles were determined by quantitative-PCR using the NEBNext HiFi Master Mix, SYBR Green I (Applied Biosystems) and Custom Nextera Primers. The final product was purified with MinElute PCR Purification kit (QIagen) and quality checked on 2100 Bioanalyzer (Agilent). Sequencing was performed using the HiSeq platform (Illumina) for 2X50 bp sequencing with 50 million reads per sample at the Genomic Resources Core Facility.
Sequences quality was assessed using FastQC (23). After adapters trimming with Trim Galore! (version 0.5.0), sequences were aligned with Bowtie2 (version 2.3.2) to the human genome (hg19) (24). Duplicated and mitochondrial reads were removed with Picard Tools (version 2.18) (25), while unmapped and low quality reads were removed with Samtools (version 1.9) (26). MACS2 was used for peaks calling (27). Correlation analysis and differential bound site analysis were performed with DiffBind (28). The annotated differential binding sites were filtered for peaks in promoter regions. Low quality replicates were excluded, as one of the SCC1 untreated replicates.
All ATAC-seq data from this study are available from GEO (GSEXXX).
TFAP2A RNA interference experiments
Cells were transfected with a pool of four siRNA sequences (ON-TARGETplus Human TFAP2A pool, Dharmacon) one day after plating. ON-TARGETplus Non-targeting Pool and ON-TARGETplus GAPD Control Pool were used as negative and positive transfection controls, respectively. Briefly, transfection was performed in serum-free Opti-MEM (Invitrogen) and RNAiMAX Lipofectamine Reagent (Invitrogen). Eight hours after transfection, opti-MEM was replaced with complete medium and cells were incubated overnight at 37°C. Treatment with cetuximab, JQ1, the combination or vehicle was performed daily for 5 days. Transfection efficiency and level of the endogenous gene were monitored by qRT-PCR before and 72h after transfection. Cell proliferation was measured by the alamarBlue assay as described above. Each assay was performed in quintuplicate for each cell line and treatment.
qRT-PCR analysis
Cell lines were lysed directly in the cell culture plate by adding Qiazol reagent (Qiagen) and RNA isolation followed manufacturer’s instructions. Reverse transcription of 300ng total RNA was performed with qScript Master Mix (Quanta Bioscience), following manufacturer’s protocol. Gene expression was determined using TaqMan Universal Master Mix II and TaqMan 20X Gene Expression Assays in a 7900HT equipment (Life Technologies). All assays were quantified in triplicate relative to GAPDH using the 2−Δ ΔCt method.
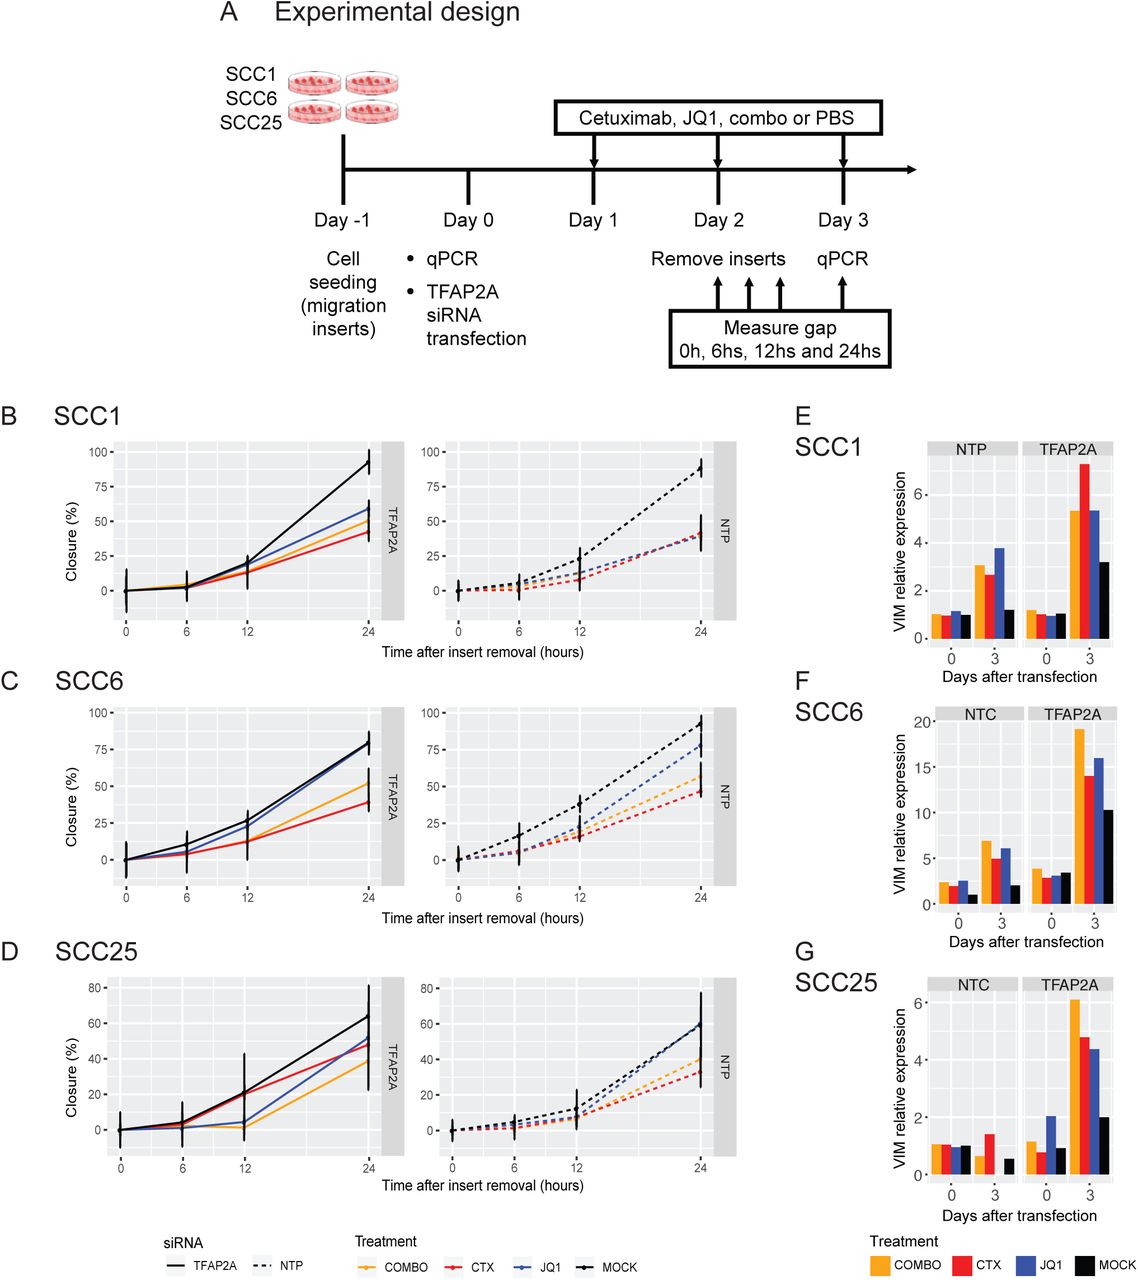
Migration assay
The migration assays were performed in the Culture-Insert 2 Well 24 (Ibidi GmbH, Klopferspitz, Martinsried, Germany). In each insert well 10,000 cells (transfected and not transfected with TFAP2A siRNA) were plated and 24hs after plating treated with cetuximab, JQ1, the combination or vehicle. Once, cells were confluent the inserts were removed and gap closure was measured under a microscope at 0h, 6h, 12h, and 24h. The measurements were made using ImageJ (29) and closure was determined as the ratio between the initial area and the measured area at each time point. Experiments were performed at least three times.
RESULTS
TFAP2A and EMT expression are heterogeneous among cell lines
In order to identify potential precursors of acquired cetuximab resistance, sensitive HNSCC models were used to interrogate the changes induced before resistance developed. Based on previous work demonstrating HNSCC cell lines sensitivity to cetuximab (16,30) and confirmed by proliferation assay (Supplementary Figure 1), we chose three sensitive cell lines: SCC1, SCC6 and SCC25. To verify inter- and intra-cell heterogeneity and how each of the cell clones respond to cetuximab, we performed scRNA-seq. SCC1, SCC6 and SCC25 received cetuximab (treated) or PBS (untreated) and after a total of five days of therapy the cells were collected in single cell suspensions (Figure 1A).

SCC1, SCC6 and SCC25 cell lines were treated with cetuximab or PBS (untreated controls) for five consecutive days after which cells were collected for single cell RNA-seq (scRNA-seq) (A). scRNA-seq analysis demonstrates that each cell line present a specific gene expression profile (B). In response to cetuximab, the SCC6 treated (red) and untread (black) clones separate completely while the SCC1 and SCC25 present some overlap in the distribution regarding the transcriptional profile (C). Inter-cell heterogeneity is more evident for TFAP2A and VIM mRNA levels (D and E), with SCC1 presenting high levels of TFAP2A and no expression of VIM. The co-expression analysis (F) shows that in SCC1 there is no change in the levels of TFAP2A or VIM in response to cetuximab; SCC6 treated cells are VIM+ (orange and purple) while untreated are negative (green and blue) with different status for TFAP2A expression; and most of the SCC25 cells responding with increase in VIM but with some untreated clones presenting the same expression profile for VIM and TFAP2A (purple) and with VIM-clones only detected in the untreated group.
Based on the whole transcriptomic profile, each cell line cluster completely separate from each other (Figure 1B) demonstrating inter-cell line heterogeneity and are a reflect of inter-patient variability. When cells were clustered according to the treatment (cetuximab or PBS), we observe a clear separation between treated and untreated cells in SCC6 (Figure 1C). For SCC1 and SCC25, some treated cells cluster with the untreated (Figure 1C). The clear separation of SCC6 cetuximab and PBS groups is probably associated by the fact that, compared to SCC1 and SCC25, this cell line only responds to anti-EGFR therapy after three days of treatment while the other cell lines respond almost immediately (Supplementary Figure 1).
To investigate the response of potential mechanisms of resistance, we investigated two pathways that were previously described as altered in response to cetuximab while HNSCC cell lines or tumors are sensitive to cetuximab (12,13). We investigated if each cell clone expresses TFAP2A and VIM concomitantly to verify a possible interplay between the pathways both genes are involved. There is also heterogeneity regarding the expression of TFAP2A and VIM. We evaluated the expression of TFAP2A and VIM genes in the individual cells (Supplementary Figure 2) and used the individual markers expression levels to classify each individual as double negative (TFAP2A-/VIM-), TFAP2A positive (TFAP2A+/VIM-), VIM positive (TFAP2A-/VIM+) and double positive (TFAP2A+/VIM+) (Figure 1F). SCC1 cells (cetuximab treated and untreated) show high levels of TFAP2A and no expression of VIM (Supplementary Figure 2, Figure 1D and E) suggesting no influence of cetuximab in these two pathways. SCC6 cells present a definite shift in the expression of VIM with the anti-EGFR blockade, with untreated cells presenting down-regulation when compared to the treated cells independent of the TFAP2A status (Supplementary Figure 2, Figure 1D and F), which can be positive or negative and apparent has no variation as an adaptive response to cetuximab. The majority of SCC25 cells are double positive with or without cetuximab therapy. VIM expression changes with EGFR blockade and most of the treated clones are positive to VIM (double positive) or negative when untreated (TFAP2A positive) (Supplementary Figure 2, Figure 1D and G). Interestingly, a significant proportion of untreated SCC25 cells present the same double positive signature as the ones that received cetuximab. In SCC6 and SCC25, there is evidence that cetuximab is capable of inducing VIM expression and, corroborating the observation from Schmitz et al. (11), that cetuximab induces EMT markers in early on in the course of therapy.
The scRNAseq analysis demonstrates that the transcriptional changes in response to cetuximab are cell type dependent. Those changes are most probably dependent on the initial transcriptional background of each cell. The scRNA-seq also suggests that the TFAP2A expression does not directly regulate the EMT pathway since changes in VIM are not following changes in the levels of the transcription factor.
Cetuximab causes immediate gene expression changes in HNSCC in vitro
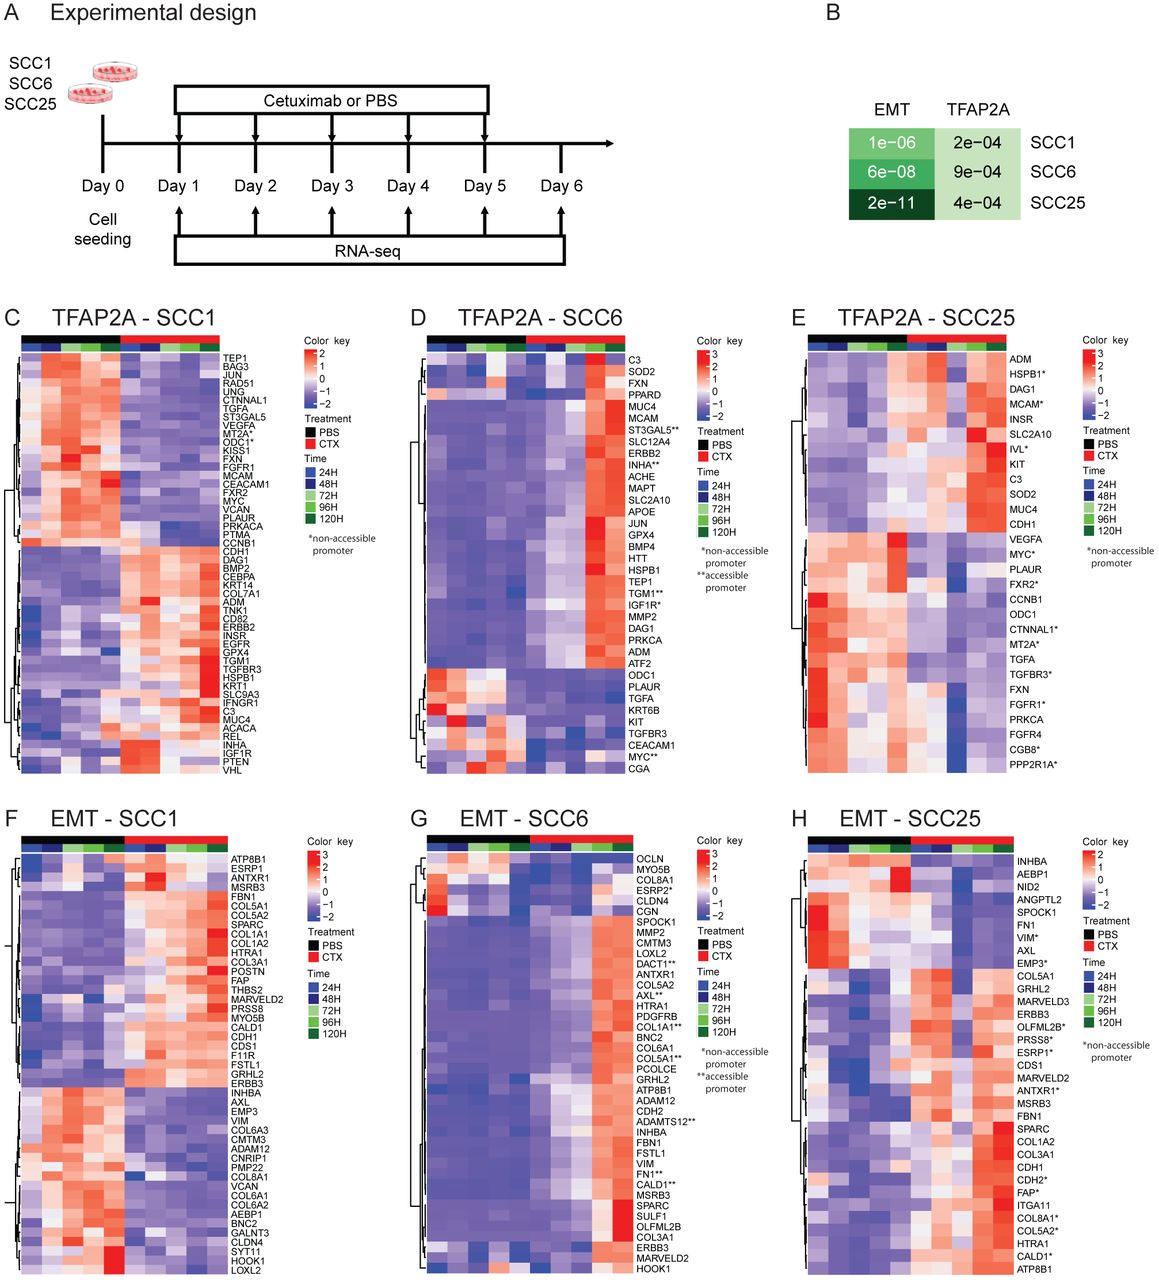
In order to evaluate the timing of the changes in the TFAP2A targets and EMT markers, detected by scRNA-seq, and to interrogate each of the pathway genes individually, we performed daily measurements using bulk RNA-seq. SCC1, SCC6 and SCC25 were treated with cetuximab or PBS for five consecutive days and gene expression was measured daily (Figure 2A).

SCC1, SCC6 and SCC25 cell lines were treated with cetuximab or PBS (untreated controls) for five consecutive days and cells were collected daily for bulk RNA-seq (RNA-seq) (A). Among the genes differentially expressed among all three cell lines as a response to cetuximab therapy the gene set enrichment analysis show significant presence of genes that are TFAP2A targets or that participate in the EMT process (B). When analyzed individually, the TFAP2A and EMT differential expressed genes are specific in each of the cell lines. SCC1 (C and F) and SCC25 (E and H) present changes as soon as 24 hours (1 day) after cetuximab therapy, while in SCC6 (D and G) the changes are only detected at 96 hours (4 days) after cells are treated.
Transcriptional changes induced by cetuximab can be detected genome wide almost immediately after therapy. Differential expression analysis of all time points indicate that hundreds of genes have their transcriptional profile changed as a response to anti-EGFR therapy in all three HNSCC cell lines, with some changes occurring only 24h after cetuximab treatment (Supplementary Figure 3A). In order to investigate the changes in the activity of TFAP2A transcription factor, we followed the expression of its targets identified at the TRANSFAC database (12,13). To analyze the status of the EMT pathway, we analyzed the EMT markers using the signature described by Byers et al. that predicts resistance to anti-EGFR and anti-PI3K therapies (27). When each cell line was investigated separately, the gene set enrichment analysis comparing cetuximab and untreated groups showed that among the differentially expressed genes in SCC1, 55 are TFAP2A targets (p=2.2e-04) and 49 are EMT markers (p=1.1e-04); in SCC6, there 46 genes from each pathway (TFAP2A p=9e-04, EMT p=6e-08); and in SCC25, there are 40 TFAP2A targets (p=4.3e-04) and 46 EMT markers (p=2.2e-11) (Figure 2B). Although there was no variation in the expression of TFAP2A and VIM in SCC1 at the scRNA-seq, there are still significant changes to other markers in both. The cell lines SCC1 and SCC25 present immediate (24h) transcriptional changes to the cetuximab (Figure 2C, F, E and H). SCC6 transcriptional response to anti-EGFR treatment takes longer and most of the changes are noticeable after 96 hours of therapy (Figure 2D and G), which is in agreement with the observed behavior of this cell line to the cetuximab therapy (Supplementary Figure 1).
Chromatin changes can be detected early in the course of cetuximab therapy in vitro
We hypothesized that epigenetic rewiring induced by cetuximab is one of the causes of the adaptive transcriptional changes, due to the short time for the development of genomic alterations. To verify this hypothesis, we measured global chromatin accessibility by ATAC-seq in cells treated with cetuximab and in the untreated controls after five days of therapy (Figure 3A).

ATAC-seq was performed after SCC1, SCC6 and SCC25 were treated for 5 days with cetuximab and also in the untreated (PBS) controls (A). Differential binding analysis show that the promoters accessibility changes in response to 5 days of therapy are capable of separating the cetuximab from the PBS replicates in all three cell lines (B, C and D). With the exception of SCC1, there are enrichment for TFAP2A and EMT promoters among the ATAC-seq peaks in SCC6 and SCC25 (E). The differential binding analysis show that SCC25 is the gene with the highest number of genes with chromatin changes in response to cetuximab (F) and also identified promoters that are changed in more than one cell line (F, underlined).
Cetuximab treated cell lines present significant chromatin changes after only five days of therapy (Supplementary Figure 3B). Differential bound analysis, to identify the accessible protein-DNA binding regions in cetuximab versus untreated groups, show that there are a total of 1,690 binding regions, common to SCC1, SCC6 and SCC25, that have their structure changed as a response to five days of therapy. The unsupervised clustering of these regions that are common to all three cell lines separate the samples that were treated with cetuximab from the untreated controls (Supplementary Figure 3B). These findings suggest that epigenetic rewiring is an early event in response to cetuximab and probably involved in the regulation of some transcriptional changes observed.
The differential binding analysis was then performed for each cell line individually to identify specific DNA accessibility changes as a response to cetuximab (Figures 3B, C and D). Each of the three cell lines, SCC1, SCC6 and SSC25, presents specific chromatin changes that separate the groups of treated and untreated replicates. Analyzing each cell line separately, SCC1, SCC6 and SCC25 show significant promoters reconfiguration as a response to short time therapy with 1,821, 3,057 and 11,402 sites remodeled, respectively (Figures 3B, C and D).
The gene set enrichment analysis identified genes from the TFAP2A and EMT pathways among the promoters that have chromatin structural changes induced by cetuximab. Accessibility to the promoter region during cetuximab treatment in the SCC1 cell line was detected in only four gene promoters from the TFAP2A pathway and no changes in EMT promoters are present (Figure 3E and F). Suggesting that in this cell line chromatin remodeling does not regulate the transcriptional changes in these pathways. A total of eleven promoters from the TFAP2A pathway (p=3e-03, Figure 3E and F) and the same number of EMT gene promoters (p=6e-03, Figure 3E and F) have their chromatin structure changed by the anti-EGFR therapy in SCC6. The SCC25 cell line presents, as a response to cetuximab, chromatin changes in 31 TFAP2A pathway gene promoters (p=0.028, Figure 3E and F) and in 21 EMT promoters (p=2e-03, Figure 3E and F). Interestingly, all changes to the SCC25 binding sites become less accessible when compared to the untreated controls. The ATAC-seq findings suggest that even after a short time exposure of HNSCC cells to cetuximab in vitro, genes from pathways that are associated with acquired resistance, such as TFAP2A and EMT, present remodeling of binding sites that could potentially result in altered transcription factors binding.
The genes with transcriptional and chromatin alterations in response to short time treatment with cetuximab are marked with one (non-accessible after cetuximab) or two stars (accessible after cetuximab) in the RNA-seq heatmaps in Figure 2. As would be expected, the correlation between accessibility and expression is not true for all genes. Although a few relevant genes, such as AXL (Figure 2D), known to be up-regulated in acquired resistance to different targeted agents, presents open chromatin at their promoter combined with up-regulation in cetuximab treated cells. This is an indication that chromatin remodeling in the early course of treatment is a possible driver of resistance.
In both analyses, chromatin accessibility and gene expression, it is important to notice that each cell line presents their specific changes in response to cetuximab. Since each of the cell lines are derived from three independent patients with HNSCC that present inter-tumor heterogeneity these differences are expected and most probably represent in vitro the different changes that would be found in patients’ samples.
TFAP2A controls HNSCC proliferation in vitro
The role of TFAP2A in HNSCC is poorly characterized. This transcription factor regulates the expression of several growth factor receptors, including EGFR, HER2, TGFBR3, FGFR1, IGFR1 and VEGF (12). In order to investigate the role of TFAP2A in HNSCC cell proliferation in vitro, we used siRNA assay for gene silencing and measured growth rates of all cell lines. Following transfection, the cells were treated with cetuximab for five days, and proliferation was measured daily (Figure 4A). All siRNA transfected cell lines present lower growth rates when compared to the parental cell lines (Figure 4B, C and D, black full and dashed lines). The effect of TFAP2A is more prominent in SCC1 and SCC25 if compared to SCC6. This is probably related to the fact that both cell lines present TFAP2A expression in most of the cell clones (Figure 1D).

Functional validation of the role of TFAP2A in HNSCC in vitro was evaluated by siRNA gene silencing in SCC1, SCC6 and SCC25. Cells were treated with cetuximab, JQ1, combination (combo) or vehicle (mock) for five days and the impact of gene knockdown and therapy was determined by measuring proliferation rates (A). Transfected groups (full lines, left) were compared to the groups with normal levels of TFAP2A (dashed lines, right - NTC) (B, C and D). In all cell lines, TFAP2A knockdown induce lower proliferation rates (black lines) at different levels depending on the cell. Cetuximab treatment (red lines) present a synergistic effect but JQ1 (blue lines) efficacy is even greater in reducing cell growth. Little effect is noted with the combination (orange lines, COMBO) when compared to the effects of JQ1 alone.
Combined with the effects of TFAP2A transient knock-down, we investigated the role of cetuximab and JQ1 on cell growth. JQ1 is a bromodomain inhibitor that blocks the transcription of cell growth regulators (e.g., c-Myc) and multiple RTKs, and was previously shown to delay acquired cetuximab resistance in combination treatment in HNSCC patient derived xenograft models. Cetuximab, JQ1 or the combination (combo) was added to cell culture media once cells were transfected with TFAP2A siRNA, and proliferation was measured daily (Figure 4A).
Cetuximab therapy potentiates growth inhibition in the absence of TFAP2A (Figure 4 B, C and D, red full and dashed lines) with synergistic effect potency dependent on the cell line. Since SCC1 presents very similar TFAP2A expression in treated and untreated cell clones (Figure 1D), which indicates that this gene is not altered as a response to cetuximab, the effect gene knockdown with anti-EGFR therapy is not as significant as observed in SCC6 and SCC25. A stronger effect on proliferation control was observed with JQ1 treatment (Figure 4 B, C and D, blue full and dashed lines), most probably due to the silencing of another proliferation factor (c-Myc) and/or RTKs. Interestingly, the combination therapy of cetuximab and JQ1 does not provide a strong synergistic effect (Figure 4 B, C and D, orange full and dashed lines).
These results indicate that in HNSCC in vitro, TFAP2A is an essential regulator of cell. The combined TFAP2A knock-down with cetuximab and JQ1 therapy presents a stronger effect on slowing cell growth and suggests that bromodomain inhibitors are a potential option for combined therapy in HNSCC.
TFAP2A loss is associated with an increase in EMT markers expression but not with HNSCC migration in vitro
TFAP2A encodes a transcription factor that regulates the expression of numerous genes, including growth factor receptors, and might also be involved in regulating the expression of EMT markers. To investigate its role in the EMT pathway, we performed the scratch assay after SCC1, SCC6 and SCC25 cells were transfected with TFAP2A siRNA. The cells were seeded in the cell migration inserts (Ibidi) and after overnight incubation were transfected with TFAP2A siRNA. Treatment with cetuximab, JQ1, combo or vehicle started 24h later. Once confluence was reached (48h after transfection) the insert was removed, and gap closure was measured at the moment of removal and after 6, 12 and 24 hours (Figure 5A).
To further evaluate the interplay between TFAP2A and EMT, cells transfected with siRNA against TFAP2A and treated with cetuximab, JQ1, combination (combo) or vehicle (mock) were used for a migration assay. Migration was measured for a total of 24 hours immediately after insert removal (A). No significant changes in migration was noted when comparing the transfected (full lines, left) and non-transfected (dashed lines, right - NTP) SCC1, SCC6 and SCC25 cells and different treatment groups (B, C and D). Although migration changes were not observed, there are changes in VIM expression as response to siRNA silencing and the different therapies in all three cell lines (E, F and G).
Lack of TFAP2A does not significantly impact SCC1 and SCC6 migration when compared to the parental cells (Figure 5B and C, black full and dashed lines). Comparing the SCC1 and SCC6 parental cells with the transfected clones, the different therapies do not present a significant impact on migration (Figure 5B and C) in the absence of TFAP2A. In SCC1, this is expected since VIM expression was not detected by scRNA-seq analysis (Figure 1D) and together with the migration assay suggests that the EMT pathway is not a relevant adaptive response to cetuximab. The observed shift on VIM expression after cetuximab treatment in SCC6 (Figure 1D) shows that an adaptive response involves the activation of the EMT process. The lack of migration changes in the presence of gene expression shift is probably because the morphological changes require more time to occur as compared to expression. Silencing TFAP2A has no effect on the migration capacity of SCC25 (Figure 5D, black full and dashed lines). Cetuximab therapy in cells lacking TFAP2A induces faster migration when compared to the treated cells with normal levels of the gene (Figure 5D, red full and dashed lines). Lack of TFAP2A combined with JQ1 results in slightly less migration when compared to non-transfected cells (Figure 5D, blue full and dashed lines). The changes in migration are not significant but suggest that in SCC25, cetuximab can induce cell motility while JQ1 has inhibitory activity. This is corroborated by the fact that when combined with JQ1, the anti-EGFR therapy does not affect cell motility (Figure 5D, orange full and dashed lines).
These observations suggest no effect of TFAP2A in cell migration and consequently in the EMT process, which corroborates our scRNA-seq observations. The trends in cell migration are apparently a combination of therapy (cetuximab or JQ1) with TFAP2A expression, suggesting that the transcription factor alone is not enough to alter cell migration.
DISCUSSION
Using a single cell and bulk multi-omic approach, we investigated the early responses to cetuximab in HNSCC in vitro models to identify the gene expression and epigenetic mechanisms that are potential drivers of resistance. Treating three HNSCC cell lines for a short time period we were able to demonstrate that transcriptional and chromatin rewiring are early events as a response to therapy and that they happen globally and include genes previously described to be involved in resistance to cetuximab.
Approximately 90% of HNSCC present high expression of EGFR protein, and cetuximab seemed to be a reasonable targeted therapy for these tumors (28). However, just a small fraction of patients respond to cetuximab, and virtually all responders develop acquired resistance (29). To prolong disease control, it is crucial to identify the changes related to resistance while the tumor is still responsive to cetuximab. There are no biomarkers to predict the response and the mechanisms of resistance are poorly characterized in HNSCC. In colorectal cancers, EGFR and KRAS mutations are a frequent finding in acquired cetuximab resistance but are very rare events in HNSCC suggesting that other mechanisms, such as epigenetic changes, drive the transcriptional signatures of resistance (30,31). In a recent time course study to investigate mechanisms of acquired cetuximab resistance in HNSCC, we found that an essential driver of resistance to anti-EGFR targeted therapies, FGFR1, is epigenetically regulated during chronic exposure to cetuximab and provide strong evidence of that epigenetic alterations can drive acquired resistance (10).
In the current study, we investigated three HNSCC cell lines (SCC1, SCC6 and SCC25) and their response to cetuximab during a short time period of treatment (five days). We initially performed scRNA-seq to identify cell specific transcriptional changes induced by EGFR blockade. Even the untreated cells demonstrate specific transcription profiles that prove inter-cell lines heterogeneity. This observation is evidence that cell lines can mimic inter-patients heterogeneity. We observed that while VIM expression presents a shift after cetuximab therapy in SCC6 and SCC25, it does not have the same behavior in SCC1. TFAP2A is not affected by anti-EGFR therapy in any of the HNSCC in vitro models. Our scRNA-seq observations are suggestive that there is no interplay between TFAP2A and EMT pathways in response to cetuximab.
We further performed a short time course experiment to measure the transcription changes induced by cetuximab in vitro to verify the specific cell changes in the TFAP2A targets and EMT genes. Although we did not observe changes in TFAP2A and VIM in SCC1, other genes from these pathways are altered only 24h after treatment suggesting that other markers respond with changes in expression to cetuximab. Each cell line presents specific changes to genes from the pathways interrogated. SCC1 and SCC25 present changes after only 24h of therapy while in SCC6 those changes are noticed within 96h of therapy. These results reflect the initial observation in growth rates under cetuximab therapy, where SCC6 presents a resistant-like behavior with decreased proliferation only after 96h under cetuximab (Supplementary Figure 1) or stable growth with therapy (Figure 4C). We have previously observed that anti-EGFR targeted therapy in vitro is capable of inducing immediate transcriptional changes in the HaCaT keratinocyte cell line model with constitutive EGFR activation (10). Here we corroborate the observation by showing that two HNSCC cell lines also present immediate changes to cetuximab and in pathways relevant for resistance. Altogether, these are evidence that adaptive responses to targeted therapies that will result in a resistant signature can start early in the course of therapy and with cancer cells still sensitive to the therapy.
We have previously shown that while SCC25 acquire cetuximab resistance due to chronic exposure (32), the transcriptional changes occur a few weeks prior to the promoter hyper- or hypomethylation, that are detected when cells are already resistant. Here, we investigated the hypothesis that chromatin remodeling occurs prior to methylation, while the cells are still sensitive to the therapy, and probably are associated with the transcriptional changes. After only five days of anti-EGFR blockade, chromatin structure differs between cetuximab and untreated groups in the three HNSCC cell lines. With that we hypothesize that the events resulting in acquired resistance go from chromatin changes in the early stages of therapy and reflecting in transcriptional alterations to overcome EGFR inhibition, that are finally stabilized by gain or loss of methylation of the relevant resistance signaling drivers. It was previously shown in vitro that CDKN2A silencing initially happens through histone modifications followed by loss of gene expression, and then by promoter methylation to lock the repressive state (33). Together, both findings suggest that while chromatin rewiring results in gene expression changes, this epigenetic state is still reversible and require DNA methylation to be stabilized. It is critical to determine the timing in treatment that reversible epigenetic alterations develop to allow alternative therapies to be effective. Short term exposure to targeted therapies can induce reversible chromatin changes that will lead to resistance, while chronic exposure induces DNA methylation changes that are more steady and observed in stable resistant states (34).
Among the genes going through chromatin remodeling and transcriptional changes in response to cetuximab, some are participating in pathways previously associated with acquired resistance, such as TFAP2A and EMT. TFAP2A encodes a transcription factor that binds to growth factor receptors and is most probably up-regulated to overcome the lack of EGFR activity. One proof of that is our previous observation that as a response to anti-EGFR therapy, TFAP2A mRNA level is up-regulated with only 24h of therapy in vitro (10). The TFAP2A has dual-function and can play a role as a tumor suppressor gene (transcriptional repressor) or oncogene (transcriptional activator) depending on the tumor type. Although a previous study showed that in vitro down-regulation of TFAP2A in HNSCC is associated with decreased proliferation (35), another study pointed to the same direction as our findings. In nasopharyngeal carcinoma, TFAP2A silencing in vitro and in vivo results in slower cancer cell proliferation and patients with high tumor levels of the gene present poorer survival (36). TFAP2A up-regulation is a feature of other tumor types such as neuroblastoma, pancreatic cancer and acute myeloid leukemia (31–33). In our in vitro models, TFAP2A knock-down resulted in slower cell growth showing the relevance of this transcription factor to HNSCC proliferation in vitro. This finding together with the observation that cetuximab has a synergistic effect is evidence that TFAP2A downstream targets could be new therapeutic targets for combination approaches that will prolong disease control.
The EMT process has also been previously associated with acquired resistance to anti-EGFR targeted therapies (7,18,34,35). We found a significant number of EMT gene promoters among those undergoing remodeling after five days of therapy in SCC6 and SCC25. Among the EMT genes up-regulated by EGFR blockade are a few collagenases, that are most probably related to providing tumor cells ability to move in the extracellular matrix. One interesting finding is that the gene AXL is up-regulated after 96h of cetuximab therapy in SCC6 cells and this is also correlated with a more accessible promoter in treated cells. AXL is a receptor tyrosine kinase known to mediate resistance to cetuximab and is possibly an alternative mechanism HNSCC cells in vitro are activating to keep proliferating in the absence of EGFR (36–38). This observation suggests that early chromatin modifications are involved in the development of acquired cetuximab resistance and that they can be detected while the tumor is sensitive to cetuximab.
Since the up-regulation of other RTKs, such as AXL, is a common finding in acquired anti-EGFR resistance, we tested a combination treatment to evaluate a possible synergistic effect on controlling cell growth. JQ1 is a bromodomain inhibitor that preferentially binds to BRD4, a protein with high affinity for acetylated histone tails, which represses transcription of its targets (39,40). Among these target genes are RTKs known to be up-regulated as a resistance mechanism to anti-EGFR therapies (41,42). In this scenario, BRD4 inhibition seems a reasonable approach since it acts as a “multi-targeted” therapy. Also, successful results in delaying acquired cetuximab resistance were shown when JQ1 or BRD4 knockdown were used in combination with cetuximab in HNSCC cell models or patient derived xenografts (41). In our short time course model, we could not determine the time of resistance development but we observed the inhibitory effects of JQ1. JQ1 has stronger effect than cetuximab in controlling HNSCC proliferation in vitro and the addition of cetuximab has diverse impact in reducing cell growth depending on the cell line with the strongest synergism observed in SCC6 cells. Although including cetuximab to the JQ1 therapy seems to have little effect on reducing proliferation, the combination potentially has great impact on disease control by targeting various RTKs at the same time and delays acquired resistance by reducing alternative growth pathways tumor cells can use to overcome EGFR inhibition. However, JQ1 is known to have a short half-life which reflects in the necessity of elevated doses not well tolerated by cancer patients (43,44). Since there are currently other bromodomain inhibitors being evaluated in clinical trials with less toxicity, further studies are necessary to identify agents that have a similar effect when combined with cetuximab in HNSCC.
Overall, our study demonstrates that transcriptional and chromatin changes induced by cetuximab therapy are early events that can be detected before acquired resistance develops. Here, we focused on only two pathways, TFAP2A and EMT, previously described to be involved in resistance to cetuximab and other anti-EGFR therapies (10,11), but our findings suggest that other pathways involved in resistance should be evaluated in short time course experiments to verify if transcriptional shifts and chromatin rewiring are also immediate responses to targeted therapies and that are potential drivers of resistance. Also, the use of JQ1 demonstrates that a drug targeting multiple RTKs is effective and could be an alternative to overcome resistance and prolong disease control.
Another major finding is how inter-cell heterogeneity can induce different changes to the same mechanisms of resistance to targeted therapies. Although we observe alterations in both TFAP2A and EMT pathways, the genes affected are different among cell lines. This is highlighted in the scRNA-seq analysis in which the gene expression changes are not the same among the cells. The single cell approach also demonstrates that there is no causal relationship between the pathways. These inter-cell line heterogeneity mimics patients inter-tumor heterogeneity and complicate the decision of which alternative targeted therapies are the most appropriate for each individual case. Alternatives like JQ1, that result in the inhibition of multiple drivers of resistance, are promising and would allow clinical decisions to be made without submitting patients to the expensive costs of genetic and genomic tests. The use of in vitro and in vivo preclinical models would be sufficient to identify the relevant pathways and the most proper “multi-targeted” therapies to be used.
FUNDING
This work was supported by NIH Grants R01CA177669, R21DE025398, P30CA006973, R01DE017982, SPORE P50DE019032, and the Johns Hopkins University Catalyst Award.
DATA AVAILABILITY AND MATERIALS
Unless otherwise specified, all genomics analyses were performed in R and code for these analyses is available from https://sourceforge.net/ (information to be updated upon publication). All transcriptional and epigenetic data of the cell lines from this paper have been deposited in GEO (information to be updated upon publication).
AUTHOR’S CONTRIBUTIONS
LTK, DAG, and EJF planned, designed and wrote the manuscript with input from all authors. LTK, FZ, JA, VY and EJF contributed to the development of methodology. LTK, MC, DAG and EJF performed analysis and interpretation of data (e.g. computational analysis). LTK, FZ, JAM VY and DAG participated in development of methodology and provided technical and material support. All authors participated in the review and/or revision of the manuscript. All authors discussed the data and contributed to the manuscript preparation. DAG and EJF instigated and supervised the project. All authors read and approved the final manuscript.
ACKNOWLEDGEMENTS
We thank the SKCCC Experimental and Computational Genomics Core, the JHMI Deep Sequencing & Microarray Core and the Genomic Resources Core Facility (JHU) on performing and providing advice on scRNA-seq, RNA-seq and ATAC-seq, respectively; Winston Timp for advice on the ATAC-seq library preparations; David Mohrs for advice on experimental design.
Footnotes
↵* These authors share senior authorship.
Luciane T. Kagohara ltsukam1{at}jhmi.edu
Fernando Zamuner fzamune1{at}jhmi.edu
Michael Considine mconsid3{at}jhmi.edu
Jawara Allen jallen66{at}jhmi.edu
Srinivasan Yegnasubramanian syegnasu{at}jhmi.edu
Daria A. Gaykalova dgaykal{at}jhmi.edu
Elana J. Fertig ejfertig{at}jhmi.edu
Financial support: This work was supported by NIH Grants R01CA177669, R21DE025398, P30CA006973, R01DE017982, SPORE P50DE019032, and the Johns Hopkins University Catalyst Award.
Conflict of interest: The authors declare no potential conflicts of interest.
REFERENCES


