

Abstract
Background The Chinese razor clam, Sinonovacula constricta, is one of the commercially important marine bivalves with deep-burrowing lifestyle and remarkable adaptability of broad-range salinity. Despite its economic impact and representative of the less-understood deep-burrowing bivalve lifestyle, there are few genomic resources for exploring its unique biology and adaptive evolution. Herein, we reported a high-quality chromosomal-level reference genome of S. constricta, the first genome of the family Solenidae, along with a large amount of short-read/full-length transcriptomic data of whole-ontogeny developmental stages, all major adult tissues, and gill tissues under salinity challenge.
Findings A total of 101.79 Gb and 129.73 Gb sequencing data were obtained with the PacBio and Illumina platforms, which represented approximately 186.63X genome coverage. In addition, a total of 160.90 Gb and 24.55 Gb clean data were also obtained with the Illumina and PacBio platforms for transcriptomic investigation. A de novo genome assembly of 1,340.13 Mb was generated, with a contig N50 of 689.18 kb. Hi-C scaffolding resulted in 19 chromosomes with a scaffold N50 of 57.99 Mb. The repeat sequences account for 50.71% of the assembled genome. A total of 26,273 protein-coding genes were predicted and 99.5% of them were annotated. Phylogenetic analysis revealed that S. constricta diverged from the lineage of Pteriomorphia at approximately 494 million years ago. Notably, cytoskeletal protein tubulin and motor protein dynein gene families are rapidly expanded in the S. constricta genome and are highly expressed in the mantle and gill, implicating potential genomic bases for the well-developed ciliary system in the S. constricta.
Conclusions The high-quality genome assembly and comprehensive transcriptomes generated in this work not only provides highly valuable genomic resources for future studies of S. constricta, but also lays a solid foundation for further investigation into the adaptive mechanisms of benthic burrowing mollusks.
Introduction
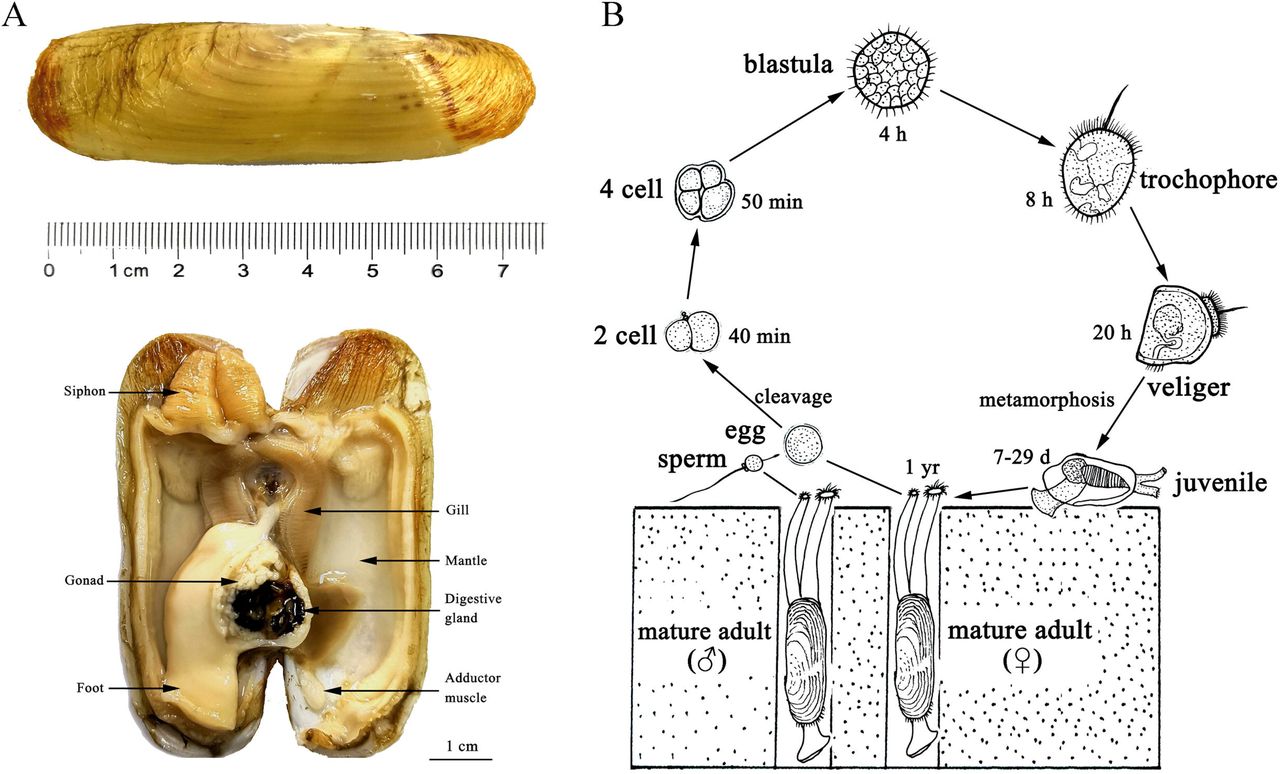
The Chinese razor clam Sinonovacula constricta (Lamarck 1818) is a member of the Solenidae family of bivalve molluscs, recognizing for its straight razor-like shape and fragile shells (Figure 1A). It is widely distributed in the intertidal zone along the west Pacific Ocean and engages in a pelago-benthic life cycle (Figure 1B). As adaptation to a deep-burrowing lifestyle, the razor clam is characterized by smooth shells, muscular foot, and elongated siphons (Figure 1). Benefit from its relatively short production cycle and high productive efficiency, the razor clam has become one of the four most important maricultured bivalve species (together with oyster, scallop, and Venerupis spp.) in China, Japan, and Korea, with over 800,000 metric tons of production in 2016 (FAO, 2018).

A. The appearance and anatomic structures of an adult razor clam. B. A pelago-benthic life cycle of the razor clam.
As living in estuarine and intertidal region, the razor clam faces tremendous exposure to extreme environmental stresses such as drastic salinity fluctuation, highly variable temperature, high concentration of ammonia nitrogen and hydrogen sulfide. Unlike oysters, mussels and most clams with thick and sealed shells for protecting their soft bodies, the razor clam with two thin and unclosed shells has chosen a survival strategy of deep-burrowing lifestyle with high tolerance of a broad range of salinities (5-45‰), making it an ideal model to investigate the adaptive mechanisms of deep-burrowing lifestyle. Despite its economic impact and representative of the less-understood deep-burrowing bivalve lifestyle, there are few genomic resources for exploring its unique biology and adaptive evolution. Here, we generated the high-quality chromosomal-level genome assembly and comprehensive transcriptomes of S. constricta and investigated the transcriptomic changes under different environmental stresses. These genomic resources will lay a prime foundation for future studies of its lifestyle-related adaptive evolution and genetic improvement in commercial breeding programs.
Genomic DNA preparation, PacBio and Illumina sequencing
An individual S. constricta was collected from the brood stock at the genetic breeding research center of Zhejiang Wanli University. Genomic DNA was extracted from muscle tissues using a phenol-chloroform method as described in the protocol (Green and Sambrook, 2012). High molecular weight genomic DNA was sheared into fragments of ~30 kb using a Covaris ultrasonicators (Covaris, Woburn, MA, USA). The fragments were enzymatically repaired and converted into SMRTbell™ template library following the manufacturer’s instructions. Size-selection was performed to enrich the DNA fragments longer than 10 kb for sequencing on a Pacific Biosciences (PacBio) Sequel Single Molecule Real Time (SMRT) platform. The genomic library was sequenced in 6 cells, generating 10,549,576 subreads with a N50 length of 13,619 bp, and accounting for a total of 101.79 Gb. A paired-end Illumina library with an insert size of 300 bp were prepared with an Illumina Genomic DNA sample Preparation kit and sequenced on an Illumina Xten system, yielding a total of 129.73 Gb reads with an insert size of 350 bp (Supplementary Table S1).
Estimation of the genome size and sequencing coverage
The Illumina short reads were first trimmed to remove adaptors and reads with more than 10% ambiguous or more than 20% low-quality bases using Trimmomatic (Bolger et al., 2014). The distribution of 17-mer frequency was estimated using the clean reads. A total of 1010 k-mer was identified with the peak depth of coverage being 80. Based on the formula: genome size = k-mer number/peak depth (Varshney et al., 2011), the genome size of S. constricta was estimated to be 1,244.27 Mb, with a heterozygous ratio of 1.53% and repeat rate of 53.12% (Supplementary Figure S1).
De novo genome assembly and quality assessment
PacBio long reads were corrected and assembled using the Falcon package (Chin et al., 2016). Briefly, all the raw reads yielded by Pacbio platform were aligned to each other to identify overlaps with DALIGNER. The overlap data and raw subreads were then processed for consensus calling. After the error-correction, overlaps were detected in the preassembled error-corrected reads and used to construct a directed fragment assembly string graph. Contigs were constructed by finding the paths from the string graph. The consensus calling of preceding assembly was performed with Quiver. Subsequently, the paired-end clean reads yielded by Illumina platform were aligned to polish the assembly using Pilon (Walker et al., 2014). The resulting assembly consisted of 10,981 contigs, comprising 1,331.97 Mb with a contig N50 of 678,857 bp and GC contents of 35.46% (Table 1).
Statistics of the genome assembly of Sinonovacula constricta
To assess the integrity of the genome assembly, Illumina short-insert library reads were mapped to the contigs using BWA (version 0.6.2). In summary, 88.90% of the assembled genome sequences were covered by 93.93% of the total reads (Supplementary Table S2). The genome completeness was also evaluated using both Core Eukaryotic Genes Mapping Approach (CEGMA) analysis (Parra et al., 2007) and Benchmarking Universal Single-Copy Orthologs (BUSCO version 3) analysis (Waterhouse et al., 2017). The CEGMA analysis identified 227 of the 248 core eukaryotic genes (91.53%), and the BUSCO analysis unveiled 868 of the 978 near-universal single-copy metazoan orthologs (88.7%), indicating a high integrity of the genome assembly (Supplementary Table S3 and S4).
Illumina transcriptome sequencing and analysis
Transcriptomic samples from different developmental stages and different adult tissues were collected and sequenced for genome annotation. Embryos at four developmental stages (eggs, four cells, blastulae, gastrulae), and larvae at four developmental stages (trochophore larvae, D-shaped larvae, umbo larvae, and juvenile) were collected at the hatchery of genetic breeding research center of Zhejiang Wanli University. Artificial fertilization and larval culture were performed as previously described (Dong et al., 2012). For each developmental stage, over 1,000 individuals were collected for RNA extraction. Eight tissues (Figure 1A), including gill, digestive gland, foot, mantle, adductor muscle, siphon, gonad (testis and ovary) were dissected from one to three adult individuals and stored at −80°C after flash frozen in liquid nitrogen.
Transcriptomic samples under salinities of 3‰, 25‰, and 38‰ were collected and sequenced to identify genes and pathways involved in salt tolerance. The S. constricta were subjected to salt stress for 16 hours under 22°C at extreme concentration of low-salinity (3‰) and high-salinity (38‰) with the control concentration of normal-salinity (25‰). Three replicate tanks for each group were set and each replicate included 10 individuals. For the low-salinity group, the salinity was deceased 3‰ per hour though pouring into fresh water to target salinity of 3‰, and then maintained for 16 hours. For the high-salinity groups, the salinity was raised 2‰ per hour though pouring into artificial sea water to target salinity of 38‰, and then maintained for 16 hours. Gills were dissected from three individuals of each replicate and stored at −80°C.
Total mRNA was extracted from all the collected samples with TRIzol reagent (OMEGA, America) following the manufacturer’s instructions. A paired-end Illumina library was constructed for each sample with an insert size of 300 bp and sequenced on an Illumina X Ten system. Around 5-7 Gb of paired-end raw reads were yielded for each sample. Clean reads were obtained by removing reads containing adapter, reads containing ploy-N and low-quality reads by Trimmomatic (Bolger et al., 2014) (Supplementary Table S5). The clean reads were aligned to the indexed S. constricta reference genome using Hisat2 version 2.0.5 (Kim et al., 2015). The clean reads in the samples of different adult tissues and salt stress were mapped onto the reference genome with high proportion of around 70-80%, while samples of different development stages with relative low proportion because of mixed thousand individuals increasing the high SNP heterozygosity (Supplementary Table S6). The featureCounts version 1.5.0 (Liao et al., 2014) was used to count the reads numbers mapped to each gene and the gene expression level was calculated as FPKM (Fragments Per Kilobase of transcript sequence per Millions base pairs) for each gene.
The identification of differentially expressed genes (DEGs) between different salinity groups was performed using the DESeq2 R package version 1.16.1 with an adjusted P-value <0.05 (Love et al., 2014). The numbers of up- and down-regulated DEGs were 462 and 655 between the high-salinity group versus the normal-salinity group, respectively while the numbers of up- and down-regulated DEGs were 898 and 826 between the low-salinity group versus the normal-salinity group, respectively (Supplementary Figure S2). Gene Ontology (GO) enrichment analysis of DEGs was implemented by the clusterProfiler R package with corrected P-value <0.05 considered significantly enriched GO terms (Yu et al., 2012). The clusterProfiler R package is also used to test the statistical enrichment of DEGs in KEGG pathways (Yu et al., 2012). The GO enrichment results demonstrated that the DEGs were significantly enriched in the biological processes of transmembrane transport (GO:0055085) and aminoglycan metabolic process (GO:0006022) and the molecular functions of transmembrane transporter activity (GO:0022857) and (Supplementary Figure S3). The KEGG pathway enrichment results indicated that the DEGs were significantly enriched in amino acid metabolic pathways such as glycine, serine and threonine metabolism, and arginine and proline metabolism, and the energy metabolic pathways such as glycolysis/gluconeogenesis and citrate cycle (Supplementary Figure S4).
Full-length transcriptome sequencing and analysis
Full-length RNA sequencing was also performed using the mixed RNAs from the samples of eight development stages and eight adult tissues. Three libraries with different insert lengths, e.g. 1-2k, 2-3k, and 3-6k, were constructed and sequenced on a PacBio Sequel platform. A total of 1,064,194 post-filter polymerase reads were obtained from 7 SMRT cells, including 688,944 full-length non-chimeric reads (Supplementary Table S7). The full-length RNA transcriptomic analysis was performed with the SMRT Link v4.0.0 software suite (https://www.pacb.com/support/software-downloads). After redundant sequences clustering using the ICE (Iterative Clustering and Error correction) algorithm, consensus sequences building using the pbdagcon tool with DAGCon (Directed Acyclic Graph Consensus) algorithm, and consensus sequence polishing with Quiver, a total of 61,620 high-quality (>0.99) and 358,297 low-quality (<0.99) transcript sequences were obtained. Then, the transcript sequences were polished and corrected using Illumina reads with LoRDEC (Salmela and Rivals, 2014). Finally, the corrected transcripts were further clustered with CD-HIT (version 4.6) (Li and Godzik, 2006), resulting in 75,225 Unigenes and 276,484 transcript isoforms. The full-length transcripts were further used to annotate the protein-coding genes in the genome as the direct evidences. The statistical information for full-length transcriptome analysis is listed in Supplementary Table S7.
Repetitive sequence annotation
Repetitive sequences in the genome assembly were identified through ab initio prediction and homology-based searches. RepeatScout (version 1.0.5) and Repeat Modeler version 1.0.11 (http://www.repeatmasker.org) were used for de novo identification of repeat families in the S. constricta genome. Full length long terminal repeat (LTR) retrotransposons were also identified using the LTR-finder (version 1.0.2) (Xu and Wang, 2007) with the parameters “-E -C”. Tandem Repeats Finder (TRF version 4.09) (Benson, 1999) was used to screen tandem repeats with the parameters “match=2, mismatching penalty=7, indel penalty=7, match probability=80, indel probability=10, minimum alignment score=50, maximum period size=500”. The predicted repetitive sequences along with the RepBase database (Bao et al., 2015) were used for homology-based searches using Repeatmasker (version 4.5.0) with the parameters “-a -nolow -no_is -norna -parallel 32 -small -xsmall -poly -e ncbi -pvalue 0.0001” (Tarailo-Graovac and Chen, 2009).
Finally, a total of 675,404,889 bp repetitive sequences were identified, accounting for 50.71% of the assembled genome (Table 2), which is consistent with our genome survey result of 53.12%. Repetitive sequences were dominated by tandem repeats (15.39%) and followed by DNA transposons (14.38%) and LTR retrotransposons (10.84%) (Table 2).
Statistics of the repetitive sequences
Protein-coding gene prediction and annotation
Gene annotation was performed based on de novo prediction, homology-based searches, and transcriptome assisted methods. Protein sequences of Yesso scallop (Patinopecte yessoensis), Pacific oyster (Crassostrea gigas), owl limpet (Lottia gigantea), octopus (Octopus bimaculoides), leech (Helobdella robusta), nematode (Caenorhabditis elegans), fruit fly (Drosophila melanogaster), sea urchin (Strongylocentrotus purpuratus), ascidian (Ciona intestinalis), Florida lancelet (Branchiostoma floridae), and human (Homo sapiens) were downloaded from NCBI and aligned to the genome assembly using TBLASTN with the parameters “-evalue 1e-5”. The gene structures were predicted with GeneWise (version 2.4.1) (Doerks et al., 2002). The Illumina RNA-seq reads of the eight tissues and eight developmental stages were aligned to the genome assembly using Tophat (version 2.1.1) (Trapnell et al., 2009). Cufflinks (version 2.1.0) (Trapnell et al., 2010) was used to generate gene models with the parameter “-multi-read-correct”. The resulting GTF file along with the PacBio Iso-seq transcripts was utilized to model gene structures with the PASA pipeline (version 2.0.2) (Haas et al., 2008).
Five de novo gene prediction packages, including Augustus (version 2.5.5) (Stanke et al., 2006), glimmerHMM (version 3.01) (Majoros et al., 2004), SNAP (version 2006-07-28) (Leskovec and Sosic, 2016), Geneid (version 1.4) (Parra et al., 2000), and Genscan (version 3.1) (Burge and Karlin, 1997) were used to predict genes with the repeat-masked genome sequences by default settings. All the gene model evidences were integrated using EVidenceModeler (version 1.1.1) (Haas et al., 2008). Finally, 26,273 protein-coding genes were identified in the S. constricta genome (Supplementary Table S8).
The functional annotations were performed by aligning the predicted protein sequences to public databases including KEGG, SwissProt and NCBI-NR databases using BLASTP with the E-value threshold of 1e-5. InterProScan (v.4.8) (Jones et al., 2014) was also used to identify motifs and domains by searching the Pfam, InterPro and Gene Ontology (GO) databases. Taken together, 26,140 (99.5%) of the 26,273 genes could be annotated by at least one database (Table 3).
Statistics of gene annotation to different databases
Noncoding RNA prediction and annotation
The noncoding RNA genes, including miRNAs, rRNAs, snRNAs, and tRNAs, were annotated in the S. constricta genome. tRNAs were predicated by tRNAscan-SE 2.0 (Lowe and Chan, 2016) with eukaryote parameters. The miRNAs and snRNAs were screened using INFERNAL 1.1.2 against the Rfam database (version 14.1) (Kalvari et al., 2018) with default parameters. Finally, 968 miRNAs, 3,354 tRNAs, 822 rRNAs, and 298 snRNAs were identified (Supplementary Table S9).
Gene family and phylogenetic analysis
Fifteen Eumetazoa species were selected for gene family analysis, including H. sapiens, B. floridae, D. melanogaster, European honey bee (Apis mellifera), Californian leech (Helobdella robusta), ocean-dwelling worm (Capitella teleta), O. bimaculoides, L. gigantea, California sea hare (Aplysia californica), C. gigas, American oyster (Crassostrea virginica), Sydney rock oyster (Saccostrea glomerata), P. yessoensis, Chinese scallop (Chlamys farreri), and Starlet sea anemone (Nematostella vectensis). All data were downloaded from either NCBI or Ensembl. The longest protein sequence was selected to represent the gene with multiple alternative splicing isoforms. Gene family clusters from all the 16 species were first assigned using OrthoMCL (version 2.0.9) (Li et al., 2003) with an inflation value of 1.5. CAFE (version 3) (De Bie et al., 2006) was used to analyze gene family expansion and contraction under maximum likelihood framework. The protein-coding genes from all the 16 species were assigned into 39,058 families with 337 strict single-copy orthologs. In the S. constricta genome, a total of 12,945 gene families were identified, 803 of which were specifically possessed by S. constricta. Compared with the other 15 species, S. constricta has 193 expanded and 31 contracted gene families (Figure 2). Notably, cytoskeletal protein alpha tubulin (TUA) family and motor protein dynein heavy chain (DYH) family are rapidly expanded in the S. constricta genome (Figure 3A). They play vital roles in the microtubule architecture and the bending movement of cilia (Mohri et al., 2012). The razor clam has a well-developed ciliary system for gill filtering, food-particles retaining, and water pumping (Morton, 1984). The adjoining cilia generate effective beat through coordinated wavelike movements. The pumping rate of the ciliary system in the gill and mantle cavity can be adjusted to generate powerful currents to facilitate the principal sorting and retaining of suspended particles in the labial palps. Effluxes can also be ejected from the pedal gape to flush away sources of irritation detected by the sensory tentacles (Morton, 1984). The transcriptomic data revealed that the TUA and DYH genes are highly expressed in the gills (Figure 3B and 3C), suggesting that the expansion of these genes could be an adaptation to the deep-burrowing lifestyle.

Phylogenetic tree and number of shared orthologs among S. constricta and other animal species. Numbers of gene families undergoing expansion and contraction for each lineage are exhibited as red and green, respectively.
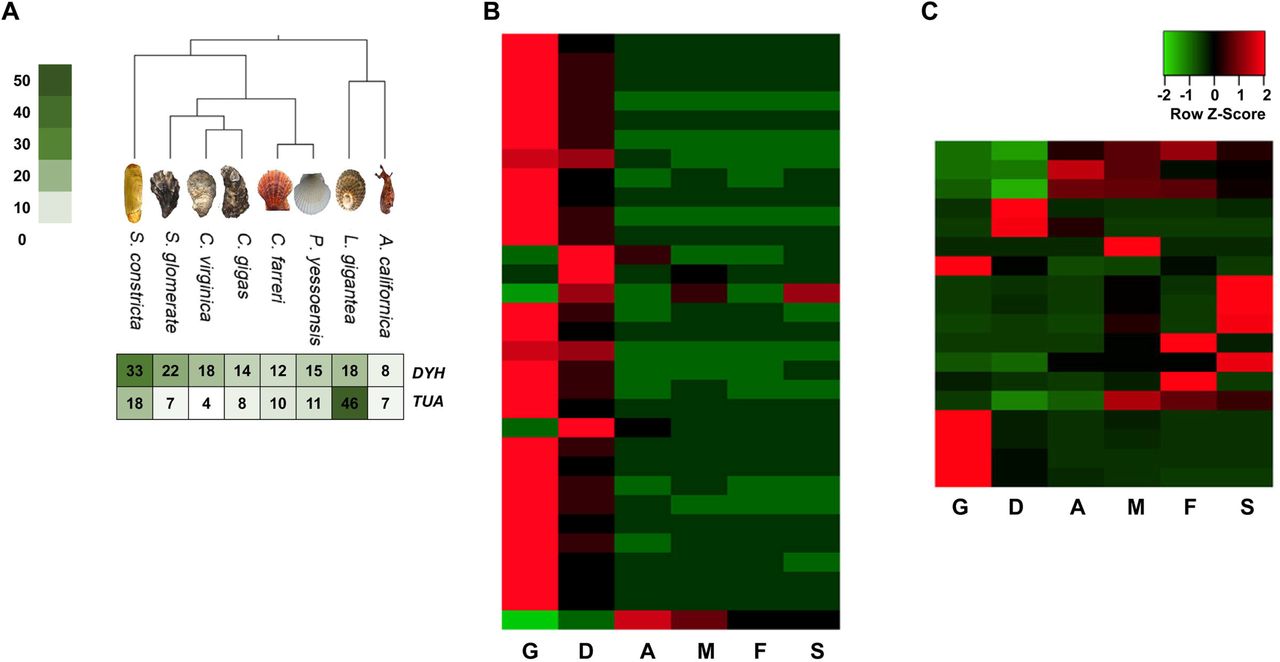
A.The comparison of the copy numbers of dynein heavy chain (DYH) and alpha tubulin (TUA) genes in 8 molluscan species. B & C. The tissue-wide expression patterns of DYH genes and TUA genes. Abbreviations: G, gill; D, digestive gland; A. adductor muscle; M, mantle; F, foot; S, siphon.
Phylogenetic inference of the 16 species was performed with the 337 single-copy orthologs. Multiple sequences alignment was conducted for the protein sequences of each ortholog gene using MUSCLE (version 3.8.31) (Edgar, 2004) separately. The alignments for all the orthologs were then concatenated into a super alignment matrix with 241,349 amino acids. RAxML (version 8.2.12) (Stamatakis, 2014) was used to infer the alignment matrix by a maximum likelihood method with the substitution model PROTGAMMAAUTO. Bootstrapping with 100 replicates was used for node support. Divergence time between species was estimated using MCMCTree in PAML package (version 4.7a) (Yang, 1997) with the parameters of “burn-in = 1,000, sample-number = 1,000,000, sample-frequency = 2”. The constructed maximum likelihood phylogenetic tree revealed that S. constricta clustered with other bivalve species and diverged ~494 million years ago (Mya) from the lineage leading to oysters and scallops (Figure 2).
Hi-C scaffolding and macro-synteny analysis
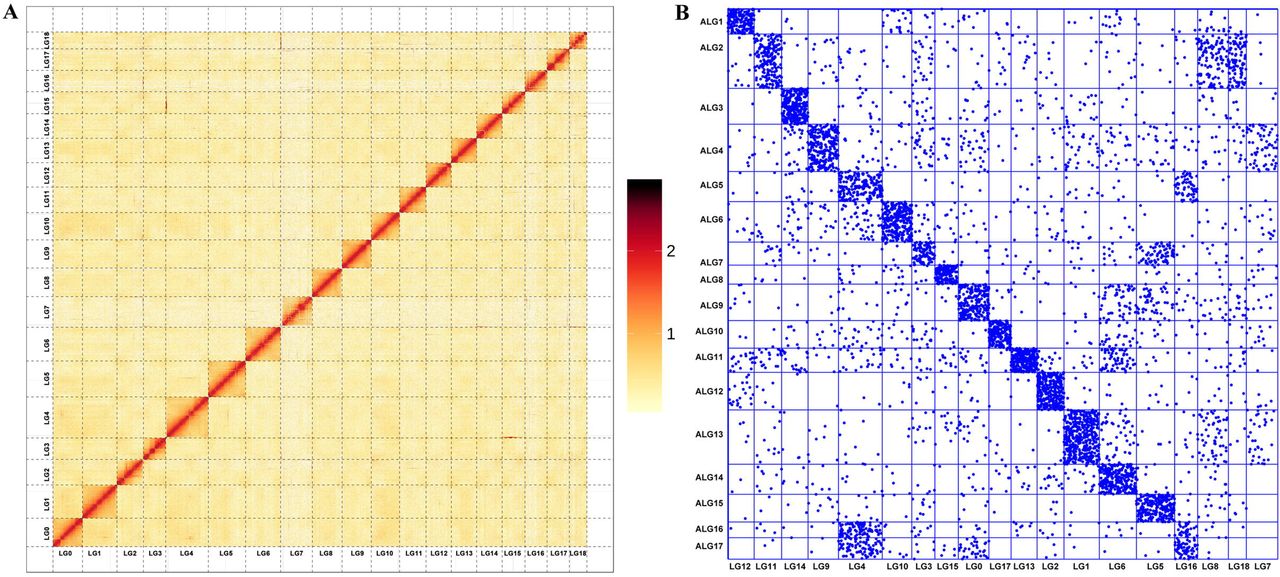
Adductor muscle tissue of a razor clam from the same population was collected for Hi-C library construction. The tissue specimen was fixed with 1% formaldehyde and the genomic DNA was cross-linked, digested by restriction enzymes HindIII, labeled with biotinylated residue, and end repaired. The library was sequenced on an Illumina NovaSeq platform, generating 156.73 G of raw reads. The raw reads were truncated at the junctions and aligned to the polished genome using BWA (version 0.7.17) with default parameters. Only the unique aligned reads with a mapping quality over 20 were further processed. After filtering invalid interaction pairs by HiC-Pro (v.2.8.0) (Servant et al., 2015), 30.32% of the clean reads were valid pairs and utilized to evaluate the interaction strength among whole genome contigs. Lachesis (version 2e27abb) was used to cluster and anchor the contigs to the chromosomes using an agglomerative hierarchical clustering method (Burton et al., 2013). Finally, 3,068 contigs, accounting for 87.82% of the total bases, were clustered into 19 linkage groups (Figure 4A), which was consistent with the karyotype revealed by previous studies (Wang et al., 1998). The ancient ortholog genes exhibited remarkable preservation of ancestral bilaterian linkage groups (Simakov et al., 2013; Wang et al., 2017) with a conservation index (CI) of 0.71, indicating the considerable accuracy of the Hi-C clustering (Figure 4B).
A. Hi-C interaction heat map of of S. constricta. B. Chromosome-based macro-synteny between S. constricta and the 17 presumed bilaterian ALGs retrieved from Simakov et al. (2013).
Conclusions
We assembled a high-quality chromosomal-level reference genome of S. constricta, the first genome of the family Solenidae, along with comprehensive transcriptomic data of whole-ontogeny developmental stages and all major tissues (under normal and stressed conditions). The genomic and transcriptomic resources reported here would lay a prime foundation for future studies to elucidate the razor clam’ adaptive traits relating to deep-burrowing lifestyle (e.g., thin shells, advanced ciliary and siphon system, , extraordinary adaption to broad-range salinity and high concentration of ammonia nitrogen and hydrogen sulfide) and genetic improvement in commercial breeding programs.
Ethics approval and consent to participate
All experimental procedures were approved by the Institutional Animal Care and Use Committee (IACUC) of Zhejiang Wanli University, China. All participants consent to publish the work under the “Consent to publish” heading.
Data availability
The S. constricta genome assembly is available at NCBI (BioProject: PRJNA559038). RNA sequencing data files are available through the NCBI Sequence Read Archive (BioProject: PRJNA559056). The S. constricta genome assembly and annotation files also could be downloaded from the website http://202.121.66.128/clam-genome/zwu.htm.
Author contributions
Y. D., Z. L. and Z. B. conceived the project. H. Y., W. R. and L.H. conducted the environmental stress and collected the samples. Q. Z., S. W., J. R. and L. L. performed the genome assembly, annotation, transcriptome analysis and other bioinformatics analysis. Y. D., J. R., Q. Z., S. W. and Q. X. wrote and revised the manuscript. All authors read and approved the final manuscript.
Competing interests
The authors declare that they have no competing interests.
Supplementary materials
Table S1. Summary of the genomic sequencing reads
Table S2. Statistics of Illumina short reads coverage
Table S3. Summary genomic completeness by CEGMA
Table S4. Summary genomic completeness by BUSCO
Table S5. Summary of Illumina transcriptome sequencing data
Table S6. Summary of clean reads mapping
Table S7. Summary of PacBio full-length transcriptome sequencing
Table S8. Summary of the gene prediction results
Table S9. Summary of the non-coding RNA annotation
Figure S1. Genome survey of Sinonovacula constricta using 17-mer analysis
Figure S2. Volcano map of differentially expressed genes
Figure S3. Dot plot of GO enrichment of differentially expressed genes
Figure S4. Dot plot of KEGG pathway enrichment of differentially expressed gen
Acknowledgements
This work was financially supported by the National Key Research and Development Program of China (No.2018YFD0901405), Zhejiang Major Program of Science and Technology (No.2016C02055-9), Modern Agro-industry Technology Research System (No. CARS-49).
Footnotes
Yinghui Dong, Email: dongyinghui118{at}126.com, Qifan Zeng, Email: zengqifan{at}ouc.edu.cn, Jianfeng Ren, Email: jfren{at}shou.edu.cn, Hanhan Yao, Email: yaohanhan1020{at}126.com, Wenbin Ruan, Email: wbruan{at}163.com, Liyuan Lv, Email: llyuan.2009{at}163.com, Lin He, Email: hlwithyou{at}qq.com, Qinggang Xue, Email: qxue{at}zwu.edu.cn, Zhenmin Bao, zmbao{at}ouc.edu.cn
Reference


