

Abstract
Mitochondrial membrane dynamics is a cellular rheostat that relates organelle morphology and metabolic function. Using an in vitro reconstitution system, we describe a mechanism for how mitochondrial inner-membrane fusion is regulated by the ratio of two forms of Opa1. We found that the long-form of Opa1 (l-Opa1) is sufficient for membrane docking, hemifusion and low levels of content release. However, stoichiometric levels of the processed, short form of Opa1 (s-Opa1) work together with l-Opa1 to mediate efficient and fast membrane pore opening. Additionally, we found that excess levels of s-Opa1 inhibit fusion activity, as seen in conditions of abnormal cellular proteostasis. These observations describe a mechanism for gating membrane fusion.
Introduction
Mitochondrial membrane fission and fusion is essential for generating a dynamic mitochondrial network and regenerative partitioning of damaged components via mitophagy (1). Membrane rearrangement is essential for organelle function (2, 3) and contributes to diversity in mitochondrial membrane shape that may reflect metabolic and physiological specialization (4–6).
Mitochondrial membrane fusion is catalyzed by Mfn1/2 and Opa1 (the outer and inner membrane fusogens, respectively), which are members of the dynamin family of large GTPases (7, 8) (Figure 1A). Opa1 is the most commonly mutated gene in Dominant Optic Atrophy, a devastating pediatric condition resulting in degeneration of retinal ganglion cells. Mutations in Opa1 account for over a third of the identified cases of this form of childhood blindness (9).

A. Mitochondrial membrane fusion involves sequential outer and inner membrane fusion. The mitofusins (Mfn1/2) catalyze outer membrane fusion. In metazoans, mitochondrial inner- membrane fusion is mediated by Opa1. B. Linear domain arrangement of l-Opa1. C. Fusion assay. Membrane tethering, docking, lipid mixing, and content release can be distinguished using fluorescent reporters that specifically reflect each transition of the reaction.
Like dynamin, Opa1 comprises a GTPase domain, helical bundle signaling element (BSE), and stalk region (with a membrane-interaction insertion) (Figure 1B) (10–12). Opa1 is unique for a dynamin family GTPase, because it is processed to generate two forms. The unprocessed, N- terminal transmembrane anchored, long form is called l-Opa1. The proteolytically processed short form, which lacks the transmembrane anchor, is called s-Opa1 (13). Both forms of the protein can interact with cardiolipin, a negatively charged lipid enriched in the mitochondrial inner membrane. Opa1 GTPase activity is stimulated by association with cardiolipin (14). Integrative biophysical and structural insights have revealed how dynamin nucleotide-state is coupled to GTPase-domain dimerization, stalk-mediated self-assembly and membrane rearrangement (15–18). For Opa1, the opposite reaction (fusion) is also likely to result from nucleotide-dependent conformational changes, coupled domain rearrangement, and self-assembly necessary to overcome the kinetic barriers of membrane merger. Classic studies of Mgm1, the yeast orthologue of Opa1, show that both long and short forms are required for inner-membrane fusion (19). Yet, the specific membrane activities of the two forms and their regulatory interplay remain unclear.
In this study, we applied a TIRF-based supported bilayer/liposome assay to distinguish the sequential steps in membrane fusion that convert two apposed membranes into one continuous bilayer: tethering, membrane docking, lipid mixing (hemifusion) and content release (Figure 1C). Tethering can be observed when liposomes attach to the supported bilayer. Lipid mixing (hemifusion) is reported when a liposome dye (TexasRed) diffuses into the supported bilayer. Release of a soluble content dye (calcein) from within the liposome (loaded at quenched concentrations) indicates full pore opening.
Using this in vitro reconstitution approach, we describe key mechanistic requirements for mitochondrial inner-membrane fusion. We report efficiency and kinetics for each step in Opa1- mediated fusion. These experiments describe the membrane activities of l-Opa1 alone, s-Opa1 alone, and l-Opa1:s-Opa1 together. We find that s-Opa1 and l-Opa1 are both required for efficient and fast pore opening, and present a mechanism for how the ratio of l-Opa1 and s-Opa1 levels regulate inner-membrane fusion. These results are compatible with original yeast observations (19), as well as recent in vitro studies (20), and contribute a model for how inner-membrane fusion is regulated.
Results
Assay validation
We purified long and short forms of human Opa1 expressed in Pichia pastoris. Briefly, Opa1 was extracted from membranes using n-dodecyl-β-D-maltopyranoside (DDM) and purified by Ni-NTA and Strep-tactin affinity chromatography, and size exclusion chromatography (Figure 2A). GTPase activity of purified Opa1 was confirmed by monitoring free phosphate release (Figure 2B). Opa1 activity was enhanced by the presence of cardiolipin, consistent with previous reports (14).

A. Representative size-exclusion chromatograph and SDS-PAGE gel of human l-Opa1 purified from P. pastoris. B. l-Opa1 activity, with velocity and specific activity of GTP hydrolysis in the presence and absence of cardiolipin, while varying protein concentration of Opa1. Data are shown as mean ± SD, error bars are from 3 experiments. C. Representative single-liposome photobleaching steps and histogram of step sizes (distribution for 110 liposomes shown).
We reconstituted l-Opa1 into 200 nm liposomes and supported bilayers generated by Langmuir-Blodgett/Langmuir-Schaefer methods (21). l-Opa1 was added to liposomes at an estimated protein:lipid molar ratio of 1:5000 and to a supported bilayer at an estimated protein:lipid molar ratio of 1:50000. Membranes comprised DOPE (20%), Cardiolipin (20%), PI (7%), and DOPC (52.8%). Reporter dyes (e.g. Cy5-PE, TexasRed-PE) were introduced into the supported bilayer and liposome membranes, respectively, at ∼0.2 %. A surfactant mixture stabilized the protein sample during incorporation. Excess detergent was removed using Bio-Beads and dialysis.
We evaluated reconstitution of l-Opa1 into both the polymer-tethered supported lipid bilayers and proteoliposomes using two approaches. First, using Fluorescence Correlation Spectroscopy (FCS), we measured the diffusion of dye-conjugated lipids and antibody-labeled protein. FCS intensity measurements confirmed ∼75% of l-Opa1 reconstituted into the bilayer in the accessible orientation. Bilayer lipid diffusion was measured as 1.46 ± 0.12 µm2/s, while the diffusion coefficient of bilayer-reconstituted l-Opa1 was 0.88 ± 0.10 µm2/s (Supplemental Figure 1), which is in agreement with previous reports of lipid and reconstituted transmembrane protein diffusion (22). These measurements indicate the reconstituted l-Opa1 in the bilayer can freely diffuse, and has the potential to self-associate and oligomerize. FCS experiments were also performed on liposomes. FCS intensity measurements confirmed 86.7% of total introduced l-Opa1 successfully reconstituted into the liposomes. The diffusion coefficient of free antibody was 163.87 ± 22.27 µm2/s. The diffusion coefficient for liposomes labeled with a lipid dye was 2.22 ± 0.33 µm2/s, and the diffusion coefficient for l-Opa1 proteoliposomes bound to a TexasRed labeled anti-His antibody was 2.12 ± 0.36 µm2/s (Supplemental Figure 2). Second, we measured the number of l-Opa1 incorporated into liposomes by fluorescent step-bleaching of single proteoliposomes. We found an average step number of 2.7 for individual l-Opa1-containing proteoliposomes labeled with TexasRed conjugated anti-His antibody, when tethered to cardiolipin containing lipid bilayers (Figure 2C).

Epifluorescence image of polymer-tethered lipid bilayers before (A) and after Opa1 reconstitution (B), showing a homogeneous lipid bilayer. Scale bar: 10 µm. FCS profiles of TexasRed-PE and TexasRed labeled anti-Opa1 antibody show slower diffusion for reconstituted l-Opa1 (C), indicating successful reconstitution, and that the reconstituted l-Opa1 diffuses freely.

Fluorescence autocorrelation profiles of TexasRed labeled anti-His antibody in the presence of unlabeled liposomes (A), and TexasRed-PE-labeled liposomes (B), showing diffusion coefficients of unbound antibody versus liposomes. FCS profile of reconstituted l-Opa1 (detected with a TexasRed labeled antibody) (C) is similar to that of dye-labeled liposomes (B), indicating successful reconstitution of Opa1.
Nucleotide-dependent bilayer tethering and docking
Using the supported bilayer/liposome assay described in Figure 1C, we found that l-Opa1 tethers liposomes in a homotypic fashion (Figure 3A), as reported by the appearance of TexasRed puncta in the TIRF field above a l-Opa1-containing bilayer. This interaction occurred in the absence of nucleotide but was enhanced by GTP. We next investigated requirements for Opa1 tethering. In the absence of cardiolipin, addition of GTP did not change the number of tethered particles under otherwise identical conditions (Figure 3A). In contrast, with cardiolipin-containing liposomes and bilayers, homotypic l-Opa1:l-Opa1 tethering is enhanced by GTP. Non-hydrolyzable analogues (GMPPCP) or GDP disrupt tethering (Figure 3B), and a hydrolysis-dead mutant (G300E) l-Opa1 shows no tethering (data not shown), supporting a role for the hydrolysis transition-state in tethering, as observed for atlastin (23, 24). Bulk liposome light scattering measurements (NTA Nanosight) show l-Opa1-mediated liposome clustering requires the presence of GTP (Supplemental Figure 3). These bulk measurements also show a GTP-dependent increase in particle size.
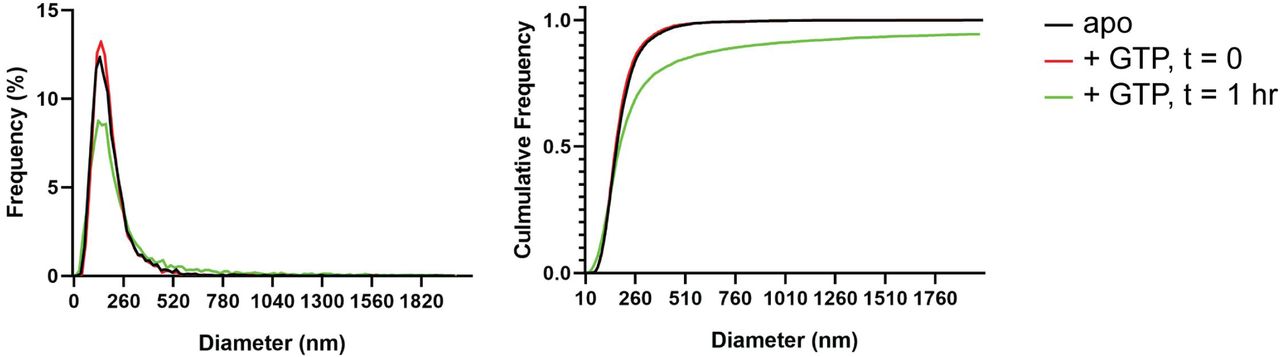
Normalized relative and cumulative size distributions show cardiolipin containing proteoliposomes shift to larger sizes 1 hour following GTP addition (green trace).

A. Number of liposomes tethered on the planar bilayers in a homotypic format (l-Opa1 on both bilayers) increases in the presence of GTP, when both bilayers contain cardiolipin. Representative images of liposomes tethered on lipid bilayer (both containing cardiolipin) before and after GTP addition. Scale bar: 5µm. Bar graph: In the presence of cardiolipin, addition of GTP doubles the number of liposomes. (***p<0.001, two way ANOVA). B. Addition of GMPPCP decreases amount of tethered l-Opa1 liposomes. (P<0.005, two-way ANOVA). C. l-Opa1 in the liposome bilayer alone is sufficient to tether liposomes to a cardiolipin containing bilayer. Tethering is enhanced in the presence of GTP. D. s-Opa1 tethers liposomes to a cardiolipin-containing bilayer. Number of tethered liposomes when both bilayer and liposomes contain 20% (mol) cardiolipin. Before addition of GTP, a moderate amount of liposome tethering was observed. The addition of GTP enhances this tethering effect. Data are shown as mean ± SD. Error bars are from 5 independent experiments (> 10 images across one bilayer per for each experiment).
Ban, Ishihara and colleagues have observed a heterotypic, fusogenic interaction between l-Opa1 on one bilayer and cardiolipin in the opposing bilayer (20). Inspired by this work and our own observations, we considered if a heterotypic interaction between l-Opa1 and cardiolipin on the opposing membrane could contribute to l-Opa1-mediated tethering (Figure 3C). Indeed, we find that proteoliposomes containing l-Opa1 will tether to a cardiolipin-containing bilayer lacking any protein binding partner, presumably mediated by the lipid-binding insertion in the helical stalk region (12).
We next measured whether s-Opa1, lacking the transmembrane anchor, could tether membranes via membrane binding interactions that bridge the two bilayers. We observe that s-Opa1 (added at a protein:lipid molar ratio of 1:5000) can tether cardiolipin liposomes to a cardiolipin-containing planar bilayer, as observed previously for Mgm1 (25). Further, this s-Opa1 tethering is enhanced by the presence of GTP (Figure 3D). Previous reports observed membrane tubulation at higher concentrations of s-Opa1 (0.2 mg/ml, 1.67 nmol) (14). Under the lower s-Opa1 concentrations in our experiments (0.16 µg/ml, 2×10⁻³ nmol), the supported bilayer remains intact (before and after GTP addition), and we do not observe any evidence of tubular structures forming in the liposomes or bilayers.
Our experiments indicate that s-Opa1 alone can induce tethering. Is s-Opa1 competent for docking of membranes? To answer this, we evaluated close bilayer approach using a reporter for when membranes are brought within FRET energy transfer distances (∼40 Å). This FRET signal reports on close membrane docking when a TexasRed conjugated PE in the liposome is within FRET distance of a Cy5-conjugated PE in the bilayer. When l-Opa1 is present on both bilayers, efficient docking occurs (Figure 4). Efficient docking requires GTP hydrolysis (as GMPPCP prevents docking). In contrast, s-Opa1 alone does not bring the two bilayers within FRET distance, consistent with observations for s-Mgm1 tethered bilayers (25).

A. Homotypic l-Opa1 docks liposomes in a GTP-hydrolysis dependent manner. s-Opa1, alone is insufficient to closely dock liposomes. l-Opa1 in a heterotypic format (on the liposome alone) is competent to closely dock to a bilayer. Bar graphs shown as mean ± SD. Error bars are from 3-5 independent experiments (each experiment with >150 particles in a given bilayer). B. In the presence of cardiolipin on both bilayers, FRET signal reports on close liposome docking mediated by l-Opa1. Left: Green = Cy5 emission signal upon excitation at 543 (TexasRed excitation). Red = Cy5 emission signal in membrane upon excitation at 633 (Cy5 excitation). Right: Green = TexasRed emission upon excitation at 543 nm (TexasRed excitation).
Hemifusion and pore opening
We find that l-Opa1, when present on only one bilayer, in a heterotypic format, can mediate membrane docking (Figure 4A). To quantify hemifusion (lipid exchange), we measured the fluorescence intensity decay times for the liposome dye (TexasRed) as it diffuses into the bilayer during lipid mixing. Analysis of particle dye diffusion kinetics show that, in this heterotypic format, l-Opa1 can induce hemifusion (Figure 5A). The fusion efficiency (percentage of total particles where the proteoliposome dye diffuses into the supported bilayer) for heterotypic l-Opa1 was <5% (Figure 5D). Previously published in vitro liposome-based observations for heterotypic l-Opa1 lipid mixing observed efficiencies of 5-10% (20). We next compared homotypic l-Opa1 catalyzed lipid mixing and observed shorter mean dwell times than heterotypic l-Opa1 (Figure 5B & 5C). In our assay, we observe homotypic l-Opa1 induces hemifusion more efficiently than heterotypic l-Opa1. We measured a homotypic l-Opa1 hemifusion efficiency of ∼15% (Figure 5D). For comparison, In vitro measurements of viral membrane hemifusion, show efficiencies of ∼25-80% (26, 27). This comparison is imperfect, as viral particles have many more copies of their fusion proteins on their membrane surface and viral fusogens do not undergo multiple cycles of nucleotide hydrolysis, like Opa1.

A. Hemifusion in heterotypic format. Top panels: time trace of lipid diffusion (TexasRed). Bottom panels: no content release is observed for this particle (calcein signal remains quenched). Scale bar: 1 µm. B. Hemifusion in homotypic format. Top panels: time trace of lipid diffusion (TexasRed). Bottom panels: no content release is observed for this particle (calcein signal remains quenched). Scale bar: 1 µm. C. Intensity traces of a control particle (black), heterotypic hemifusion event (solid red), homotypic hemifusion event (dotted red). C. Hemifusion (lipid mixing) and full fusion (pore opening) efficiency for homotypic l-Opa1, heterotypic l-Opa1 and s-Opa1. Bar graphs shown as mean ± SD. Error bars are from 5 different experiments (50-200 particles were analyzed per bilayer in each experiment).
Following hemifusion, pore opening is the key step where both leaflets merge and content from the two compartments can mix. We observed pore opening by monitoring content dye (calcein) release under these conditions (28). Both s-Opa1 alone (at 0.16 µg/ml, or 2×10⁻³ nmol concentration), or l-Opa1 in the heterotypic format did not release content (Figure 5D). In contrast, ∼8% of homotypic l-Opa1:l-Opa1 particles undergo pore opening and content release. Approximately half of the homotypic l-Opa1 particles do not proceed to full fusion. These observations indicate, l-Opa1 alone is sufficient for pore opening, while s-Opa1 alone or heterotypic l-Opa1 are insufficient for full fusion.
Ratio of s-Opa1:l-Opa1 regulate pore opening efficiency and kinetics
Our observation that l-Opa1 is sufficient for pore opening leaves open the role of s-Opa1 for fusion. Previous studies suggest an active role for s-Mgm1 (the yeast orthologue of s-Opa1) in fusion (19). In this work, l-Mgm1 GTPase activity was dispensable for fusion in the presence of wild-type s-Mgm1 (19). In contrast, work in mammalian cells suggest an inhibitory role for s-Opa1. These studies observed that damaged or unhealthy mitochondria up-regulate Opa1 processing, resulting in accumulation of s-Opa1 and fragmented mitochondria (13, 20, 29). The interpretation of these experiments was that, in contrast to the yeast observations, s-Opa1 suppresses fusion activity. Furthermore, studies using Opa1 mutations that abolish processing of l-Opa1 to s-Opa1 suggest the short form is dispensable for fusion, and s-Opa1 may even mediate fission (30, 31). These different, and at times opposing, experimental observations have been difficult to reconcile.
To address how s-Opa1 and l-Opa1 cooperate, we added s-Opa1 to the l-Opa1 homotypic supported bilayer/liposome fusion experiment. l-Opa1-only homotypic fusion has an average dwell time of 20 s and an efficiency of ∼10% (Figure 6A & 6B). In the presence of equimolar levels of s-Opa1, we observe a marked increase in pore opening kinetics and efficiency, with an increased efficiency of ∼80% and a four-fold decrease in mean dwell time (Figure 6A & 6C). The efficiency peaks at an equimolar ratio of s-Opa1 to l-Opa1, showing that s-Opa1 cooperates with l-Opa1 to catalyze fast and efficient fusion. When s-Opa1 levels exceed l-Opa1 (at a 2:1 ratio or greater), particles begin to detach, effectively reducing fusion efficiency. This is consistent with a dominant negative effect, where s-Opa1 likely disrupts the homotypic l-Opa1:l-Opa1 interaction.
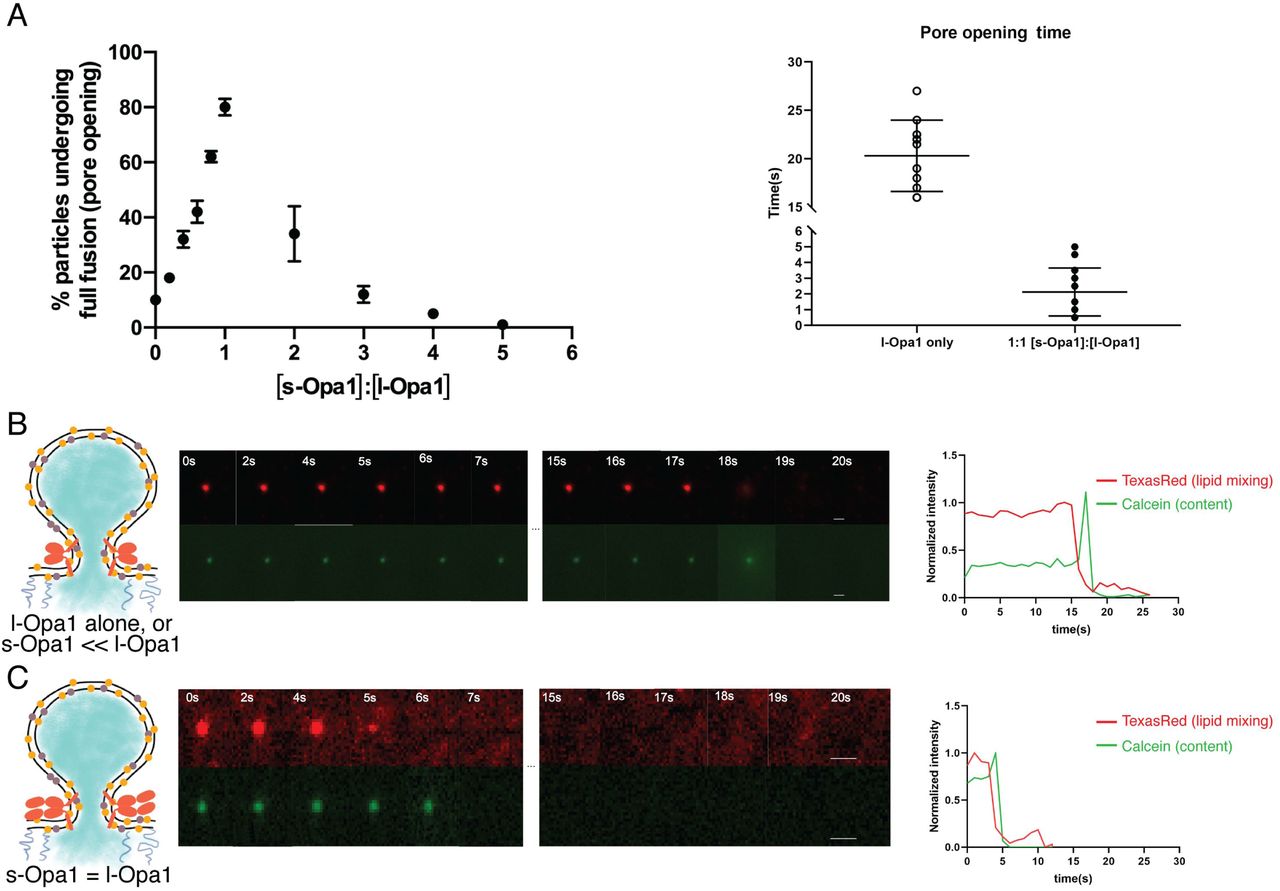
A. Full fusion (pore opening) efficiency at different s-Opa1:l-Opa1 ratios (left panel). Data is shown as mean ± SD. Error bars are from 4-6 experiments (80-150 particles per bilayer in each experiment). Mean pore opening time in the absence of s-Opa1 and at equimolar s-Opa1 (right panel). B. Representative hemifusion and pore opening fluorescence traces for homotypic l-Opa1:l-Opa1, in the absence of s-Opa1, top and bottom panels, respectively. Scale bar: 1 µm. At right: representative trace of TexasRed (liposome signal) and calcein (content signal) intensity. C. Representative hemifusion and pore opening fluorescence traces for homotypic l-Opa1:l-Opa1 in the presence of s-Opa1. Scale bar: 1 µm. At right: representative trace of TexasRed (liposome signal) and calcein (content signal) intensity.
Discussion
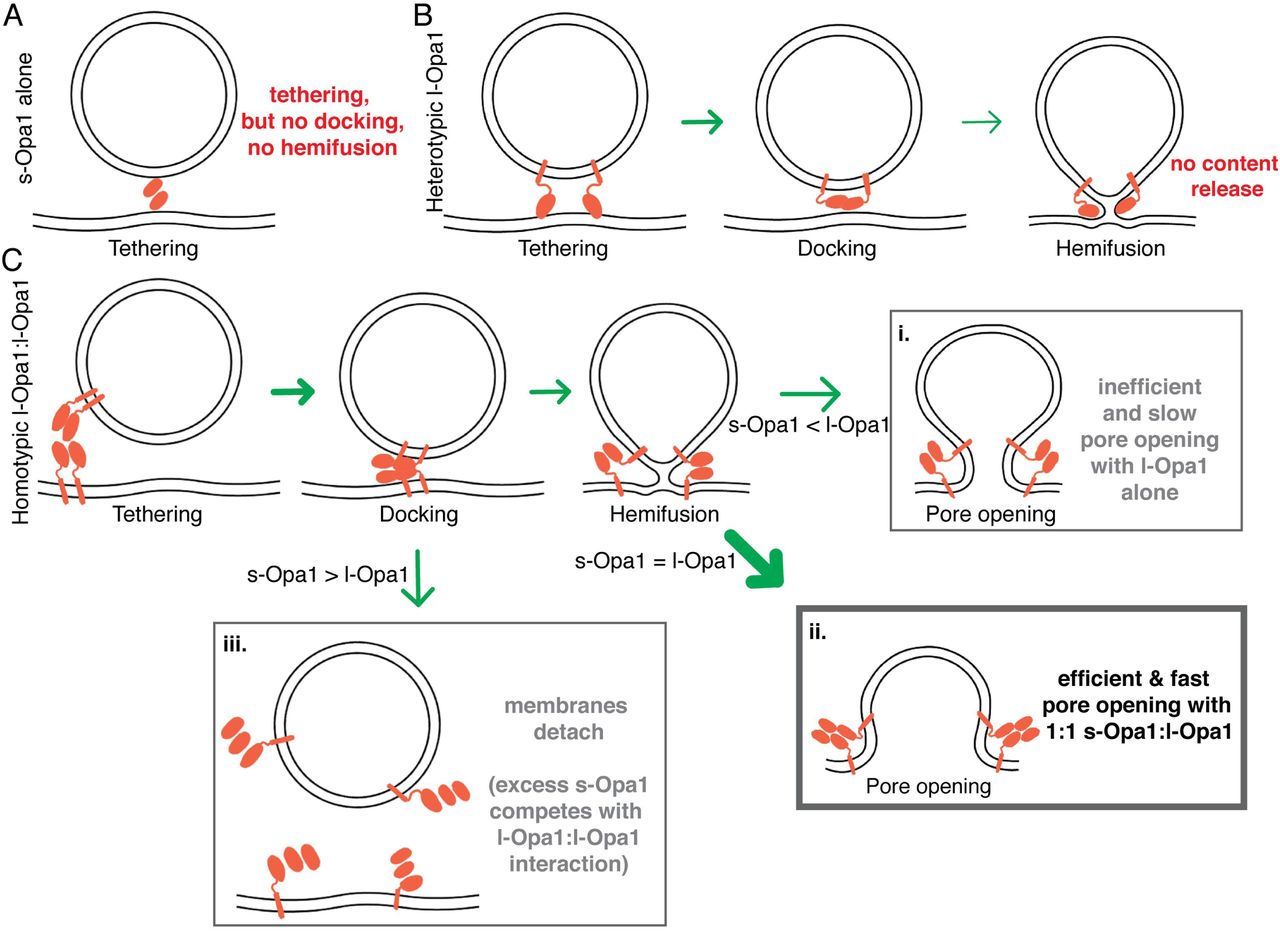
Our experiments suggest different assembled forms of Opa1 represent functional intermediates along the membrane fusion reaction coordinate. This suggests several opportunities for regulating membrane fusion and remodeling. We show that s-Opa1 alone is sufficient to mediate membrane tethering but is unable to dock and merge lipids in the two bilayers, and thus, insufficient for hemifusion (Figure 7A). In contrast, l-Opa1, in a heterotypic format, can tether and hemifuse bilayers, but is unable to transition through the final step of pore opening (Figure 7B). Homotypic l-Opa1 can hemifuse membranes and mediate low levels of pore opening. However, our results show that s-Opa1 and l-Opa1 synergistically catalyze efficient and fast membrane pore opening. Importantly, we find that excess levels of s-Opa1 are inhibitory for pore opening, providing a means to down-regulate fusion activity (Figure 7C).

Summary model for modes of regulation in Opal-mediated membrane fusion. A. s-Opa1 alone is capable of tethering bilayers, but insufficient for close membrane docking and hemifusion. B. l-Opa1, in a heterotypic arrangement, can tether bilayers, and upon GTP stimulation promote low levels of lipid mixing, but no full fusion, pore opening or content release. C. Homotypic l-Opa1-l-Opa1 tethered bilayers can mediate full content release (i). This activity is greatly stimulated by the presence of s-Opa1, with peak activity at 1:1 s-Opa1:l-Opa1 (ii). Excess levels of s-Opa1 suppress fusion, likely through competing with the l-Opa1-l-Opa1 homotypic tethering interface (iii).
Our model proposes that l-Opa1:s-Opa1 stoichiometry, resulting from proteolytic processing, gates the final step of fusion, pore opening. Electron tomography studies of mitofusin show a ring of proteins clustering at an extensive site of close membrane docking, but only local regions of pore formation (32). Our study is consistent with local regions of contact and low protein copy number mediating lipid mixing and pore formation (33). Our study would predict that s-Opa1 enrichment in regions of the mitochondrial inner-membrane would suppress fusion. This study did not explore the roles of s-Opa1 assemblies (helical or 2-dimensional) in fusion (12). Cellular validation of our proposed model, and other states, will require correlating l-Opa1:s-Opa1 ratio and protein spatial distribution with fusion efficiency and kinetics. The behavior of Opa1 splice isoforms, which vary in the processing region, remains another important area for future investigation (34).
Previously studies indicate that the activity of Yme1L and Oma1, inner-membrane mitochondrial proteases that process Opa1, is regulated by mitochondrial matrix state, thereby coupling organelle health to fusion activity (6, 31, 35–37). Basal levels of Opa1 cleavage are observed in healthy cells (13). Upon respiratory chain collapse, increased protease activity elevates s-Opa1 levels, downregulating fusion (38). Our results point to the importance of basal Opa1 processing, and are consistent with observations that where both over-processing and under-processing of l-Opa1 can results in a loss of function (6).
Key questions remain in understanding the function of different Opa1 conformational states, and the nature of a fusogenic Opa1 complex. Recent structural studies show s-Mgm1 self-assembles via interfaces in the stalk region (12, 39). Further electron cyro-tomography work showed s-Mgm1 can assemble into filaments with either positive or negative membrane curvature, and describe models for how domain rearrangement mediate changes in mitochondrial inner-membrane morphology (12). These results echo common outstanding questions which remain in understanding the interplay between local membrane environment, s-Opa1, and l-Opa1. Is the cooperative activity of l-Opa1 and s-Opa1 mediated by direct protein-protein interactions, local membrane change, or both? Could tethered states (e.g. homotypic l-Opa1 or heterotypic l-Opa1) bridge bilayers to support membrane spacings seen in cristae? Answers to these questions, and others, await further mechanistic dissection to relate protein conformational state, in situ architecture and physiological regulation.
Competing interests
None
Materials and Methods
Expression and purification
Genes encoding l-(residues 88-960) or s-(residues 195-960) OPA1 (UniProt O60313-1) were codon optimized for expression in Pichia pastoris and synthesized by GenScript (NJ, USA). The sequences encode Twin-Strep-tag, HRV 3C site, (G4S)3 linker at the N-terminus and (G4S)3 linker, TEV site, deca-histidine tag at the C-terminus. The plasmids were transformed into the methanol inducible SMD1163 strain (gift from Dr. Tom Rapoport, Harvard Medical School) and the clones exhibiting high Opa1 expression were determined using established protocols. For purification, cells expressing l-Opa1 were resuspended in buffer A (50 mM sodium phosphate, 300 mM NaCl, 1 mM 2-mercaptoethanol, pH 7.5) supplemented with benzonase nuclease and protease inhibitors and lysed using an Avestin EmulsiFlex-C50 high-pressure homogenizer. The membrane fractions were collected by ultracentrifugation at 235,000 x g for 45 min. at 4 °C. The pellet was resuspended in buffer A containing 2% DDM, (Anatrace, OH, USA) 0.1 mg/ml 18:1 cardiolipin (Avanti Polar Lipids, AL, USA) and protease inhibitors and stirred at 4 °C for 1 h. The suspension was subjected to ultracentrifugation at 100,000 x g for 1 h at 4 °C. The extract containing l-Opa1 was loaded onto a Ni-NTA column (Biorad, CA, USA), washed with 40 column volumes of buffer B (50 mM sodium phosphate, 350 mM NaCl, 1 mM 2-mercaptoethanol, 1 mM DDM, 0.025 mg/ml 18:1 cardiolipin, pH 7.5) containing 25 mM imidazole and 60 column volumes of buffer B containing 100 mM imidazole. The bound protein was eluted with buffer B containing 500 mM imidazole, buffer exchanged into buffer C (100 mM Tris-HCl, 150 mM NaCl, 1 mM EDTA, 1 mM 2-mercaptoethanol, 0.15 mM DDM, 0.025 mg/ml 18:1 cardiolipin, pH 8.0). In all the functional assays, the C-terminal His tag was cleaved by treatment with TEV protease and passed over the Ni-NTA and Strep-Tactin XT Superflow (IBA Life Sciences, Göttingen, Germany) columns attached in tandem. The Strep-Tactin XT column was detached, washed with buffer C and eluted with buffer C containing 50 mM biotin. The elution fractions were concentrated and subjected to size exclusion chromatography in buffer D (25 mM BIS-TRIS propane, 100 mM NaCl, 1 mM TCEP, 0.025 mg/ml 18:1 cardiolipin, pH 7.5, 0.01% LMNG, 0.001% CHS). s-OPA1 was purified using a similar approach but with one difference: post lysis, the DDM was added to the unclarified lysate at 0.5% concentration and stirred for 0:30 h at 4 °C prior to ultracentrifugation. The supernatant was applied directly to the Ni-NTA column.
GTPase activity assay
The GTPase activity of purified Opa1 was analyzed using EnzCheck Phosophate Assay Kit (Thermo Fisher, USA) according to the vendor’s protocol. Each condition was performed in triplicate. The GTPase assay buffers contained 25 mM HEPES, 60 mM NaCl, 100 mM KCl, 0.5 mM MgCl2 with 0.15 mM DDM. 60 µM GTP was added immediately before data analysis. To compare the effect of cardiolipin on GTPase activity, additional 0.02 mg/ml Cardiolipin was added. The absorbance at 340 nm of each reaction mixture was recorded using SpectraMax i3 plate reader (Molecular Devices) every 30 seconds. Experiments were performed in triplicate. Resulting Pi concentration was fitted to a single-phase exponential-decay, specific activity data were fitted to a Michaelis-Menten equation (GraphPad Prism 8.1).
Preparation of polymer-tethered lipid bilayers
Lipid reagents, including 1,2-dioleoyl-sn-glycero-3-phosphocholine, (DOPC); 1,2-dioleoyl-sn-glycero-3-phosphoethanolamine-N-[methoxy(polyethylene glycol)-2000] (DOPE-PEG2000), L-α-phosphatidylinositol (Liver PI) and 1’,3’-bis[1,2-dioleoyl-sn-glycero-3-phospho]-glycerol (Cardiolipin) were purchased from Avanti Polar Lipids (AL, USA). To fabricate the polymer-tethered lipid bilayers, we combined Langmuir-Blodgett and Langmuir-Schaefer techniques, using a Langmuir-Blodgett Trough (KSV-NIMA, NY, USA) (22, 40). For cardiolipin-free lipid bilayers, a lipid mixture with DOPC with 5 mol% DOPE-PEG2000 and 0.2 mol% Cy5-DSPE at the total concentration of 1 mg/ml was spread on the air water interface in a Langmuir trough. The surface pressure was kept at 30 mN/m for 30 minutes before dipping. The first lipid monolayer was transferred to the glass substrate (25 mm diameter glass cover slide, Fisher Scientific, USA) through Langmuir-Blodgett dipping, where the dipper was moved up at a speed of 22.5 mm/min. The second leaflet of the bilayer was assembled through Langmuir-Shcaefer transfer after 1 mg/ml of DOPC with 0.2 mol% Cy5-PE (Avanti Polar Lipids, AL, USA) was applied to an air-water interface and kept at a surface pressure of 30 mN/m.
Lipid bilayer with cardiolipin was fabricated in a similar manner, where the bottom leaflet included 7 mol% Liver PI, 20 mol% cardiolipin, 20 mol% DOPE, 5 mol% DOPE-PEG2000, 0.2 mol% Cy5-PE and 47.8% DOPC. The composition of the top leaflet of the bilayer was identical except for the absence of DOPE-PEG2000. To match the area/molecule at the air-water interface between CL-free and CL-containing bilayer, the film pressure was kept at 37mN/m. The final average area per lipid, which is the key factor affecting lipid lateral mobility, was kept constant at a Alipid = 65 Å2 (41).
Reconstitution of l-Opa1 into lipid bilayers
Purified l-Opa1 was first desalted into 25 mM Bis-Tris buffer with 150mM NaCl containing 1.2 nM DDM and 0.4 µg/L of cardiolipin to remove extra surfactant during purification. The resulting protein was added to each bilayer to the total amount of 1.3×10⁻¹² mol (protein:lipid 1:10000) together with a surfactant mixture of 1.2 nM of DDM and 1.1 nM n-Octyl-β-D-Glucopyranoside (OG, Anatrace, OH, USA). The protein was incubated for 2 hours before removal of the surfactant. To remove the surfactant, Bio-Beads SM2 (Bio-Rad, CA, USA) was added to the solution at a final concentration of 10 µg beads per mL of solution and incubated for 10 minutes. Buffer with 25 mM Bis-Tris and 150 mM NaCl was applied to remove the Bio-beads with extensive washing. Successful reconstitution was determined using fluorescent correlation spectroscopy assay as described in the supplemental materials.
Preparation of liposomes and proteoliposomes
To prepare calcein (MilliporeSigma, MA, USA) encapsulated liposomes, lipid mixtures (7 % (mol) PI, 20% cardiolipin, 20% PE, 0.2% TexasRed-PE, DOPC (52.8%)), were dissolved in chloroform and dried under argon flow for 25 minutes. The resulting lipid membrane was mixed in 25 mM Bis-Tris with 150mM NaCl and 50 mM calcein through vigorous vortexing. Lipid membranes were further hydrated by incubating the mixtures under 70 °C for 30 min. Large unilamellar vesicles (LUVs) were prepared by extrusion (15 to 20 times) using a mini-extruder with 200 nm polycarbonate membrane.
Proteoliposomes were prepared by adding purified l-Opa1 in 0.1 µM DDM to prepared liposomes at a protein: lipid of 1:5000 (2.5 µg l-Opa1 for 0.2 mg liposome) and incubated for 2 hours,. Surfactant was removed by dialysis overnight under 4 °C using a 3.5 KDa dialysis cassette. Excess calcein was removed using a PD-10 desalting column. The final concentration of liposome was determined by TexasRed absorbance, measured in a SpectraMax i3 plate reader (Molecular Devices).
To evaluate l-Opa1 reconstitution into proteoliposomes, dye free liposome was prepared with TexasRed conjugated anti-His tag Antibody (ThermoFisher) by mixing lipids with antibody containing buffer. TexasRed Labeling efficiency of the antibody was calculated to be 1.05 according to the vendor’s protocol. Antibodies were added at a concentration of 2.6 µg/ml to 0.2 mg/ml liposome. Following hydration through vortexing at room temperature for 15 minutes, LUVs were formed following 20 times extrusion procedure described above. Liposomes labeled with 0.02 % (mol) TexasRed-PE were also prepared as a standard for quantifying reconstitution rate.
Fluorescent Correlation Spectroscopy
Fluorescence correlation spectroscopy (FCS) was performed using a home-built PIE-FCCS system (42, 43). Two pulsed laser beams with wavelengths of 488 nm (9.7 MHz, 5 ps) and 561 nm (9.7 MHz, 5 ps) were filtered out from a supercontinuum white light fiber laser (SuperK NKT Photonics, Birkerod, Denmark) and used as excitation beams. The laser beams were sent through a 100X TIRF objective (NA 1.47, oil, Nikon Corp., Tokyo, Japan) to excite the samples in solution or on bilayer. The emission photons were guided through a common 50 μm diameter pinhole. The light was spectrally separated by a 560 nm high-pass filter (AC254-100-A-ML, Thorlabs), further filtered by respective bandpass filters (green, 520/44 nm [FF01-520/44-25]; red, 612/69 nm [FF01-621/69-25], Semrock), and finally reach two single photon avalanche diode (SPAD) detectors (Micro Photon Devices). The synchronized photon data was collected using a time correlated single photon counting (TCSPC) module (PicoHarp 300, PicoQuant, Berlin, Germany).
The collected photon data was transformed into correlation functions with a home written MATLAB code. The correlation functions were fitted using two-dimensional (1) or three-dimensional (2) Brownian diffusion model for bilayer or solution samples respectively.


Where N is the average number of particles in the system, ω is the waist of the excitation beam, and τD is the dwell time that can be used to calculate the diffusion coefficient (D) of the particles.

Measurements were made on buffers with evenly distributed liposomes, proteoliposomes and antibodies in a glass-bottom 96 well plate at room temperature. The plates were pre-coated with lipid bilayer fabricated from 100 nm DOPC liposomes. For each solution, data was collected in five successive 15 second increments.
For characterization of l-Opa1 reconstitution into planar bilayers, an anti-Opa1 C-terminal antibody (Novus Biologicals, CO, USA) was used. The antibody labeled by TexasRed (Texas Red™-X Protein Labeling Kit, ThermoFisher, CA, USA). Labeling efficiency of the antibody was determined as 1.52 TexasRed/antibody, as determined by NanoDrop (ThermoFisher, CA, USA). The labeled antibody was added to l-Opa1 in the supported bilayer at 2 times the total introduced Opa1 concentration. Excess antibody was removed by extensive rinsing.
To estimate reconstitution efficiency, 0.002 % (mol) l-Opa1 was added to the bilayer. In a separate experiment 0.002 % TexasRed-PE was introduced to the bilayer. The reconstitution efficiency was calculated from the anti-l-Opa1 antibody TexasRed fluorophore density divided by the TexasRed-PE fluorphore density, normalized by the antibody labeling efficiency (1.5 dye molecules/antibody).
Total Internal Reflection Fluorescent Microscopy (TIRF)
Liposome docking and lipid exchange events were imaged using a Vector TIRF system (Intelligent Imaging Innovations, Inc, Denver, CO, USA) equipped with a W-view Gemini system (Hamamatsu photonics, Bridgewater, NJ). TIRF images were acquired using a 100X oil immersion objective (Ziess, N.A 1.4). A 543 nm laser was used for the analysis of TexasRed-PE embedded liposomes and proteoliposomes, while a 633 nm laser was applied for the analysis of Cy5-PE embedded in the planar lipid bilayer. Fluorescent emission was simultaneously observed through a 609-emission filter with a band width of 40 nm and a 698-emission filter with a band width of 70 nm. The microscope system was equipped with a Prime 95B scientific CMOS camera (Photometrics), maintained at -10 °C. Images were taken at room temperature, before adding any liposome or proteoliposome, after 15 mins of addition, and after 30 mins of adding GTP (1 mM) and MgCl2 (1 mM). Each data point was acquired from 5 different bilayers, each bilayer data contains 5-10 particles on average.
Dwell times for hemifused particles were recorded from the moment of GTP addition for pre-tethered particles, until the time of half-maximal TexasRed signal decay. Full fusion events were recorded by monitoring the calcein channel at particle locations identified through the TexasRed signal. Particle identification and localization used both uTrack(44) and Slidebook (Intelligent Imaging Innovations, Inc., Denver, CO) built-in algorithms. To calibrate the point spread function 100 nm and 50 nm fluorescent particles (ThermoFisher Scientific) were used. 2D Gaussian detection were applied in both cases. 2-way ANOVA tests was done using GraphPad Prism. Intensity and distribution of the particles were analyzed using ImageJ.
For analysis of protein reconstitution in proteoliposome (stoichiometry), a TIRF microscope modified from an inverted microscope (Nikon Eclipse Ti, Nikon Instruments) was used. A 561nm diode laser (OBIS, Coherent Inc., Santa Clara, USA) was applied at TIRF angle through a 100X TIRF objective (NA 1.47, oil, Nikon) and the fluorescence signals were collected by an EMCCD camera (Evolve 512, Photometrics).
Nanosight NTA analysis
A NTA300 Nanosight instrument was used to evaluate size distribution of liposome and proteoliposome under different conditions. The equipment was equipped with a 405 nm laser and a CMOS camera. 1 ml of 0.1 µg/ml sample was measured, to reach the recommended particle number of 1× 10⁸ particles/mL (corresponding to the dilution factor of 1:100,000). Image acquisition were conducted for 40 sec for each acquisition and repeated for 10 times for every injection. Three parallel samples were examined for the determination of size distribution. Under each run, the camera level was set to 12 and the detection threshold was set at 3.
Acknowledgements
We thank members of the Chao lab for discussions and review of the manuscript. LHC are grateful for support from a Charles H. Hood Foundation Child Health Research Award. Work by XS and AWS was supported by the National Science Foundation under Grant No. CHE-1753060.
Footnotes
Author list updated
References


