

SUMMARY
Processing bodies (PBs) and stress granules (SGs) are prominent examples of sub-cellular, membrane-less granules that phase-separate under physiological and stressed conditions, respectively. We observe that the trimeric PB protein DCP1A rapidly (within ∼10 s) phase-separates in mammalian cells during hyperosmotic stress and dissolves upon isosmotic rescue (over ∼100 s) with minimal impact on cell viability even after multiple cycles of osmotic perturbation. Strikingly, this rapid intracellular hyperosmotic phase separation (HOPS) correlates with the degree of cell volume compression, distinct from SG assembly, and is exhibited broadly by homo-multimeric (valency ≥ 2) proteins across several cell types. Notably, HOPS leads to nuclear sequestration of pre-mRNA cleavage factor component CPSF6, rationalizing hyperosmolarity-induced global impairment of transcription termination. Together, our data suggest that the multimeric proteome rapidly responds to changes in hydration and molecular crowding, revealing an unexpected mode of globally programmed phase separation and sequestration that adapts the cell to volume change.

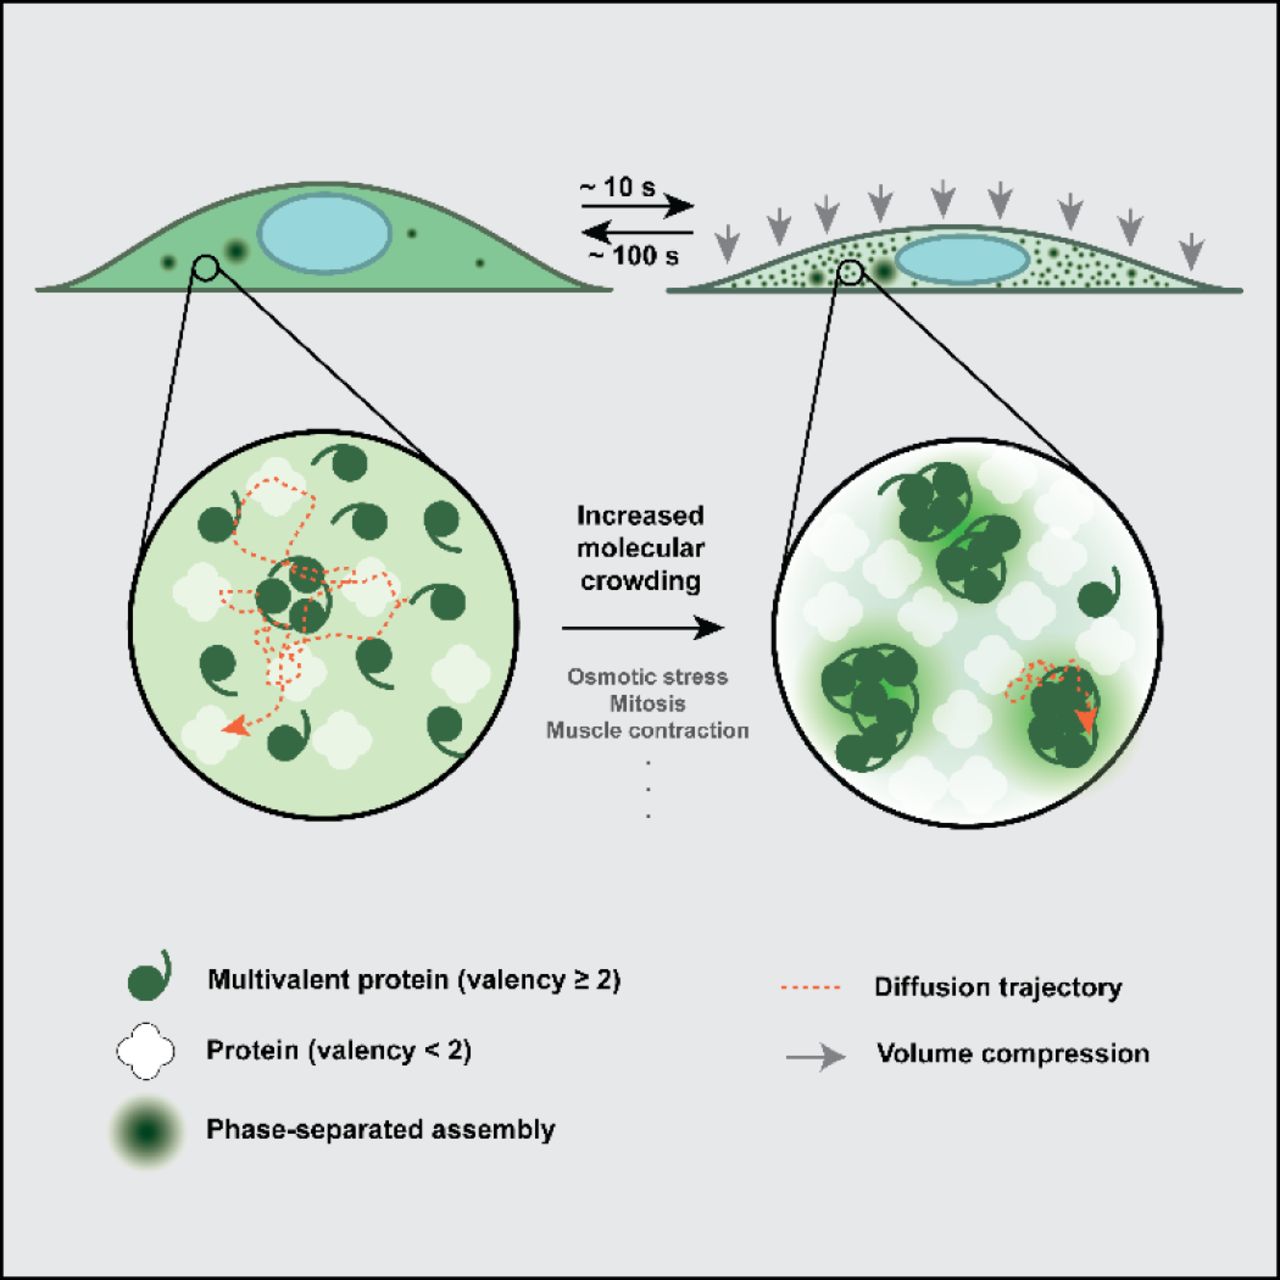
IN BRIEF Cells constantly experience osmotic variation. These external changes lead to changes in cell volume, and consequently the internal state of molecular crowding. Here, Jalihal and Pitchiaya et al. show that multimeric proteins respond rapidly to such cellular changes by undergoing rapid and reversible phase separation.
HIGHLIGHTS
DCP1A undergoes rapid and reversible hyperosmotic phase separation (HOPS)
HOPS of DCP1A depends on its trimerization domain
Self-interacting multivalent proteins (valency ≥ 2) undergo HOPS
HOPS of CPSF6 may explain transcription termination defects during osmotic stress
INTRODUCTION
Membrane-less condensates, often referred to as membrane-less organelles (MLOs), represent sub-cellular sites within the cytosol or nucleus of mammalian cells, wherein key processes such as transcription, translation, post-transcriptional gene regulation, and metabolism are altered compared to the nucleoplasmic or cytoplasmic bulk (Banani et al., 2017; Spector, 2006). Mis-regulation of MLOs and the de novo condensation of mutated proteins into MLOs have been strongly associated with altered gene regulation (Berchtold et al., 2018) and severe pathologies such as amyotrophic lateral sclerosis (ALS) (Banani et al., 2017; Patel et al., 2015; Shin and Brangwynne, 2017). Therefore, understanding the cellular mechanisms by which these structures assemble should yield insights critical for both cellular physiology and disease (Alberti, 2017; Hyman et al., 2014; Toretsky and Wright, 2014).
MLOs are hypothesized to arise from the phase separation of dispersed multivalent biomolecules under specific conditions of pH, temperature, and concentration (Boeynaems et al., 2018; Hyman et al., 2014; Shin and Brangwynne, 2017). Extensive evaluation of this notion in vitro has defined the molecular features required to form MLOs (Hyman et al., 2014; Shin and Brangwynne, 2017; Wang et al., 2018), especially in the context of homotypic or heterotypic interactions of low complexity domain (LCD) containing proteins and RNAs, and has yielded an ever-expanding list of cellular components that can spontaneously phase-separate in the test tube. Yet, the significance of the propensity of these biomolecules to phase-separate under the physiological conditions of their native intracellular environment, where molecular crowding is dominant, is poorly understood (Alberti et al., 2019). While it is possible to alter crowding within the test tube via the addition of synthetic macromolecules (Alberti et al., 2019), the nature and extent of crowding in the cellular context is quite different (Daher et al., 2018; Walter, 2019) and dynamically changes with the cellular state. For example, cell volume adjustments occur during processes critical to both cellular homeostasis and pathology, including the cell cycle (Tzur et al., 2009; Zlotek-Zlotkiewicz et al., 2015) as well as upon cell adhesion and migration (Guo et al., 2017; Watkins and Sontheimer, 2011). Changes in cell volume and molecular crowding, frequently encountered by cells of the kidney, liver, and gut (Lang et al., 1998), are even more rapid and dramatic during osmotic perturbation (Guo et al., 2017; Hersen et al., 2008; Miermont et al., 2013). How cells respond to rapid and frequent volume perturbations with seemingly minimal impact on their viability and whether the resulting dynamic changes in macromolecular crowding affect intracellular phase separation remain unknown.
Processing bodies (PBs) are an example of gene regulatory MLOs that are constitutively present in eukaryotic cells under physiological conditions and concentrations (Anderson and Kedersha, 2009). Their intracellular copy number has been shown to be modulated not only during the cell cycle (Aizer et al., 2013), but also upon prolonged (minutes to hours) hypertonic or hyperosmotic stress (Huch and Nissan, 2017), which can lead to nephritic and vascular pathologies (Brocker et al., 2012). Much like other environmental stressors (e.g., heat shock, oxidative stress, metabolite deprivation), prolonged hyperosmotic stress also triggers the integrated stress response (ISR) and the formation of a type of gene-regulatory MLOs called stress granules (SGs) (Anderson and Kedersha, 2009). While both PBs and SGs are thought to assemble via a conceptually similar mechanism involving multivalent interactions between non-translating mRNAs and LCD-bearing RNA binding proteins (Van Treeck and Parker, 2018), they are compositionally distinct (Hubstenberger et al., 2017; Jain et al., 2016; Khong et al., 2017). Whether components of PBs and SGs are affected differentially by distinct stresses is largely unknown. Given that hyperosmotic stress rapidly (seconds to minutes) imparts cell volume change (Guo et al., 2017; Hersen et al., 2008; Miermont et al., 2013), it is also unclear whether the ISR, and consequently SGs, can be induced at this time scale. Finally, the observation that PBs are similarly regulated by the cell cycle and hypertonic stress (Aizer et al., 2013; Huch and Nissan, 2017) raises the question of whether PB regulation and cell volume change may be connected.
Here we investigate the role of macromolecular crowding and cell volume change on the intracellular phase separation of proteins using osmotic perturbations. We observe that DCP1A, a marker of PBs and component of the mRNA decapping machinery, rapidly (within ∼10 s) undergoes cytosolic phase separation in response to hypertonic stress and that these condensates dissolve over ∼100 s upon return to isotonic media. This hyperosmotic phase separation (HOPS) can be cycled multiple times with minimal impact on cell viability, and is caused by changes in cellular water content and molecular crowding since its extent is directly proportional to the osmotic compression of the cell. We further find that HOPS is induced by DCP1A’s homo-trimerization domain and observed across a variety of cell types. Strikingly, most multimeric proteins tested with a valency of at least 2 (i.e., forming trimers and higher order multimers, but not dimers and monomers) undergo HOPS, strongly suggesting that rapid changes in hydration and molecular crowding are sensed by a significant fraction of the proteome and may lead to pleiotropic effects. Notably, G3BP and polyA RNA, as markers of SGs, do not undergo HOPS (as characterized by condensation within ∼10 s), suggesting distinct intracellular phase separation phenomena of proteins with multivalent interactions and with LCDs. HOPS of multimeric Cleavage and Polyadenylation Specific Factor 6 (CPSF6) within the cell’s nucleus is correlated with widespread impairment of transcription termination, possibly due to sequestration of this component of the pre-mRNA cleavage factor Im complex from a subset of transcription end sites (TES). Our findings suggest that HOPS is a heretofore-underappreciated fundamental cellular driver of protein phase separation that rapidly senses changes in cell volume with profound impact on cellular homeostasis.
RESULTS
Changes in extracellular tonicity induce rapid and reversible intracellular phase separation of DCP1A, but not SG markers
In a previous study (Pitchiaya et al., 2019), we observed that osmotic stress leads to phase separation of DCP1A, a non-catalytic protein component of the eukaryotic decapping complex and conserved PB marker (Anderson and Kedersha, 2009). To study the intracellular kinetics of PB and SG formation in response to stress more broadly, we subjected U2OS cells to osmotic and oxidative stressors, and performed fixed-cell protein immunofluorescence (IF) or combined IF and RNA fluorescent in situ hybridization (RNA-FISH) before and after the stressors (Figure 1). Under isotonic conditions (150 mM Na+), DCP1A localized to ∼10-30 foci (each ranging ∼300-800 nm in diameter) per cell, whereas G3BP protein and polyA RNA, as markers of SGs (Patel et al., 2015), were dispersed throughout the cytosol (Figure 1A and S1A). Upon a short (2 min) hypertonic (300 mM Na+) shock, DCP1A, but neither G3BP nor polyA RNA, formed ∼200-300 foci per cell that were smaller (200-300 nm) than the pre-existing foci (Figures 1A and S1A). No significant change was observed even after prolonged (60 min) hypertonic treatment. At this later time point, both G3BP and polyA RNA showed significant focus formation (∼100-200 foci per cell, 200-300 nm in diameter; Figure 1A and S1A), thus in line with previous observations (Bounedjah et al., 2012). By contrast, after 2 min of treatment with sodium arsenite to induce oxidative stress, DCP1A foci were unchanged in number and diameter from those observed in unstressed cells, and G3BP and polyA RNA were still dispersed throughout the cytosol (Figures 1B and S1B). The number of DCP1A foci only marginally increased (∼25-40 foci per cell, 300-800 nm in diameter) in response to prolonged (60 min) arsenite stress, with a concomitant small increase in G3BP and polyA RNA foci (∼10-30 per cell, 400-1100 nm in diameter, Figures 1B and S1B). These data suggest that DCP1A and G3BP/polyA RNA, when visualized in their physiological contexts, assemble into microscopically detectable foci at distinct rates and extents in response to osmotic and oxidative stressors.

(A-D) Representative pseudocolored, combined IF – RNA-FISH images of U2-OS cells stained for DAPI (blue), DCP1A (green), or polyA RNA (red). Scale bar, 10 µm. (A) Cells were treated with isotonic (150 mM Na+) or hypertonic (300 mM Na+) medium for the appropriate time points. (B) Cells were mock treated with 1x PBS or treated with 0.5 mM SA for the appropriate time points. (C) Cells were first treated with hypertonic (300 mM Na+) media for the appropriate time points and then rescued with isotonic (150 mM Na+) media for various durations. (D) Cells were first treated with 0.5 mM SA for the appropriate time points and then rescued with medium containing 1x PBS for various durations.

(A-D) Representative pseudocolored immunofluorescence (IF) images of U2OS cells stained for DAPI (blue), DCP1A (green) or G3BP (red) and the corresponding quantification of average number of spots per cell. Scale bar, 10 µm. (A) Cells were treated with isotonic (150 mM Na+) medium or hypertonic (300 mM Na+) medium for the appropriate time points. (B) Cells were mock treated with 1x PBS or treated with 0.5 mM arsenite for the appropriate time points. (C) Cells were first treated with hypertonic media (300 mM Na+) for the appropriate time points and then rescued with isotonic (150 mM Na+) media for various durations. Bars with green and red outline depict data points from panel A. (D) Cells were first treated with 0.5 mM arsenite for the appropriate time points and then rescued with medium containing 1x PBS for various durations. Bars with green and red outline depict data points from panel B. n = 3, > 60 cells, ***p ≤ 0.0001, N.S. denotes non-significance by two-tailed, unpaired Student’s t-test.
Next, we tested whether the increased focus number could be rescued (Res) by first subjecting cells to stress and subsequently recovering them in regular, isotonic growth medium (Figures 1C-D and S1C-D). We observed that hypertonicity induced DCP1A foci rapidly disappeared, within 2 min, irrespective of the duration of the stress (Figure 1C). While a significant fraction of the G3BP and polyA RNA foci also rapidly disappeared (within 2 min), the kinetics of complete recovery to the baseline (i.e., pre-treatment) focus number differed from those of DCP1A (Figure 1C and S1C). By comparison, DCP1A, G3BP, and polyA RNA foci induced by arsenite stress did not disappear even after 60 min of rescue (Figure 1D and S1D). These data suggest that DCP1A and G3BP/polyA RNA foci show differences in the kinetics of both assembly and disassembly, and that the rapid phase separation of DCP1A in response to altered tonicity is distinct from SG formation.
Hypertonicity rapidly induces the formation of immobile DCP1A condensates in live cells
Since fixed-cell experiments revealed that the rapid phase separation of DCP1A condensates was distinct from SG formation over minutes/hours, we decided to probe the sub-cellular dynamics at greater temporal resolution. To this end, we subjected the previously developed UGD cell line (a U2OS cell line that stably expresses GFP-DCP1A; (Pitchiaya et al., 2019) to a systematic set of hypertonic conditions. We chose this cell line because it contains a similar number of DCP1A foci as the parental U2OS cells, and each of these foci compositionally resembles endogenous PBs (Liu et al., 2005). As a control, we first confirmed in transiently transfected U2OS cells that DCP1A rapidly and reversibly forms “condensates” (Banani et al., 2017) irrespective of the fluorescence tag to which it is fused (GFP, mCherry, Halo, or CLIP; Figure S2A). We noted that the condensation and rescue of SNAP tagged DCP1A were distinct from the other tags (Figure S2A), raising the possibility that the nature of tagging might interfere with phase separation. Next, live cell imaging of UGD cells subjected to a cycle of isotonic conditions, brief hypertonic stress, and isotonic rescue (Movie S1) recapitulated the rapid and reversible nature of DCP1A phase separation (Figure 1). Furthermore, imaging of UGD cells at various levels of tonicity (150 mM to 450 mM Na+) showed that the number of GFP-DCP1a condensates per cell rapidly and monotonically increases with the salt concentration (Figure 2A); however, the mobility of the condensates, as measured by their diffusion constants, decreases. Within the time frame of treatment, typically 1-3 min, the cells remained viable across all concentrations of Na+ and survived 225 mM Na+ for up to 24 h (Figure 2B).

(A) Representative pseudocolored images of U2-OS cells expressing DCP1A fused to different types of fluorescent or fluorogenic tags (green). Cells were treated with isotonic (150 mM Na+, 2 min) medium, hypertonic (300 mM Na+, 2 min) medium, or rescued with isotonic medium (2 min) after hypertonic treatment (2 min). Scale bar, 10 µm. Scatter plot of the number of foci per cell for each treatment condition is also shown. n = 2, > 5 cells per sample. (B) Average GFP intensity per UGD cell at various treatment and rescue conditions. n = 5, 300 cells per sample. (C) Percentage of GFP intensity within foci in UGD cells at various treatment and rescue conditions. n = 5, 300 cells per sample.

(A) Scatter plot of the number of foci per cell (top), violin plots of diffusion constants associated with DCP1A foci (bottom) and representative pseudocolored images of UGD cells (GFP, green) treated with growth medium containing various concentrations of Na+. n = 2, > 5 cells per sample, *p ≤ 0.01 by two-tailed, unpaired Student’s t-test. (B) Representative images of 96-well plate probed for cell viability by crystal violet staining (left) or cell-titer glo assay (right) across various Na+ concentrations and multiple time points. n = 3, with technical replicates for each n. (C and D) Scatter plot of the number of foci per cell (top) and violin plots of diffusion constants associated with DCP1A foci (bottom) within UGD cells treated with growth medium containing various levels if Mg2+ (C) or Ca2+ (D). n = 3, > 5 cells per sample.
Considering that many cellular processes depend on Mg2+ and Ca2+, we next examined whether DCP1A condensation was affected by increased concentration of these divalent metal ions in the growth medium. Both Mg2+ and Ca2+ induced GFP-DCP1A condensation only upon 100-fold increase over isotonic concentrations (Figure 2C, D), which corresponded to a significant increase in osmolarity to near double the osmolarity of isotonic growth medium (∼600 mOsm/L). These data suggest that DCP1A condensation occurs independently of the type of ion. Moreover, the rapid change in foci number generally occurs without a concomitant change in the total GFP fluorescence of the cell (Figure S2C), indicating that the GFP-DCP1A condensation is a direct response of the existing cellular protein to osmotic perturbation rather than an indirect response of protein expression or cellular signaling.
DCP1A phase separation is modulated by osmotic cell volume change
To distinguish between the possibilities that DCP1a condensation is a result of an increase in either specifically ionic or general osmotic concentration, we examined the sub-cellular effects of two non-ionic osmolytes, sucrose and sorbitol. Subjecting UGD cells to 300 mOsm/L of either of these osmolytes supplemented to regular growth media again resulted in the formation of immobile DCP1A condensates; however, cells recovered quickly when reversing to isosmotic medium (Figures 3A and S3A). These observations strongly suggest that DCP1A condensates form in response to osmotic shock rather than changes in ionic strength only.

(A) Scatter plot of the number of foci per cell (top), violin plots of diffusion constants associated with DCP1A foci (bottom) and representative pseudocolored images of UGD cells (GFP, green) treated with isosmotic (Iso) growth medium, hyperosmotic growth medium containing the non-ionic osmolyte Sorbitol (Sor), or rescued (Res) with isosmotic medium after Sorbitol treatment. n = 2, > 5 cells per sample. Scale bar, 10 µm. (B) Representative y-z projection of UGD cells (gray-scale) from 3-D imaging assay wherein the cell were treated with isotonic (150 mM Na+) medium, hypertonic (300 mM Na+) medium or rescued with isotonic medium after hypertonic treatment. n = 1, 4 cells per sample. Scale bar, 10 µm. Scatter plot of the fold change in cell volume, as normalized to the cell volume in isotonic conditions, is shown. (C) Representative pseudocolored images of a UGD cell (GFP, green) that was cyclically treated with isotonic (150 mM Na+) or hypertonic (300 mM Na+) medium. Scale bar, 10 µm. (D) Scatter plot of the fold change in foci number, as normalized to foci number in isotonic samples, associated with assay represented in C. Red line depicts exponential fit. n = 2, > 5 cells per sample. (E) Violin plots of diffusion constants associated with DCP1A foci, associated with assay represented in C. n = 2, > 5 cells per sample. (F) Bar plots of cell viability (by CellTiter-Glo assay), as normalized to isotonic samples, associated with assay represented in C. n = 3, with 3 technical replicates for each n.
Since hyperosmolarity is a state of increased extracellular osmotic pressure and causes cellular volume reduction by compensatory exosmosis (i.e., water loss), we hypothesized that DCP1A foci formation is the result of osmotic cellular compression causing an increase in intracellular molecular crowding (Guo et al., 2017; Miermont et al., 2013). To test this hypothesis, we estimated volume changes of UGD cells in hyperosmotic medium using DiI staining (Sukenik et al., 2018) and 3-dimensional (3-D) imaging (Figures 3B and S3B). We found that cell height, as a proxy for cell volume, rapidly (within ∼1 min) and monotonically decreased over the increasing range of tested osmotic conditions with a concomitant increase in the number of DCP1A foci. The cell height recovered partially on the same time scale upon reverting to isotonic medium, and the effect of these changes on DCP1a foci were independent of cell lineage (Figure S3C). Together, our data support a direct link between molecular crowding and GFP-DCP1A condensation.

(A) Scatter plot of the number of foci per cell (top), violin plots of diffusion constants associated with DCP1A foci (bottom). Representative pseudocolored images of UGD cells (GFP, green) were treated with isosmotic (Iso) growth medium, hyperosmotic growth medium containing the non-ionic osmolyte Sucrose (Suc, 2min) or rescued (Res) with isosmotic medium (2 min) after sucrose treatment (2 min). n = 2, > 5 cells per sample. Scale bar, 10 µm. (B) Representative x-y (green) and y-z (gray) projection of a UGD cell from 3-D imaging assay wherein the cell was treated with isotonic (150 mM Na+) medium or hypertonic (300 mM Na+) medium. n = 1, 4 cells per sample. Scale bars, 10 µm (x and y) and 5 µm (z). (C) Representative pseudocolored images of Caki-1 or HK-2 cells expressing GFP-DCP1A (green). Cells were treated with isotonic (150 mM Na+, 2 min) medium, hypertonic (300 mM Na+, 2 min) medium or rescued with isotonic medium (2 min) after hypertonic treatment (2 min). Scale bar, 10 µm. Scatter plot of the number of foci per cell (top) and violin plots of diffusion constants associated with DCP1A foci (bottom) for each treatment condition for Caki-1 or HK-2 cells are also shown. n = 2, > 5 cells per sample.
Since DCP1A exhibits rapid and reversible condensation dependent on the degree of osmotic cell volume change, and since mammalian cells repeatedly experience such osmotic perturbations, we examined the response of UGD cells to cycling osmotic volume change (Figure 3C, D). To this end, UGD cells were treated for 1 min with hypertonic medium and allowed to recover for 30 min, and this treatment regimen was repeated. Quantification of the number and diffusion constants of foci across the treatment regimen showed that the time-scales of DCP1A focus assembly (∼10 s) and disassembly (∼100 s), as well as changes in focus mobility, were highly similar across all cycles and occurred with minimal impact on cell viability (Figure 3C-F). We henceforth refer to this phenomenon of cytosolic DCP1A condensation as intracellular hyperosmotic phase separation (HOPS) and posit that it is a cellular adaptation to osmolarity-induced changes in molecular crowding.
HOPS of DCP1A depends on its trimerization domain and post-translational modification status
Macromolecular phase separation is widely thought to be driven by multivalent protein-protein and protein-nucleic acid interactions mediated by specific side chain interactions and structures (Guo and Shorter, 2015). To investigate the underlying molecular basis of DCP1A condensation, we first tested the dependence of HOPS on different DCP1A domains. While DCP1A does not contain any annotated nucleic acid binding domains, it contains two prominent protein interaction domains, an N-terminal EVH1 domain that interacts with the mRNA decapping protein DCP2, a C-terminal trimerization domain that interacts with EDC3/4, and a scaffolding protein of the decapping complex (Aizer et al., 2013). GFP-tagged truncation constructs of DCP1A’s N-terminal domain (NTD) or C-terminal domain (CTD) were transiently transfected into U2OS cells. Upon exposing these cells to hyperosmotic shock, we observed that the CTD showed rapid and reversible condensation similar to the full-length protein. In contrast, a truncation mutant containing the NTD did not show detectable foci upon hyperosmotic shock (Figure 4A-B). As the CTD mediates both DCP1a trimerization and EDC4 interaction, we tested whether EDC4 is responsible for HOPS of DCP1A to narrow down the basis of condensation. Compared to a scrambled (Scr) silencing RNA (siRNA) control, knockdown of EDC4 by siEDC4 resulted in reduced expression (∼2-fold) of GFP-DCP1A (Figure S4A-C) and larger GFP-DCP1A foci under isotonic conditions (Figure 4C-D), but did not prevent HOPS of DCP1A. In fact, the slight reduction in HOPS of DCP1A is consistent with the ∼2-fold reduced cytosolic availability of DCP1A via reduced expression and enhanced localization within large foci. Consistent with these findings, we found that the intracellular condensation of DCP1A was correlated with its cellular abundance (Figure S4D). These data strongly suggest that DCP1A homo-trimerization is a major driver of its HOPS.

(A) Western Blot of EDC4, DCP1A, and GAPDH after various siRNA treatment times (24, 48 and 72 hr post siRNA transfection). Bands labeled with “*” and “**” were detected by EDC4 and DCP1A antibodies respectively and either denote non-specific bands or shorter protein fragments. (B) Representative pseudocolored IF images of UGD cells expressing GFP-DCP1A (green), stained for EDC4 (red). Scale bar, 20 µm. Cells were either transfected with a scrambled siRNA (Scr) or siEDC4 for 48 h and then treated with isotonic (150 mM Na+, 2 min) medium or hypertonic (450 mM Na+, 2 min) medium. (C) Scatter plot of the average intensity of GFP (green) or EDC4 (Cy5, red) per UGD cell transfected with a scrambled siRNA (Scr) or siEDC4 in isotonic conditions. n = 2, > 20 cells per sample, *p ≤ 0.01, by two-tailed, unpaired Student’s t-test. (D) Scatter plot of GFP-DCP1a spot number (left) and spot area (right) plotted against sum fluorescent intensity of the cell, under isotonic (blue) and hypertonic (orange) conditions. Fold change in spot numbers is relative to the lowest spot count under isotonicity.

(A) Schematic of full length DCP1A, NTD, or CTD constructs (top, not to scale). EVH1 domain, trimerization domain, and the amino acid numbers are marked. Representative pseudocolored images of U2OS cells (GFP, green) transfected with GFP-NTD or GFP-CTD that were treated with isotonic (150 mM Na+) or hypertonic (300 mM Na+) medium (bottom). Scale bar, 10 µm. (B) Scatter plot of the number of foci per cell (top) and violin plots of diffusion constants associated with DCP1A foci (bottom) imaged in panel A. n = 3, > 5 cells per sample. (C) Schematic of DCP1A, DCP2 and EDC4 in the decapping complex (top, not to scale) in siEDC4 or Scr treatment conditions. Representative pseudocolored images of siEDC4 or Scr siRNA treated UGD cells (GFP, green) treated with isotonic (150 mM Na+) or hypertonic (300 mM Na+) medium (bottom). Scaled as in panel A. (D) Scatter plot of the number of foci per cell (top) and violin plots of DCP1A diffusion constants (bottom), associated with assay represented in C. n = 3, > 5 cells per sample. (E) Scatter plot of the number of foci per cell (top) and violin plots of DCP1A diffusion constants (bottom) within UGD cells that were pre-treated treated with DMSO, KI, or PI, and imaged in isotonic (150 mM Na+) medium, hypertonic (300 mM Na+) medium, or rescued (Res) with isotonic medium after hypertonic treatment. n = 3, > 5 cells per sample.
Previous reports have suggested that PB formation can be modulated by post-translational modification (PTM), as accompanying cell cycle progression (Aizer et al., 2008). We reasoned that if change in phosphorylation status would influence PB assembly and disassembly during the cell cycle, such modifications should also modify the protein’s response to molecular crowding. We stimulated global changes in phosphorylation using either a general phosphatase inhibitor (PI), okadaic acid, or the c-Jun N-terminal kinase inhibitor (KI), SP600125, on UGD cells. While the PI did not significantly alter HOPS of GFP-DCP1A compared to a DMSO treated control, the KI significantly increased the number of newly formed immobile condensates (Figure 4E). Additionally, PI treatment mediated a significant reduction in the mobility of DCP1A condensates even after rescuing the cells with isotonic media (Figure 4E). Together, these observations suggest that PTM modulates HOPS of proteins, likely by altering surface charges that protein-protein interactions depend on.
Multimeric proteins with a valency of at least 2 generally exhibit HOPS
Considering that the minimally required structural determinant of HOPS of DCP1A is only its trimerization domain (Figure 4), we reasoned that other self-interacting proteins with multimerization domains might also exhibit HOPS. To test this hypothesis, we performed an unbiased high-throughput IF analysis of ∼108 endogenous proteins in U2OS and UGD cells subjected to transient osmotic stress (Figure 5A-C). Since antibodies may exhibit cross-reactivity and impaired access to some proteins in osmotically compressed cells, we complemented high-throughput IF analysis by imaging osmotically perturbed U2OS cells transiently transfected with GFP-tagged proteins (Figure 5D and Methods). A combined analysis of both assays showed that monomeric proteins (e.g., GFP), dimeric proteins (e.g., TP53, AKT), and several proteins without annotated multimerization domains (e.g., PARP13) did not exhibit HOPS. By contrast, almost all multimeric proteins with a self-interaction valence of ≥2 (i.e. trimers and other higher-order multimers, including LCD bearing proteins such as DCP1A, HSF1, PKM2, PAICS, FUS, and TDP43), as well as several proteins with no known multimerization domain (e.g. ERp72) exhibited HOPS (Figure 5B-D). In some cases, we observed the disappearance of foci upon hyperosmotic shock, which rapidly reformed upon isotonic rescue (e.g., CDK12; Figure 5B, C). These observations support the hypothesis that multimeric proteins with a self-interaction valency of 2 or more generally undergo HOPS. Overall, our data suggest that the sub-cellular distribution of a significant fraction of the cellular proteome, 16% of which is annotated to be self-interacting (Perez-Bercoff et al., 2010), appears to be altered by osmotic compression. Our findings thus support a widespread and pervasive impact of HOPS on subcellular organization.

(A) Schematic of high throughput IF assay. (B) Representative pseudocolored IF images of U2OS cells stained for DAPI (blue, nucleus) and the appropriate protein (red). Cells were treated with isotonic (150 mM Na+) medium, hypertonic (300 mM Na+) medium, or rescued (Res) with isotonic medium after hypertonic treatment. Scale bar, 10 µm. Quantification of average number of spots per cell of the appropriate samples in panel B is shown. n = 3, > 50 cells per sample. (C) Heatmap representing the fold change in spot number of 108 proteins tested by high throughput IF, as normalized to isotonic conditions. “rep” denotes replicates. (D) Representative pseudocolored images of U2OS cells (GFP, green) transfected with the appropriate GFP-tagged construct and treated with isotonic (150 mM Na+) medium or hypertonic (300 mM Na+) medium. Scaled as in panel A. Inset depicts a zoomed-in area corresponding to a 15 × 15 µm2 magenta box. Scatter plot of the number of foci per cell for each construct is shown. n = 2, > 5 cells per sample.
HOPS of CPSF6 is correlated with hyperosmolarity-induced impairment of transcription termination
Hyperosmotic stress has been shown to impair transcription termination in certain cellular lineages, leading to continued transcription of regions downstream of annotated genes, and to be mediated by the impaired function of cleavage and polyadenylation factors (CPSFs) (Vilborg et al., 2015). To assess how hyperosmolarity affects the nascent transcriptome, which was expected to be highly sensitive to termination defects, in our osteosarcoma lineage, we performed nascent state RNA sequencing of nascent transcripts by 5-bromouridine metabolic labeling and sequencing (Bru-seq) and BruChase-seq after 30 min of hyperosmotic stress (Paulsen et al., 2014). We found that, indeed, the read density of sequences downstream of transcription end sites (TES) was significantly higher in the hypertonic samples than under isotonic conditions (Figures 6A, B and S6A). Performing steady-state RNA-seq of UGD cells subjected to prolonged (4 h) osmotic perturbations revealed that hyperosmotic stress also had a pervasive long-term effect that, strikingly, was reversed upon rescuing cells from hypertonic shock with isotonic medium (Figures S6B, C).

Representative pseudocolored images of U2OS cells (GFP, green) transfected with the appropriate GFP-tagged construct and treated with isotonic (150 mM Na+) medium or hypertonic (300 mM Na+) medium for 2 min. Scale bar, 10 µm. Inset depicts a zoomed-in area corresponding to a 15 × 15 µm2 magenta box. Constructs that exhibit HOPS are highlighted in orange.

(A) Ratio between read counts downstream (DS) and read-counts upstream (US) of TES for 836 genes assayed by BrU-Seq for each replicate. Cells were treated with isotonic (150 mM Na+, 30 min) or hypertonic (300 mM Na+, 30 min) mediums prior to sequencing. (B) DS:US ratio of > 18,000 genes that show transcript read-through in RNA-Seq assays. Cells were treated with isotonic (150 mM Na+, 4 h) medium, or hypertonic (300 mM Na+, 4 h) medium, or rescued (Res) with isotonic medium (4 h) after hypertonic treatment (4 h) prior to sequencing. (C) RNA-seq tracks of the RUNX3 locus under isotonic (150 mM Na+, 4 h) medium, hypertonic (300 mM Na+, 4 h) medium, or rescued (Res) with isotonic medium (4 h) after hypertonic treatment (4 h) prior to sequencing.

(A) Aggregate nascent RNA Bru-Seq enrichment profile across TESs. Relative bin density of ∼1256 genes expressed >0.5 RPKM and >30 kb long showing an ∼10 kb average extension of reads past the TES following exposure to hypertonic conditions for 30 min. Samples were prepared from cells treated with isotonic (150 mM Na+, red) or hypertonic (300 mM Na+, blue) medium for 30 min. (C) Bru-seq tracks across the ARID5B and RTKN2 genes showing transcriptional read-through of the TES. (C) Representative pseudocolored images of a U2OS cell transfected with GFP-CPSF6 (green) incubated with isotonic (150 mM Na+, red) medium and then treated with hypertonic (300 mM Na+, blue) medium for 1 min. Scale bar, 10 µm. (D) Model that explains the transcript read-through phenotype.
Finally, we asked whether impaired cleavage, polyadenylation, and HOPS of multimeric proteins may be related. Strikingly, CPSF6, a structural component of the CPSF complex (Elkon et al., 2013), underwent rapid HOPS in the nucleus (Figure 6C). Such condensates may sequester CPSF6 away from chromatin, thereby suggesting a possible mechanism for the functional impairment of CPSFs under hyperosmotic stress conditions (Figure 6D).
DISCUSSION
In this study, we report a multiscale (i.e., cellular, subcellular, and molecular) characterization of a seemingly widespread intracellular phase separation phenomenon in response to hyperosmotic stress, here termed HOPS (Figure 7). We find that a significant fraction of the multimeric proteome undergoes rapid and reversible intracellular redistribution into phase-separated condensates during osmotic cell volume change. Empirically, proteins with a self-interaction valency of ≥2 exhibit HOPS in response to changes in cell volume, and these changes are in turn intricately linked with altered hydration and molecular crowding during hyperosmotic stress.

Our multi-scale analysis has shown that HOPS of multimeric proteins is mediated by the concerted changes in cell volume, macromolecular crowding, and hydration.
Exosmosis leads to protein concentration increase, molecular dehydration, and HOPS
Intracellular water expelled upon hyperosmotic compression (i.e. exosmosis) is thought to originate from both “free” water molecules that constitute the bulk of the cell and water molecules bound to cellular solutes and involved in macromolecular solvation (Ball, 2017). On the one hand, the loss of free water upon exosmosis leads to cell volume loss and a concomitant increase in cellular concentration that will shift the monomer-multimer equilibrium of a protein towards multimerization, which may be facilitated by depletion attraction (Marenduzzo et al., 2006). On the other hand, the loss of bound water will result in decreased protein hydration, which may lead to protein precipitation by increasing the surface exposure of hydrophobic regions (Muschol and Rosenberger, 1997). Rehydration rapidly replenishes both types of water molecules to shift the monomer-multimer equilibrium back towards the solvated monomer, dissolving the condensate.
It is thought that hydrophobic patches found in homo-multimeric proteins can spontaneously interact upon hydration loss or “dewetting” (Jensen et al., 2003; Liu et al., 2005), whereas the phase separation driven by LCDs and RNAs is posited to involve larger interaction networks (Wang et al., 2018); this differences, thus, lead to two distinct mechanisms with different condensation rates. The high speed and high reversibility of HOPS of multimeric proteins appear most consistently with the former mechanism wherein the rapid condensation leads to large, amorphous assemblies (Figure 7). Just like in protein folding, the cost in translational and polypeptide chain entropy upon condensation into such large, slowly diffusing aggregates is expected to be slightly more than compensated by the enthalpic gain of hydrophobic patch association.
The features and functional consequences of widespread intracellular HOPS
We observe that increasing the intracellular crowding ∼2-fold (based on the up to ∼2-fold change in cell height) leads to the formation of a large number of DCP1a condensates with greatly reduced mobility; further, cellular volume recovery readily reverses both the condensation and decreased mobility (Figures 2, 3). Additionally, we find that the cellular concentration of the protein monomer affects the size and number of condensates (Figure S4D). The latter observation implies that, under low protein concentration conditions, our ability to identify proteins undergoing HOPS may be limited by our fluorescence microscope’s resolution. A conservative estimate, based on cytoplasmic redistribution of GFP signal into hyperosmotic condensates (Figure S2B, C), suggests that we can detect 10-mers and any higher-order condensates. This level of sensitivity has allowed us to use IF to curate a high-confidence list of endogenous proteins that do and do not undergo HOPS (Figure 5). Thus, we can define the protein features that govern HOPS, primarily the requirement for a homo-multimerization domain of valency ≥2 that is common among cellular proteins.
It is becoming increasingly clear that excluded volume effects mediated by molecular crowding affect macromolecular structure, protein stability, enzyme activity and nucleo-cytoplasmic organization (Daher et al., 2018; Delarue et al., 2018; Hancock, 2004; Minton, 2001; Sukenik et al., 2018). Previous work has noted the potential for phase separation to dynamically buffer the intracellular protein concentration (Alberti et al., 2019). More directly, we find that the structural pre-mRNA cleavage and polyadenylation factor CPSF6 (Elkon et al., 2013) undergoes nuclear HOPS, which we observe to be correlated with transcriptome-wide functional impairment of transcription termination (Figure 6).
HOPS may serve as a rapid cellular sensor of volume compression
The rapid time scales of hyperosmotic cell volume compression, volume recovery under isotonicity, and cell viability after multiple osmotic cycles (Figures 2, 3) that we observe concur with prior reports on cell volume changes (Guo et al., 2017; Hersen et al., 2008; Miermont et al., 2013). Our data, which indicate that even a 20% reduction in cell volume by osmotic compression can mediate HOPS, reinforce evidence of the high sensitivity of the multimeric proteome towards volume changes. Our findings are consistent with the notion that the eukaryotic proteome is delicately balanced near the threshold of phase separation (Walter and Brooks, 1995; Wilson, 1899). In fact, it stands to reason that the interaction energies and concentrations of homo-multimeric proteins may have evolved to facilitate rapid crossing of their individual phase separation thresholds if, and only if, cellular conditions demand.
Notably, our HOPS-associated cell volume changes are comparable to the rapid volume changes – also a result of exosmosis – occurring during cell adhesion and migration through confined spaces (Guo et al., 2017; Watkins and Sontheimer, 2011), as well as those associated with the cell cycle (Tzur et al., 2009). Incidentally, homeostatic processes that may be expected to suppress phase separation, such as PTMs and allosteric effects by metabolically compatible osmolytes, operate over the time scales (minutes to hours) of the cell cycle. Consistent with this expectation, we find that the loss of phosphorylation enhances the extent of HOPS (Figure 4).
Perhaps the most striking aspect of HOPS is its rapid onset, which is faster than the speed of canonical stress responses (Wheeler et al., 2016). This feature is similar to recent reports of rapid nuclear condensation of DEAD-box RNA helicase DDX4 in response to environmental stress (Nott et al., 2015), and of transcriptional co-activator YAP in response to hyperosmotic stress (Cai et al., 2018). Notably, prolonged exposure to hyperosmotic conditions, similar to other environmental stressors, triggers the ISR and subsequent assembly of SGs, often localized adjacently to pre-formed DCP1A condensates or PBs (Figure 1) (Kedersha et al., 2005). These observations support a model whereby phase-separated PB components and, possibly, other homo-multimeric proteins serve as “first responders” of osmotic compression, anchoring and gatekeeping SG assembly and the subsequent stress response. Such early volume sensors may be critical for suspending cellular biochemistry until an appropriate protective or corrective action has been initiated. This escalating response may be critical since osmotic changes in the environment are unpredictable and can rapidly fluctuate, yet have widespread implications in an array of physiological and disease contexts. For instance, cells in the renal medulla frequently and rapidly experience high salt concentrations resulting in up to four-times the osmolarity of serum during urine production (Lang et al., 1998). Extreme dehydration can lead to hypernatremia, a state of serum hyperosmolarity characterized by elevated Na+ levels exceeding 145 mM, and is associated with pervasive physiological dysfunction (Nilsson and Sunnerhagen, 2011). During such prolonged stress, initiation of the ISR may then lead to long-term adaptation. For instance, long-lasting condensates of the protein WNK1, which notably also is a homo-multimer, have been observed in viable kidneys of mice raised on high-K+ diets (Boyd-Shiwarski et al., 2018).
Both rapid and prolonged HOPS are reversible (Figure 1) and can mediate widespread effects, including impairment of transcription termination (Figure 6) (Vilborg et al., 2015), YAP-programmed transcription initiation (Cai et al., 2018), inhibition of ribosomal translocation (Wu et al., 2019), and modulation of RNA silencing (Pitchiaya et al., 2019). While other mechanisms may be also at play, protein sequestration away from the site of their function provides a straightforward biophysical explanation for many of these effects (Figure 6). In fact, such a mechanism may also explain the defects in transcription termination observed in cells exposed to prolonged heat shock (Cardiello et al., 2018), suggesting that protein sequestration might be a common mechanism across multiple stress responses. Future studies will help better understand the connection between MLO formation and protective cellular mechanisms heralded here.
AUTHOR CONTRIBUTIONS
S.P. conceived the study. A.P.J. performed all live-cell imaging experiments. S.P. and X.J. performed all fixed cell assays and phenotypic analyses. L.X. constructed several plasmids. P.B., K.B., M.C. and M.L. performed and analyzed the sequencing assays. S.P., A.P.J., A.M.C. and N.G.W. designed the study. S.P., A.P.J. and N.G.W. and wrote the manuscript, and all authors provided feedback on the manuscript.
DECLARATION OF INTERESTS
The authors declare no competing interests.
METHODS
DNA and RNA oligonucleotides
DNA oligonucleotide with 30 consecutive T’s (Oligo-dT36-Cy5) contained a Cy5 dye at the 3’ end and was purchased from IDT. Dyes were attached after oligonucleotide synthesis to a 3’ amino group on a C6 carbon linker and were HPLC purified by the vendor. Negative control siRNA (Scr, Ambion negative control siRNA 1) and siRNA against EDC4 (siEDC4, siRNA targeting EDC4 SMARTPool) were purchased as ready-to-use duplexes from Thermo-Fisher and Dharmacon respectively.
Plasmids
Most plasmids were purchased from Addgene or were shared by independent labs. GFP-tagged proteins candidates were selected based on gene ontology annotation containing terms “identical protein binding” (GO:0042802), “protein homotrimerization” (GO:0070207), “protein trimerization” (GO:0070206), “protein dimerization” (GO:0046983) and “protein tetramerization” (GO:0051262) and independently verified for their self-interacting ability by the tool SLIPPER (http://lidong.ncpsb.org/slipper/index_1.html). The resulting pools of proteins were selected to cover a range of valences. The proteins tested in each class are: monomeric, p53; dimeric, AKT, Rac2; trimeric, HSF1; tetrameric, PKM2; octomeric, PAICS; IDR-containing: FUS, TDP-43. pcDH-Halo-DCP1a, pcDH-SNAP-DCP1a, pcDH-GFP-DCP1a, pcDH-mCherry-DCP1a, and pcDH-CLIP-DCP1a were constructed by first sub-cloning the DCP1A open-reading frame (ORF) from pEGFP-DCP1A into the pcDH backbone to generate pcDH-DCP1A. The ORFs of Halo, SNAP, GFP, mCherry and CLIP were PCR amplified from pFN21A (Promega), pSNAPf (NEB), pEGFP-C1 (Clontech), pEF1a-mCherry (Clontech), and pCLIPf (NEB), respectively. These amplicons were then sub-cloned into the pcDH-DCP1A backbone to generate the appropriate plasmids.
Cell culture
U2OS and U2OS-GFP-DCP1a (UGD) cells were propagated in McCoy’s 5A medium supplemented with 10% fetal bovine serum and Penicillin-Streptomycin (GIBCO, #15140). UGD cells were kept under positive selection with 100 µg/mL G418. Hypertonic medium was prepared by supplementing regular growth medium with 10x PBS such that the appropriate sodium concentration was achieved. Isotonic medium was prepared by mock supplementing regular growth medium with 1x PBS, whose volumes matched that of 10x PBS in hypertonic medium. Oxidative stress was induced by treating cells with 0.5 mM sodium arsenite (SA). Hyperosmotic medium with sucrose or sorbitol were prepared by directly dissolving the appropriate reagent to achieve 300mOsm/L (300 mM). Plasmid transfections for GFP imaging were achieved using Fugene HD (Promega, # E2311) as per the manufacturer’s protocol. UGD cells were transfected with siRNAs using Lipofectamine RNAimax (Thermo-Fisher, # 13778030) as per the manufacturer’s protocol. For live cell imaging of Halo-DCP1A, CLIP-DCP1A, and SNAP-DCP1A, cells were treated with 100 nM of the appropriate ligand for 30 min in growth medium without phenol-red. After the treatment, cells were washed three times in phenol-red free medium and placed back in the incubator for 30 min, prior to imaging. For live cell imaging, cells were imaged in phenol-red free medium containing 1% FBS and the appropriate tonicity.
For DCP1A expression time course data (Figure S4D), U2OS cells were transfected with pGFP-DCP1A using Fugene HD. Transfected cells were imaged at 12, 24, 36, 48 and 72 hours after transfection to allow the expression level of the protein to build up. Cells were images under isotonic and hypertonic conditions at each time point to cover about 2-orders of magnitude of total GFP fluorescence intensity.
Cell viability assays
100 µL of 10, 000-20, 000 cells were seeded per well of a 96 well white bottom plate or 96 well transparent plate in regular growth medium. 24 h after seeding, cells were treated with appropriate isotonic or hypertonic medium. Cell growth and viability were measured on the 96 well white bottom plate as an end point measurement for each time point and/or treatment using the Cell-titer GLO assay (Promega, # G7570) based on manufacturer’s instructions. 96 well transparent plates were fixed with 100% methanol at RT for 10 min, stained with crystal violet (0.5% in 20% methanol) for 20 min at RT, washed with water and photographed.
Immunofluorescence
Cells were grown on 8 well chambered coverglasses (Thermo-Fisher, # 155383PK), washed with PBS, formaldehyde fixed and permeablized using 0.5% Triton-X100 (Sigma, T8787-100ML) in 1x PBS at room temperature (RT) for 10 min. It is important that the tonicity of the wash buffer and fixative matched that of the cell medium. Cells were then treated with blocking buffer containing 5% normal goat serum (Jackson Immunoresearch, 005-000-121), 0.1% Tween-20 (Sigma, P9416-50ML) in 1x PBS at RT for 1 h. Primary antibodies (pA) were diluted in blocking buffer to appropriate concentrations and cells were treated with pA at RT for 1 h. Following three washes with the blocking buffer for 5 min each, cells were treated with secondary antibodies (sA) diluted in blocking buffer to appropriate concentrations. Then, following two washes with the blocking buffer and two washes with 1x PBS for 5 min each, cells were mounted in solution containing 10 mM Tris/HCl pH 7.5, 2 × SSC, 2 mM trolox, 50 μM protocatechiuc acid, and 50 nM protocatechuate dehydrogenase. Mounts were overlaid with mineral oil and samples were imaged immediately.
Combined IF and RNA fluorescence in situ hybridization
Following the final 1x PBS washes in the abovementioned IF protocol, cells were formaldehyde fixed and permeablized overnight at 4 °C using 70% ethanol. Cells were rehydrated in a solution containing 10% formamide and 2 × SSC for 5 min and then treated with 100 nM Oligo-dT30-Cy5 (IDT) for 16 h in 2 × SSC containing 10% dextran sulfate, 2 mM vanadyl-ribonucleoside complex, 0.02% RNAse-free BSA, 1 μg μl−1 E. coli transfer RNA and 10% formamide at 37 °C. After hybridization, cells were washed twice for 30 min at 37 °C using a wash buffer (10% formamide in 2 × SSC). Cells were then mounted in solution containing 10 mM Tris/HCl pH 7.5, 2 × SSC, 2 mM trolox, 50 μM protocatechiuc acid, and 50 nM protocatechuate dehydrogenase. Mounts were overlaid with mineral oil and samples were imaged immediately.
Microscopy
Highly inclined laminated optical sheet (HILO) imaging was performed as described (Pitchiaya et al., 2012; Pitchiaya et al., 2013, Pitchiaya et al., 2017, Pitchiaya et al., 2019) using a cell-TIRF system based on an Olympus IX81 microscope equipped with a 60x 1.49 NA oil-immersion objective (Olympus), as well as 405 nm (Coherent ©, 100 mW at source, ∼65 µW for imaging CB-Dex), 488 nm (Coherent ©, 100 mW at source, ∼1.2 mW for imaging GFP), 561 nm (Coherent ©, 100 mW at source, ∼50 µW for imaging mCh) and 640 nm (Coherent ©, 100 mW at source, 13.5 mW for imaging Cy5) solid-state lasers. Quad-band filter cubes consisting of z405/488/532/640rpc or z405/488/561/640rpc dichroic filters (Chroma) and z405/488/532/640m or z405/488/561/640m emission filters (Chroma) were used to filter fluorescence of the appropriate fluorophores from incident light. Emission from individual fluorophores was detected sequentially on an EMCCD camera (Andor IXon Ultra) for fixed cell imaging. For live cell imaging cells were seeded on Delta T dishes (Bioptechs, 04200417C) and imaged on a Bioptechs temperature control module (Bioptechs, 0420-4). High-throughput IF was performed on the same microscope using a 60x 0.9 NA air objective. The multi-well scanning mode in Metamorph®, the acquisition software, was used to control a motorized stage (MS-2000, Applied Scientific Instrumentation Inc.).
Image Analysis
For measuring the average GFP signal per cell, GFP intensity thresholds were set (Huang threshold in image J) to automatically identify cell boundaries. Background intensity, outside of cell boundaries, was subtracted from GFP signal to extract the background corrected GFP intensity within cells. The corrected intensity was then divided by the total number of thresholded (Huang threshold in image J) DAPI stained nuclei to extract the average GFP intensity per cell. For measuring the percentage of GFP signal within foci, images were first thresholded (percentage threshold in image J) to create masks of foci and the GFP intensity within this mask was calculated. Background corrected foci intensity was then divided by the background corrected GFP intensity within cells. Average number of foci per cell in IF images were identified using the find maxima function in image J. Briefly, a 5-pixel radius rolling ball was used to subtract the background from images, which were subsequently convolved with a 5×5 pixel kernel and a 2-pixel radius Gaussian blur function. These image processing steps enhanced the definition of a spot that were easy to identify with the find maxima function. The noise tolerance (or threshold value) in the find maxima function was maintained across samples that were compared. The total number of spots was then divided by the number of nuclei to calculate the mean spots per cell. Imaris was used for single particle tracking. Custom Matlab scripts were used to extract diffusion rates of the trajectories by fitting the mean squared displacement (< r2 >) over the first five observation time windows to a line and extracting the slope. Diffusion rates (D) were then calculated as per the 2-D diffusion equation from
 The obtained logarithm of the obtained diffusion values was plotted as histograms in Origin which were then visualized as violin plots using custom scripts in Matlab. Final figures were assembles in Illustrator.
RNAseq and Bru-seq
For steady-state RNAseq, UGD cells were grown in 10 cm dishes, treated with the appropriate medium (isotonic, 150 mM Na+ or hypertonic, 300 mM Na+) and cells were harvested by scraping in RIPA buffer (Thermo-Fisher, PI89900). Total RNA was then extracted with QIAGEN RNeasy midi kit (Cat. No. 75144). RNA integrity was assessed using an Agilent Bioanalyzer. Each sample was sequenced in duplicated using the Illumina HiSeq 2000 (with a 100-nt read length). Strand-specific paired-end reads were then inspected for sequencing and data quality (for example, insert size, sequencing adaptor contamination, rRNA content, sequencing error rate). Libraries passing quality control were trimmed of sequencing adaptors and aligned to the human reference genome, GRCh38. Sample were demultiplexed into paired-end reads using Illumina’s bcl2fastq conversion software v2.20. Reads were mapped onto hg38 human reference genome using TopHat2. First the reference genome was indexed using bowtie2-build. Paired end reads were then aligned to the reference genome using TopHat2 with strand-specificity and allowing only for the best match for each read. Aligned file was used to calculate strand specific read count for each gene using bedtools multicov with -s option. A known genes gtf file downloaded from UCSC was used to calculate read count. Two additional bed files were created for each gene representing 10kb upstream and 10kb downstream of the TSS. For each gene, read count was calculated for its upstream and downstream region as well with strand-specificity. To estimate an RNA read-through event, we calculated the ratio of read count for 10kb downstream of TSS to 10kb upstream of TSS after normalizing it for gene expression and sequencing depth. A box plot was plotted for this normalized ratio for the three samples using R software and ggplot2 package. Evaluation of significance was performed using the student’s t-test. The aligned bam file of the sample was converted into bigwig format using deepTools bamcoverage. The resultant bigwig file was uploaded onto IGV for viewing of the RNA read-through event.
For Bru-seq, UGD cells were grown on T75 flasks to >80% confluency. Flasks were washed once with fresh medium before bromouridine (BrU) treatment. BrU solution was diluted to a final concentration of 2 mM in McCoy’s 5A medium containing 2% FBS containing 145 mM (isotonic) or 300 mM (hypertonic) monovalents. Cells were incubated in the appropriate bromouridine-containing media for 30 minutes. Cells treated with hypertonic media were allowed to recover in isotonic media for 30 minutes or 6 h in isotonic media before they were harvested. Nascent transcript libraries for Bru- and Bru-Chase seq were performed and sequenced as described (Paulsen et al, 2014).
Data from both RNAseq and Bru-seq were analyzed as follows. We identified the transcription end sites (TES) of genes by GENCODE annotation and defined a 10 kb region upstream (US) and downstream (DS) of each TES, especially for genes that did not have any neighboring gene DS within the 10 kb distance. We then computed reads per kilobase million (rpkm) values for these US and DS bins and computed a DS/US ratio.
Statistical analysis
Graphpad-Prizm and Origin were used for statistical analysis and plotting. For pairwise comparisons, p-values were calculated based on non-parametric unpaired t-tests with a Kolmogorov-Smirnov test. For comparisons involving more than 2 samples, one-way-ANOVA tests were used with a Geisser-Greenhouse correction.
ACKNOWLEDGEMENTS
APJ was supported by NIH T-32-GM007315. SP was supported by an AACR prostate cancer research fellowship and an NCI-SPORE Career Enhancement Award. A.M.C. is a NCI Outstanding Investigator, Howard Hughes Medical Institute Investigator, A. Alfred Taubman Scholar, and American Cancer Society Professor. This work was supported by NIH grant R01 GM122803 and a University of Michigan Comprehensive Cancer Center/Biointerfaces Institute research grant to N.G.W and NCI Prostate SPORE (P50 CA186786) to A.M.C. We thank X. Cao, F. Su and R. Wang for technical assistance with sequencing library preparation, and M. Denies for help with some initial experiments. We also acknowledge NSF MRI-ID grant DBI-0959823 (to N.G.W.) for seeding the Single Molecule Analysis in Real-Time (SMART) Center, whose Single Particle Tracker TIRFM equipment was used for much of this study with support from J.D. Hoff. Finally, we would like to thank N. Kedersha and Y. Shav-Tal as sources of several plasmids.
REFERENCES


