

Abstract
The conditions who denotes the presence of an immune disease are often represented by interaction graphs. These informative, but complex structures are susceptible to being perturbed at different levels. The mode in which that perturbation occurs is still of utmost importance in areas such as reprogramming therapeutics. In this sense, the overall graph architecture is well characterise by module identification. Topological overlap-related measures make possible the localisation of highly specific module regulators that can perturb other nodes, potentially causing the entire system to change behaviour or collapse. We provide a geometric framework explaining such situations in the context of inflammatory bowel diseases (IBD). IBD are important chronic disorders of the gastrointestinal tract which incidence is dramatically increasing worldwide. Our approach models different IBD status as Riemannian manifolds defined by the graph Laplacian of two high throughput proteome screenings. Identifies module regulators as singularities within the manifolds (the so-called singular manifolds). And reinterprets the characteristic IBD nonlinear dynamics as compensatory responses to perturbations on those singularities. Thus, we could control the evolution of the disease status by reconfiguring particular setups of immune system to an innocuous target state.
Introduction
The response of a living system facing threats is a decision-making process depending on multiple factors. Some of those factors such as limited resources or energetic cost shape the different phenotypic status of a disease. Hence, the identification of “transition gates” (hereinafter referred as singularities) between those phenotypic phases opens a path to eventual therapeutic interventions with the aim of reconfiguring the system to a normal status. In particular, these status can be expressed as different grades of inflammation when the immune system of the gastrointestinal tract reacts to the presence of harmful stimuli. If the inflammatory conditions of the colon and small intestine become chronic, then, they are all generally grouped under the heading of Inflammatory bowel disease (IBD). IBD is an intestinal disease of unknown cause whose prevalence is in continuous growth at present. Crohn’s disease (CR) and ulcerative colitis (UC) are the main variants of IBD. UC, for instance, is characterised by chronic inflammation and ulceration of the lining of the major portion of the large intestine (colon). According to the European Medicines Agency UC presents a prevalence of 24.3 per 100,000 person-years in Europe. That means there are between 2.5 and 3 million people having IBD in the European Union (1) and this figure could be increased to 10 million worldwide in 10 years. The majority of patients are diagnosed early in life and the incidence continues to rise with 178,000 new cases of UC each year; therefore, the particular effect of UC on health-care systems will rise exponentially. IBD is a continuous threatening state that may produce aberrant cell proliferation leading to broad epithelial alterations such as dysplasia. This scenario of chronic active inflammation in patients with UC increases the risk for the development of colorectal carcinoma (CRC) and often requires total colectomy in case of intensive medical treatment failure or positive by high-grade dysplasia. Thus, detecting and eliminating or even reverting precursor dysplastic lesions in IBD is a practical approach to preventing the development of invasive adenocarcinoma. Currently, practitioners make decision on what new therapy to be used in such cases based only on their grade of expertise in inflammatory domains. Due to the limited and largely subjective knowledge on this pathology, we were encouraged to seek the biomarker(s) whose symbiotic actions influence the molecular pathogenesis of the risk for colorectal cancer in IBD. In this work, we develop a framework for identifying those dynamical players by abstracting the IBD progression. Since this disease can be naturally observed under the prism of a “phase transition” process (2), we sample the expression profiles of patients from a manifold with singularities; evaluating the functions of interest to the IBD status geometry near these points. Given this assumption, we construct weighted protein co-expression graphs of each variant of the disease by means of a proteomic high-throughput screening consisting of two cohort of 24 patients each (discovery and validation). Next, we localise key players of any identified modules (3) that are relevant to the IBD status, i.e., control, active and quiescent. Then, we use functions associated to the eigen-genes of selected proteins across patients (3) to describe the potential of protein expressions with respect to the disease status. And we lay emphasis on the behaviour of the graph Laplacians corresponding to points at or near singularities, where different transitions of disease come together. This scenario enables the identification of potential drug targets in a protein-coexpression graph of IBD, accounts for the nonlinear dynamics inherent to IBD evolution and open the door to its eventual regression to a controlled trajectory (4–6). Overall, this manuscript envisages providing clinicians with useful molecular hypotheses of dysplastic regulation and dynamic necessaries prior to make any decision on the newest course of the treatment of individual patients in IBD. And ultimately accelerate drug discovery in health-care system.
Results
WGCNA Identifies Novel Immune Drivers Causing Singularities in the Status of Disease Progression
Intuitively, one might envisage the progression of a disease as a set of immune subsystems influencing each other as response to an undesired perturbation of the normal status. In this exchange, there exist specific configurations that cause the entire system changes its behaviour or collapse. We were, then, interested in identifying the potential modulators of IBD state whose interaction may explain the disease progression as a system instead of simply investigating disconnected drivers dysregulated in their expression levels. To this end, we provide protein significance measures of protein co-expression graphs of each type of IBD disease (CR and UC). Furthermore, those are simultaneously topological and biologically meaningful measures since they are defined by cor|xi, S|ξ with ξ ≥ 1 and based on the clinical outcomes of two proteomic samples (SI Text) that capture the IBD phenotype or status, i.e., control, active and quiescent. We fixed this status as a quantitative trait defined by the vector S = (0, 1, −1). And applied the Weighted Gene co-Expression Network Analysis (7, 8) between the two samples, herein considered as discovery and validation cohorts. For the sake of clarity, we only show the results obtained for the UC graph (Fig. 1). The matched inspection of its expression patterns in connectivity (Fig. 1A), hierarchical clustering of their eigengenes (9) and its eigengene adjacency heatmap (Fig. 1B-D) suggests that the most correlated expression patterns with the IBD status (Fig. 1E) are highlighted in greenyellow (97 proteins) and green (215 proteins) respectively. Whereas in CR those coloured in magenta (123 proteins) and midnightblue (41 proteins) yielded the highest correlations (Fig. S1). Nevertheless, we only kept green (UC) and magenta (CR) patterns since the others were not well preserved in the graph corresponding to the validation cohort (Fig. 2B-C and Fig. S2). Next, we wonder about the biological functions these patterns of similar protein expression to the IBD status were enrich of. To response this question, the weighted co-expression subgraph of the green (resp magenta) pattern was interrogated (Fig. 1F) using GO (10). As we expected, the green and magenta expression patterns present overabundance of IBD-related with multiple processes that are essential for the disease progression (Table S1) such as innate immune response in mucosa, positive regulation of B cell proliferation (Fig. 3C) or inflammatory response (Fig. 3E). Complementary, pathways highly related to the disease progression such as intestinal immune network for IgA production (hsa04672) (11) or known pathways such Inflammatory bowel disease (hsa:05321) are also found (Table S1). In addition, the intersection of dysregulated protein sets involved in such pathways between UC and CR is very low (Fig. 3 and Fig. S3). As positive control the differential expression of well-known proteins participating in IBD such as CAMP or LYZ in UC and LCN2 or IFI16 both in UC and CR are also detected. In particular, the set composed by the proteins STAT1, AZU1, CD38 or NNMT in UC or DEFA1, IGHM, PGLYRP1 and ERAP2 in CR are robustly associated with the status of the disease (i.e. p ~ O(e-3)). These nodes, and other frequently-occurring nodes such as SYK and CD74, are attractive candidates for experimental verification. Some of these proteins work in tandem, with control sets formed by S100A9 and S100A8 identified in innate immune response process. Strikingly, some proteins such as CTSH presented in processes such as adaptive immune response or regulation of cell proliferation show similar expression between active and quiescent UC status (Fig. S4). Moreover, in CR the regulation of immune response process displayed similar expression in the active and quiescent status for all its proteins mostly belonging to the immunoglobulin heavy variable protein family that participate in the antigen recognition (Fig. S5). It should be also pointed that proteins more expressed in the quiescent than in the active status such as IGHV3-7 or IGKV2 are mainly identified during the CR progression (Fig. S6).
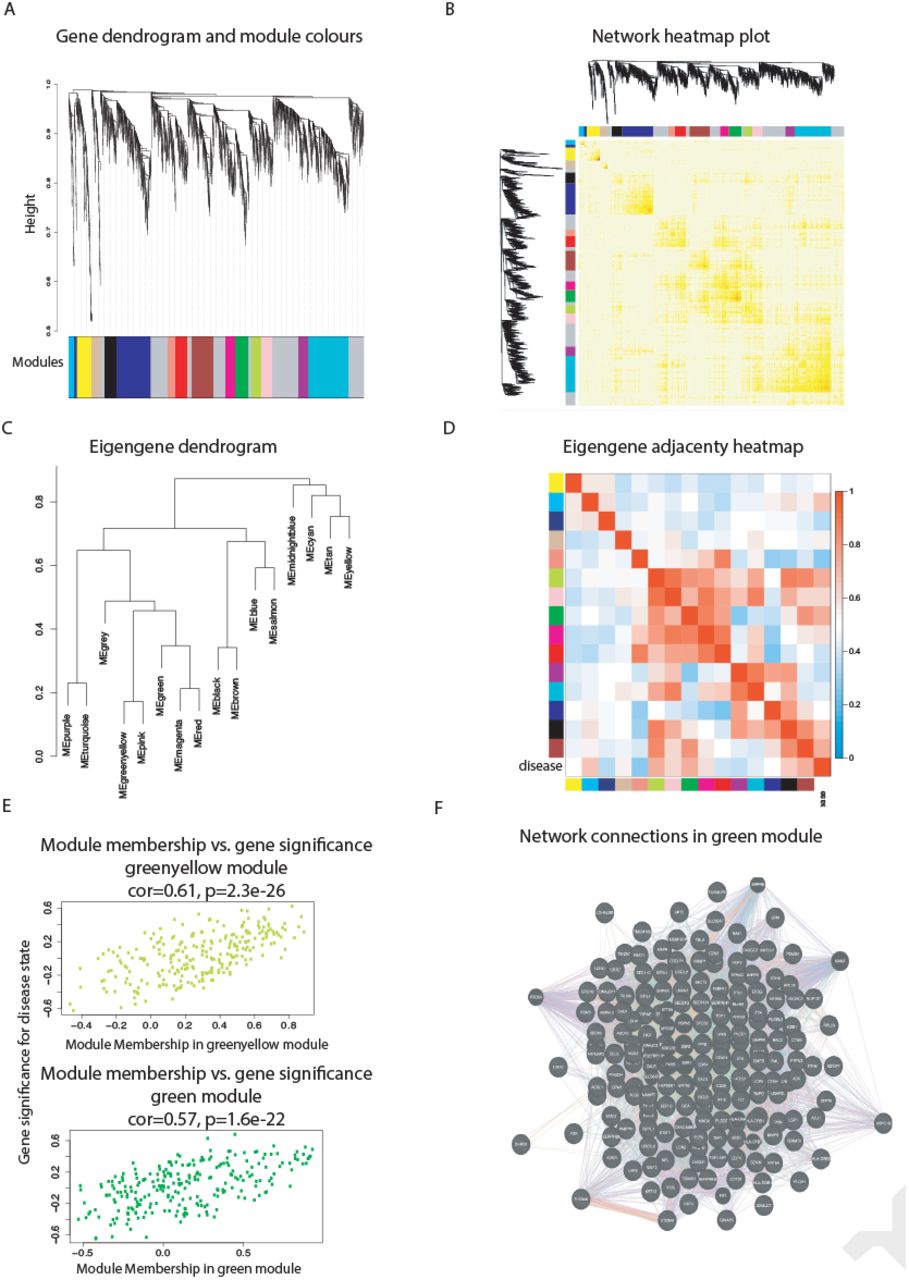
(A) Hierarchical cluster tree of the 3,910 proteins analysed. The colour bands provide a simple visual comparison of module assignments (branch cuttings) based on the dynamic hybrid branch cutting method. Modules in grey are composed by “housekeeping” proteins. (B) Topological Overlap Matrix (TOM) plot (also known as connectivity plot) of the network connections. proteins in the rows and columns are sorted by the clustering tree. Light colour represents low topological overlap and progressively darker red colour represents higher overlap. Clusters correspond to squares along the diagonal. The cluster tree and module assignment are also shown along the left side and the top. (C) Hierarchical clustering dendrogram of the eigengenes based on the dissimilarity diss(q1, q2) = 1 − cor(E(q1), E(q2)). (D) Visualisation of the eigengene network representing the relationships among the modules and the disease status. The eigengene adjacency Aq1, q2 = 0.5 + 0.5cor(E(q1), E(q2)). (E) Protein significance versus module membership for disease status related modules. Both measurements are highly correlated reflecting the high correlations between the IBD progression and the respective module eigengenes (i.e. greenyellow and green). (F) Graph of the green module enriched with subgraphs functionally involved in IBD progression.

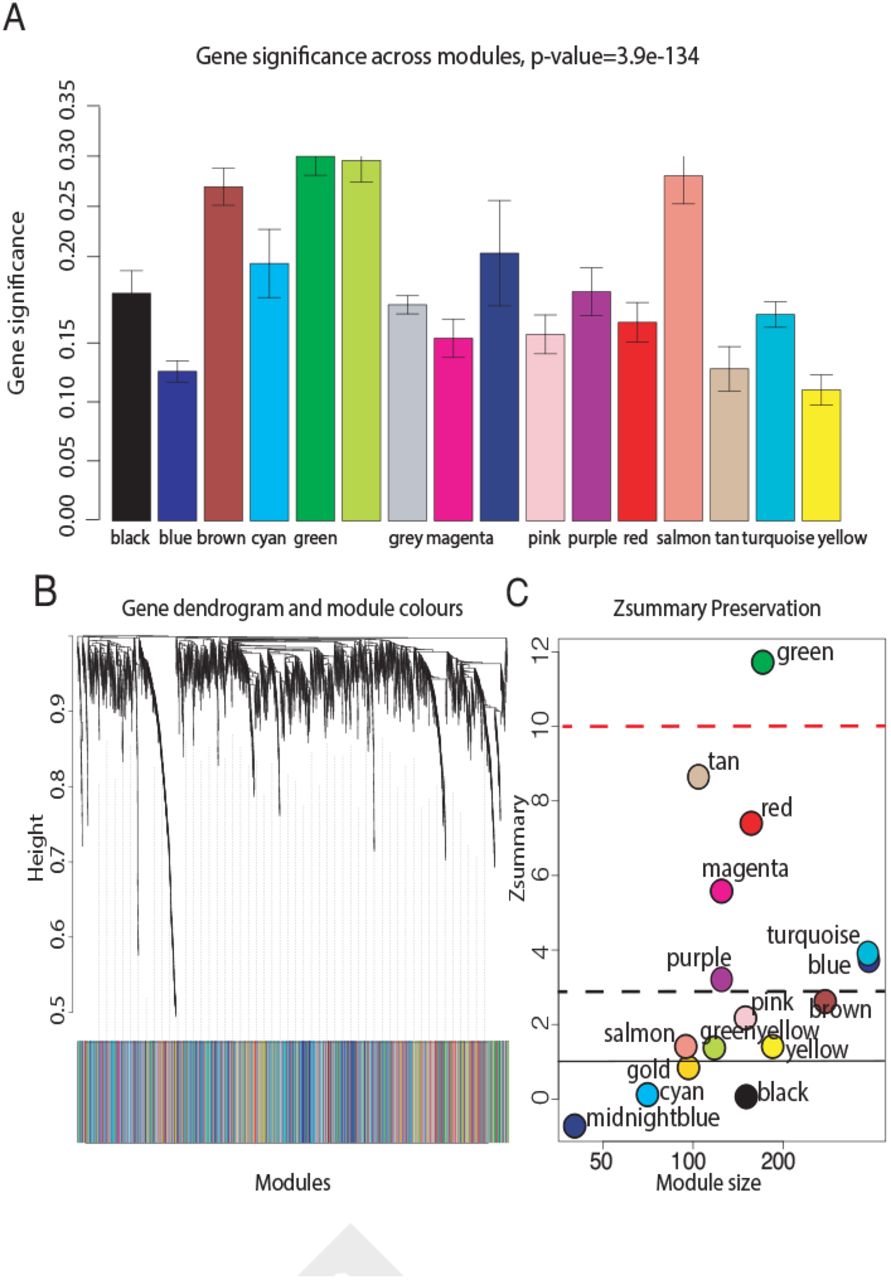
(A) The module significance (average protein significance) of the modules. The underlying protein significance is defined with respect to the patient disease status (B) The consensus dendrogram for discovery and validation RCH coexpression graphs. (C) The composite statistic Zsummary (Eq.9.1 in (12)). If Zsummary > 10 there is strong evidence that the module is preserved (13). If Zsummary < 2, there is no evidence that the module preserved. Note that Zsummary shows a strong dependence on module size. The green UC module shows high evidence of preservation in the validation UC graph.
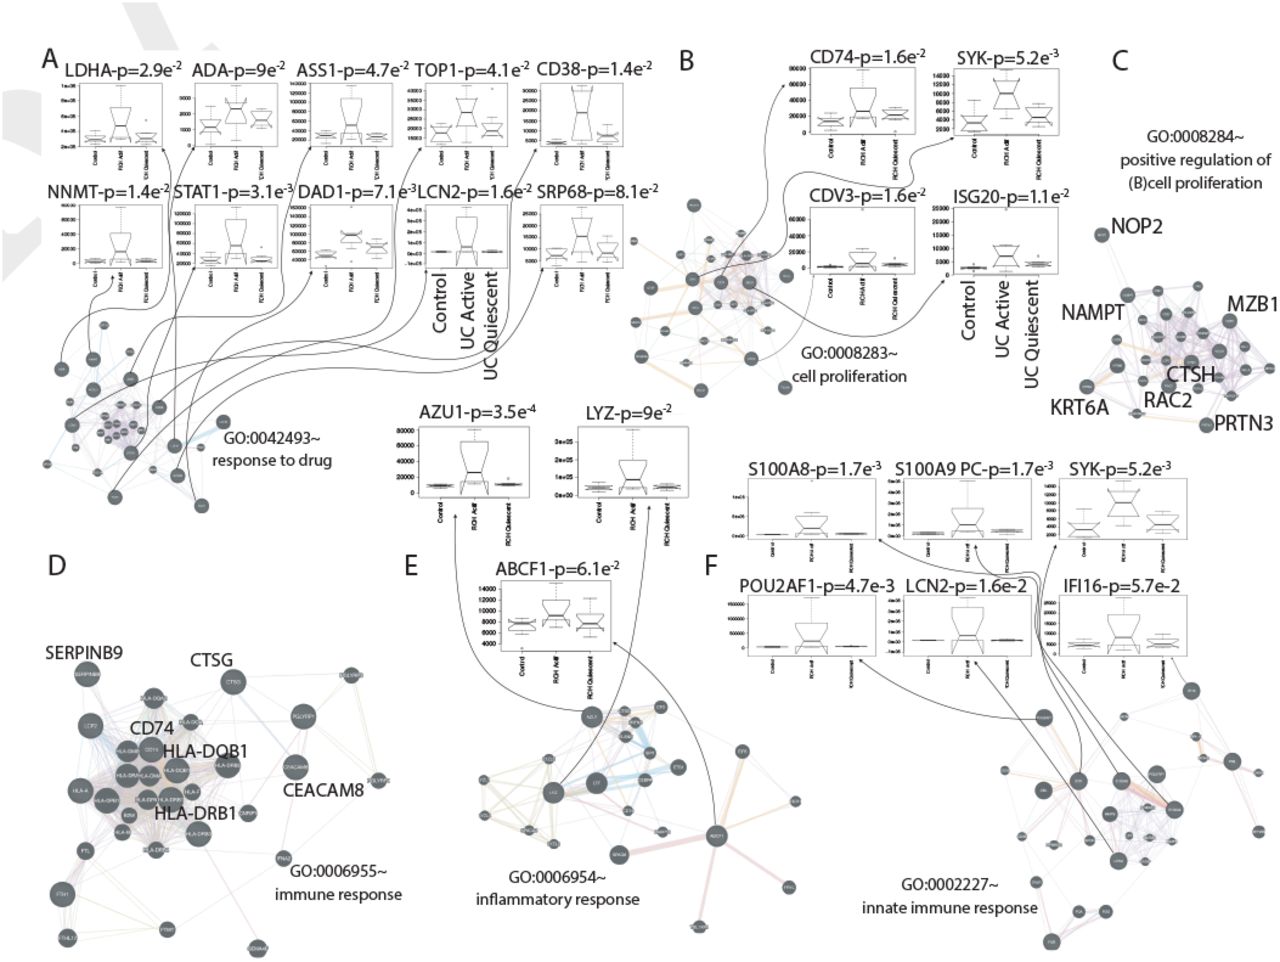
(A) Response to drug. (B) Cell proliferation. (C) Positive regulation of B cell proliferation. (D) Immune response. (E) Inflammatory response. (F) Innate immune response. The protein interaction graphs were constructed using Genemania (14). Edge colouring of the graphs amount to: purple stands for Coexpression, orange for Predicted, light-blue for Pathway, light-red for Physical interactions, green for Shared protein domains and blue for Co-localisation. Boxplots of expression for the most attractive drivers respect to UC status are indicated by floating arrows at the top of each subgraphs. Initial P upon the boxplot title amount to p-value associated to the IBD status correlation, whereas PC stands for positive control, i.e., proteins already described as IBD related. For the sake of simplicity, we highlighted some candidates simply by its identifiers.
In the light of our computational predictions the realisation of short-term actions, sometimes pharmacologically preferable to permanent changes, on the identified novel immune drivers of IBD status can be effective. Remarkably, an experimental identification of such modifications would be not tractable otherwise.
IBD Progression Can Be Geometrically Interpretable as the Intersection of Manifolds with Boundaries
Now, we enhance the important role the geometry plays in interpreting the nature of the IBD dynamics. Notably, the geometry of IBD status can be learnt using the differential structure defined by those proteins selected as candidates in an on top space. Each IBD status is abstracted as a Riemannian manifold, and construct the graph Laplacian based on these same candidates to figure out how the system gets cross from one to other status. Hence, we describe the domain of IBD progression as intersection of three manifolds, i.e., Ωc, Ωq and Ωa (Fig. S7). Then, the eigengenes associated to the candidate proteins (Fig. S8 and S9) are taken as points at or near a set of singularities in the manifolds intersection. And, later, we inspect the behaviour of their graph Laplacian to define a potential where the dynamic of IBD status through the manifolds maybe modelled.
Let Ln,h be the graph Laplacian appropriately scaled by  and constructed from the data of 38 candidate proteins selected in UC (resp. 19 in CR), using the Gaussian kernel with bandwidth h (SI Text). Yet, we identify the cross from control to active status of the disease with an intersection-type singularity since it can be naturally considered a “phase transition” as described in Belkin et al. (2, 15). Whereas the active-quiescent pass is interpreted as an edge-type singularity since the manifold sharply changes direction (i.e., from disease to control-like status). We are particularly interested in the former scenario, which involves the intersection of the two different manifolds Ωc and Ωa. Thus, for a given point x1 ∈ Ωc consider its projection x2 onto Ωa and its nearest neighbour x0 in the singularity. If n1 and n2, are the directions to x0 from x1 and x2 respectively and D1 and D2 are the corresponding distances calculated as the Kullback-Leibler divergence (16) between each status. Lhf(x1) can be approximated by
  . Note Φ1, Φ2 are scalar functions whose form and type singularity correspond. Both functions are explicitly calculated in 1 for the intersection-type singularity. To perform this calculation, we apply Theorem 2 pg. 37 in (2) first to establishing the conditions to analyse the behaviour of the graph Laplacian near the intersection of the two 8-manifolds
  (i.e. the interior of the smooth Ωc eventually with boundary) and
  embedded in
  . Their intersection Ωc ∩ Ωa is a smooth manifold of dimension l (≤ 7). Let f be a continuous function over
  whose restriction
  , is C2-continuous. Given a x ∈ Ωc near the intersection, let x0 be its nearest neighbour in Ωc ∩ Ωa, and x1 (resp. x2) be its projection in the tangent space of
  at x0 (resp. in the tangent space of
  at x0). Put II
  . For a sufficiently small h, we have
 where n1 and n2 are the unit vectors in the direction of x0 − x1 and x0 − x2, respectively, and θ is the angle between n1 and n2 measured as the disease incidence during the cohorts recruitment (see Table 1). From this, we can see that for a point x on the intersection or near intersection, Lhf(x) is of
  the form where the coefficient C depends on the derivatives of f and the position of x.
Manifolds incidence θ, kernel search ϕκ and eigengene form fi(x). First row corresponds to the optimal selection.
This calculation provides us with a proper IBD potential (Fig. S10), describing the control-active set, that will be used in further dynamical enquiries.
Therapeutic reconfiguration of the IBD Complex Space
Following Cornelius et al. (4), we wanted to identify temporary actions in the expression of the selected therapeutic targets that potentially control the dynamics of IBD status. To this end, we construct a control perturbations in an eight-dimensional system. This consists of a particle defined as the eigengene associated with one of the selected proteins across patients in their corresponding manifold of definition, i.e., Ωc, Ωq and Ωa. We evaluate, then, its expression in function of the potential calculated in the previous section. The system of ordinary differential equations (ODEs) describing this particle at or near an intersection-type singularity as introduced above maybe simplified as:

Right-hand side of ODEs defining system, according to Newton’s second law, i.e., if y = (x, v):

Before solving the systems of ordinary differential equations defined in 3, we optimised the dissipation parameter η (Fig. 4) by performing a 100 bootstrap simulations (17). With η = 0.1, the system has two stable fixed points, one at x < 0 and the other at x > 0 (with dx/dt = 0 and sd ~ O(6.5e-8)). If we continue the steady state of the system from a starting point near to the origin (i.e. 0.075), there exists a bifurcation in −0.08 that well separates the two “basin of attraction” xD and xC representing the bistable domain (Fig. 5) of the IBD status (SI Text). This scenario holds the non-linear dynamics implicit in the progression of IBD. Importantly, it captures the iterative interventions on the expressions of the previously selected proteins required to effectively brings the system to a non-active status from an uncontrolled path of the IBD status. Let yD and yC be the positions of stable fixed points minimising Lh f(x) at xD and xC respectively. We first fix an initial state near xD to take then a state in the basin of yD, and try to drive it to the basin of yC. This resulted in a pertinent class of control perturbations highlighted as red arrows on the left hand side of Fig. 5. Complementary, we also calibrated the class of compensatory perturbations causing the dynamic of a state on an unbounded orbit, i.e. x → +∞, be driven onto the basin of yC. Similarly to the previous case, this class was also represented by a red arrow, but this time on the right hand side of Fig. 5. Specifically, we find that we are able to rescue the same pre-active or quiescent status above with an average distance in norm of O(e−20) of a feasible target status. These interventions affect a small number of proteins that in turn are multi-target, which is highly desirable provided IBD status progression is believed to be in a multi-facet cellular components synchrony. The dynamics of UC and CR share a unique pattern, but involving a few different proteins in the reconfiguration of their systems. Consequently, we are able to program actions on promising therapeutic targets what is unaffordable from an experimental point of view by systematic screenings; what enhances the potential of our methodology.
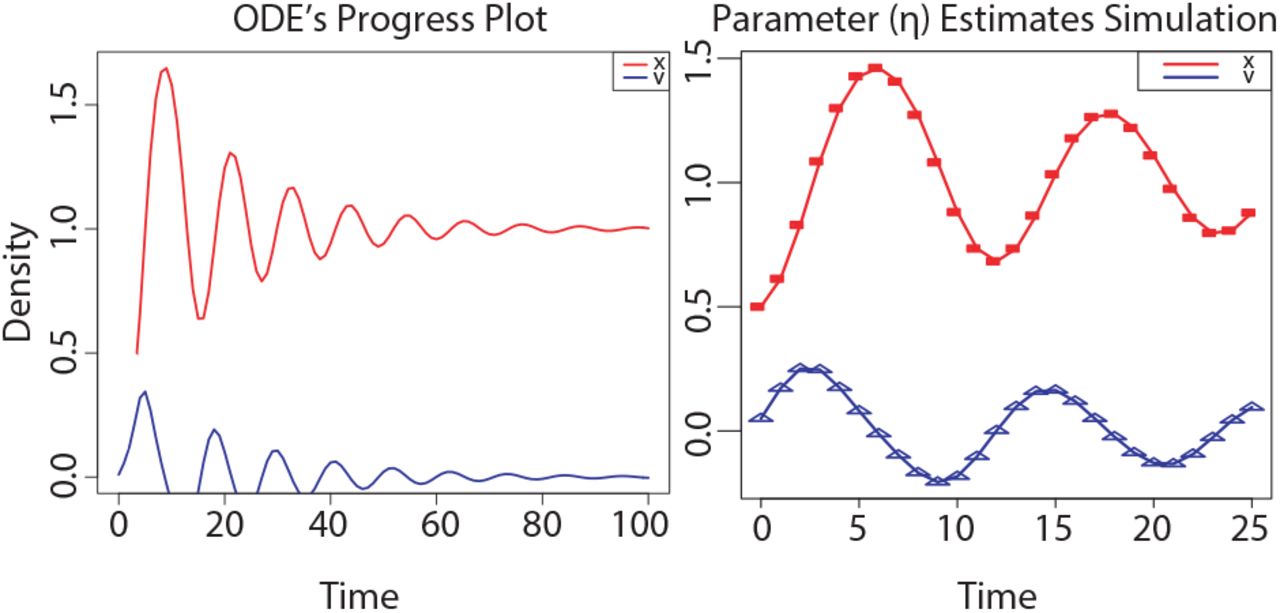
(A) Time plot ofthe ODE’s system associated to IBD status. (B) Curves show the model for the best estimated parameters released upon a 100 bootstrap iterations, and the symbols depict the data.

Light green and violet represent the basins of attraction of the stable states xD (Disease) and xC (Control or Latent), respectively, while white corresponds to unbounded orbits, (left and right hand side red arrows) Iterative construction of the perturbation for an initial state in the basin of xD with xC as a target (Left hand side), and for an initial state on the right side of both basins with xD as a target (Right hand side). Dashed and continuous lines indicate the original and controlled orbits, respectively. Red arrows indicate the full compensatory perturbations. Individual iterations of the process are shown in the insets (for clarity, not all iterations are included).
Conclusions
We introduce a systematic strategy to identify potential immune drivers whose variation in expression can explain the different status displayed in the evolution of two cohorts of IBD patients. To this end, we model IBD status by the intersection of special geometric varieties called manifolds. And leverage the graph Laplacian to identify points, on or nearby their intersection, with highly specific module regulators of protein co-expression graphs. These graphs were constructed based on high-throughput proteome screenings of the two samples of IBD patients, i.e., discovery and validation cohorts. Then to make this methodology more biological meaningful, we can test our predictions by means of experiments that study how specific interventions influence the reprogramming of IBD status, either via high-throughput sequencing surveys of validation populations (18) or by immunofluorescence specific to given antibodies (19). The comparison between theory and experiment will provide insight into the functional constraints of immune system in the recognition of bio-drivers varying when facing an intestinal chronic inflammatory threat.
The continuous trade-off amongst the available resources in living systems determines, in a certain way, their response to many situations of stress. To put this mechanism of response in motion, organisms tend to deploy a large diversity of components, such as cell types or proteins (20, 21), each sensitive to a small section of their domain. For example, the colon supports the interplay between reactive oxygen and nitrogen species overproduction or cytokines growth factors, that collectively represent a pivotal role of behaviourally aspects in IBD-induced carcinogenesis (22). Likewise, the role of the binomial composed by the innate and adaptive immune system in IBD therapies involves dozens of feedback loops invoking and sustaining chronic inflammation. However, how the immune system sparks a particular response to repel an IBD threat remains confusing, though it is thought to be immune and non-immune based, with an accepted role of the gut microbiota and non-immune derived cells of the inflammatory cascade including chemokines and inflamma-somes (23). In this case, the multifaceted information process limits the repertoire of the immunological machinery. To deal with those specific environmental forces, living systems wisely prioritise their resources in accordance with their costs, and constraints (24). In this work, we have shown how the immune system response in IBD is subjected to such combination of elements, what could fix the status of IBD during its evolution. Our finding reproduces an optimal framework to detect novel immune driver-type specific to IBD status and relates it to the concept of their non-linear dynamics nearby singular topological settings (25). In this context, limiting regions of phenotypic space are modelled by means of Rie-mannian manifolds revealing themselves suitable to reflect the important competition between resources and costs when that eventually exceeds a vital threshold in IBD. In general this unbalanced response forces the system to drive trajectories of IBD patients to undesirable status of disease (26), our model would lead those trajectories to a region of initial conditions whose trajectories converge to a desirable status–similar to the “basin of attraction” introduced in (4). The connection between the identified immune drivers-type specific and their implication in the evolution of IBD network status becomes even clearer analysing the results yielded by our dynamical model where the pass from one to other status could explain the synergy between innate/adaptative immune resources and their energetic cost and grow in relation to their success in securing resources. Although this study is a characterisation by oversimplification of the adaptive immune system detecting dysplastic lesions in IBD, we expect that our methodology and results will be instrumental also for other diseases and thus have a more wider application for the biomedical field and associated health care systems.
Materials and Methods
The calculations related to these sections were implemented using scripts based on R for weighted graphs analysis (wgcna package (27)), in-house Matlab© (2011a, The MathWorks Inc., Natick, MA) functions for the analysis of singularities on manifolds and Python for nonlinear optimisation of control perturbations.
Data
A total of 48 IBD patients were distributed in two cohorts of 24 samples each composed by 8 patients stratified by status of disease, i.e., control, active and quiescent.
Proteomic Screening
LC-MS/MS acquisition in samples of 30μg of 3,910 proteins was prepared from the groups of patient biopsies running on a NUPAGE 4-12% acrylamide gel (Invitrogen) and stained in Coomassie blue (Simply-blue Safestain, Invitrogen). Peptides and proteins identifications and quantification by LC-MS/MS were implemented by Thermo Scientific, version 2.1 and Matrix Science, version 5.1.
WGCNA
We adopted the standard flow of WGCNA (7) to constructing the protein graphs of UC and CD, detecting protein modules in term of IBD status co-expression and detecting associations of modules to phenotype i.e., control, active and quiescent disease with a soft-threshold, ξ, determined according to the scale-free topology criterion (SI Text). Gene ontology analyses coupled with bioinformatics approaches revealed drug targets and transcriptional regulators of immune modules predicted to favourably modulate status in IBD.
Limit Analysis of Graph Laplacian on Singular Manifolds
It is known by generalisation of Fourier analysis (28) that graph Laplacian converges, in the interior points of its domain, to the Laplace-Beltrami. Moreover, the eigenfunctions associated to this operator act as natural basis for the L2 functions used to represent data on the manifold (29). The points nearby phenotypic changes of the disease space are not interior though. Hence, we must draw upon the definition of limit from (2) if we want to analyse the behaviour of our infinite graphs Laplacian. Specifically, Ln,h, n = ∞, Lhf(x) in UC and CD, when x is on or nearby a singular point, h is small and the function  , is fixed.
For a fixed h we define Lh as the limit of Ln,h as the amount of data tends to infinity:

The graph Laplacian is scaled by the Gaussian kernel Kh with bandwidth h. Note that p(x) is defining a piecewise smooth probability density function on  . Such distribution is composed by i.i.d. 48 random samples
  corresponding to the IBD patients. Thus, if we apply to 4 the analysis already described in Section 2 of results in our intersection-type singularities on each IBD status manifold, we deduce 1.
Nonlinear Optimisation
We learn from (4) how to optimise the interventions set needed to control the evolution of our disease model. This control procedure is iterative and consists of minimising the residual distance between the target state, x*, and the system path x(t) at its time of closest approach, tc. To ensure the existence of admissible perturbations in the system herein represented by the vector expressions 6,7 and also to limit the magnitude of the solution δx0 of the optimisation problem 8, some few constraints must be introduced (SI Text). Then finding the particular solution, δx0, becomes a nonlinear programming problem (NLP) that can then be properly defined as:


Where the matrix M(x0; t) is the solution of the variation equation dM = dt = DF(x) · M subject to the initial condition M(x0; t0) = 1. And  denotes the incremental perturbation from the previous iteration.
ACKNOWLEDGEMENTS
We acknowledge the financial support by Institut National de la Santé et de la Recherche Medicale (INSERM), Inception IBD, Inserm-Transfert, Association Franois Aupetit (AFA), Université Diderot Paris 7, and the Investissements d’Avenir programme ANR-11-IDEX-0005-02 and 10-LABX-0017, Sorbonne Paris Cité, Laboratoire d’excellence INFLAMEX.
Bibliography


