

Abstract
Motivation Fraud is a pervasive problem and can occur as fabrication, falsification, plagiarism or theft. The scientific community is not exempt from this universal problem and several studies have recently been caught manipulating or fabricating data. Current measures to prevent and deter scientific misconduct come in the form of the peer-review process and on-site clinical trial auditors. As recent advances in high-throughput omics technologies have moved biology into the realm of big-data, fraud detection methods must be updated for sophisticated computational fraud.
Results In the financial sector, machine learning and digit-preference are successfully used to detect fraud. Drawing from these sources, we develop methods of fabrication detection in biomedical research and show that machine learning can be used to detect fraud in large-scale omic experiments. Using the raw data as input, the best machine learning models correctly predicted fraud with 84-95% accuracy. With digit frequency as input features, the best models detected fraud with 98%-100% accuracy.
Availability and Implementation All of the data and analysis scripts used in this project are available at https://github.com/MSBradshaw/Holden.
Contact sam_payne{at}byu.edu
Supplemental Information Supplemental figures accompany the manuscript online
Introduction
Fraud is a pervasive problem and can occur as fabrication, falsification, plagiarism or theft. Examples of fraud are found in virtually every field, such as education, commerce and technology. With the rise of electronic crimes, specific criminal justice and regulatory bodies have been formed to detect sophisticated fraud, creating an arms-race between methods to deceive and methods to detect deception. The scientific community is not exempt to the universal problem of fraud, and several studies have recently been caught manipulating or fabricating data (George and Buyse, 2015; Kupferschmidt, 2018) or are suspected of it (Al-Marzouki et al., 2005). More than two million scientific articles are published yearly and ~2% of authors admit to data fabrication (Fanelli, 2009). When asked if their colleagues had fabricated data, positive response rates rose to 14-19% (Fanelli, 2009; George and Buyse, 2015). This potentially means tens to hundreds of thousands of articles are published each year with manipulated data.
Fraud in biological data represents a growing problem, as the scale of datasets can make it easier to hide data manipulation. Recent advances in high-throughput omics technologies have moved biology into the realm of big-data. Many diseases are now characterized in populations, with thousands of individuals characterized for cancer (Blum et al., 2018), diabetes (TEDDY Study Group, 2007), bone strength (Orwoll et al., 2005), and health care services for the general populace (Bycroft et al., 2018). Large-scale characterization studies are also done for cell lines and drug responses (Barretina et al., 2012; Subramanian et al., 2017). This transition in biology, where deep molecular characterization of biological samples is now routinely available, points to a future where clinical trial requirements might include omics data collection.
Current trail monitoring methods include auditing, site monitoring, data reviews and central monitoring (Knepper et al., 2016; Baigent et al., 2008). The decision to use these forms of oversight and at what frequency is not driven by empirical data but rather is determined by clinics’ usual practice (Morrison et al., 2011). The emerging data deluge challenges the effectiveness of traditional auditing practices to detect fraud, and several studies have suggested addressing the issue with improved centralized and independent statistical monitoring (Baigent et al., 2008; George and Buyse, 2015; Calis et al., 2017). However, these recommendations are given chiefly to help ensure safety and efficacy of the study, not data integrity.
In 1937, physicist Frank Benford observed in a compilation of 20,000 numbers that the first digit did not follow a uniform distribution as one may anticipate (Benford, 1938). This pattern holds true in most large collections of numbers, including scientific data. Comparing a distribution of first digits to a Benford distribution can be used to identify deviations from the expected frequency, often because of fraud. Recently Benford’s law has been used to identify fraud in financial records of international trade (Barabesi et al., 2018) and money laundering (Badal-Valero et al., 2018). It has also been used in smaller scale to reaffirm suspicions of fraud in clinical trials (Al-Marzouki et al., 2005) and medical studies (Hein et al., 2012).
We explore methods of data fabrication and detection in molecular omics data using supervised machine learning and Benford’s law-like digit preferences. The data used in this study comes from the Clinical Proteomic Tumor Analysis Consortium (CPTAC) cohort for endometrial carcinoma, which contains copy number alteration (CNA) measurements from 100 tumor samples. We created 50 additional fake samples, or fake patients, for these datasets. Three different methods of varying sophistication are used for fabrication: random number generation, resampling with replacement and imputation. We show that machine learning and digit-preference can be used to detect fraud with near perfect accuracy.
Methods
Real Data
The real data used in this publication originated from the genomic analysis of uterine endometrial cancer. As part of the Clinical Proteomics Tumor Analysis Consortium (CPTAC), 100 tumor samples underwent whole genome and whole exome sequencing and subsequent copy number analysis. We used the results of the copy number analysis as is, which is stored in our GitHub repository at https://github.com/MSBradshaw/Holden.
Fake Data
Fake data used in this study was generated using three different methods. In each method, we created 50 fake samples which were combined with the 100 real samples to form a mixed dataset. The first method to generate fake data was random number generation. For every gene locus, we first find the maximum and minimum values observed in the original data. A new sample is then fabricated by randomly picking a value within this gene specific range. The second method to generate fake data was sampling with replacement. For this, we create lists of all observed values across the cohort for each gene. A fake sample is created by randomly sampling from these lists with replacement. The third method to generate fake data was imputation. The R package missForrest (Stekhoven and Bühlmann, 2012) was repurposed for data fabrication. A fake sample was generated by first creating a copy of a real sample. Then we iteratively nullified 10% of the data and imputed these NAs with missForrest until every value has been imputed. See Supplemental Figure 1.

Methods of Data fabrication. (A) The random method of data fabrication identifies the range of observation for a specific locus and then randomly chooses a number in that range. (B) The resampling method chooses values present in the original data. (C) The imputation method iteratively nullifies and then imputes data points from a real sample.
Machine Learning Training
With a mixed dataset containing 100 real samples and 50 fake samples, we proceeded to create and evaluate machine learning models which predict whether a sample is real or fabricated (Supplemental Figure 2). The 100 real and 50 fake samples were both randomly split in half, one portion added to a training set and the other held out for testing. Using Python’s SciKitLearn library, we evaluated multiple machine learning models, gradient boosting (GBD), Naïve Bayes, Random Forest, K-Nearest Neighbor (KNN), Multi-layer Perceptron (MLP) and Support Vector Machine (SVM). Training validation was done using 100-fold cross validation. We note explicitly that the training routine was never able to use testing data. After all training was complete, the held-out test set was then fed to each model for prediction and scoring. We used simple accuracy as a metric. For each sample in the test set, ML models would predict whether it was real or fabricated. Model accuracy was calculated as the number of correct predictions divided by the number of total predictions. The entire process of fake data generation and ML training/testing was repeated 50 times. Different random seeds were used when generating each set of fake data. Thus fake samples in all 50 iterations are distinct from each other. All of the data and analysis scripts used in this project are available at https://github.com/MSBradshaw/Holden.

Training and testing overview. After creating 50 fake samples using any one of the three methods of fabrication, the 100 real samples and 50 fake samples were randomly split into a train and test set of equal size and proportions (50 real and 25 fake in each set). The training sets were then used to train various machine learning models using 100 fold cross validation. Next, trained models were used to make predictions on the testing data. Predictions were then scored with total accuracy.
Results
Our goal is to explore the ability of machine learning methods to identify fabricated data hidden within large datasets. Although there are many situations where data fabrication might be present, we chose a scenario wherein researchers are trying to obtain enough subjects to have a sufficiently powered study. For example, if the power calculation estimates that 75 subjects are required to observe a given effect, but financial constraints only allow for a cohort of 50 subjects. In this scenario, researchers might be tempted to fabricate data for an additional 25 subjects to meet regulatory requirements.
Fake Data
The real data used in this study comes from the Clinical Proteomic Tumor Analysis Consortium (CPTAC) cohort for endometrial carcinoma, specifically the copy number alteration (CNA) data. This real data was paired with fabricated data and used as an input to machine learning classification models (see Methods). Three different methods of data fabrication were used in this study: random number generation, resampling with replacement, and imputation (Supplemental Figure 1). The three methods represent three realistic ways that an unscrupulous scientist might create novel data. Each method has benefits and disadvantages, with imputation being both the most sophisticated and also the most computationally intense and complex. As seen in Figure 1, the random data clusters far from the real data. Both the resampled and imputed data cluster tightly with the real data in a PCA plot, with the imputed data also generating a few reasonable outlier samples.

Copy number data for the real and fabricated samples are shown. The fabricated data created via random number generation is clearly distinct from all other data. Fabricated data created via resampling or imputation appears to cluster very closely with the real data.
To look further into the fabricated data, we examined whether fake data preserved correlative relationships present in the original data (Supplemental Figure 3). This is exemplified by two pairs of genes. PLEKHN1 and HES4 are adjacent genes found on chromosome 1p36 separated by ~30,000 bp. Because they are so closely located on the chromosome, it is expected that most copy number events like large scale duplications and deletions would include both genes. As expected, their CNA data has a Spearman correlation coefficient of 1.0 in the original data, a perfect correlation. The second pair of genes, DFFB and OR4F5, are also on chromosome 1, but are separated by 3.8 Mbp. As somewhat closely located genes, we would expect a modest correlation between CNA measurements, but not as highly correlated as the adjacent gene pair. Consistent with this expectation, their CNA data has a Spearman correlation coefficient of 0.27. Depending on the method of fabrication, fake data for these two gene pairs may preserved these correlative relationships. When we look at the random and resampled data for these two genes, all correlation is lost (Supplemental Figure 3 C, D, E and F). Imputation, however, produces data that closely matches the original correlations, PLEKHN1 and HES4 R2 = 0.97; DFFB and OR4F5 R2 = 0.32 (Supplemental Figure 3 G and H).
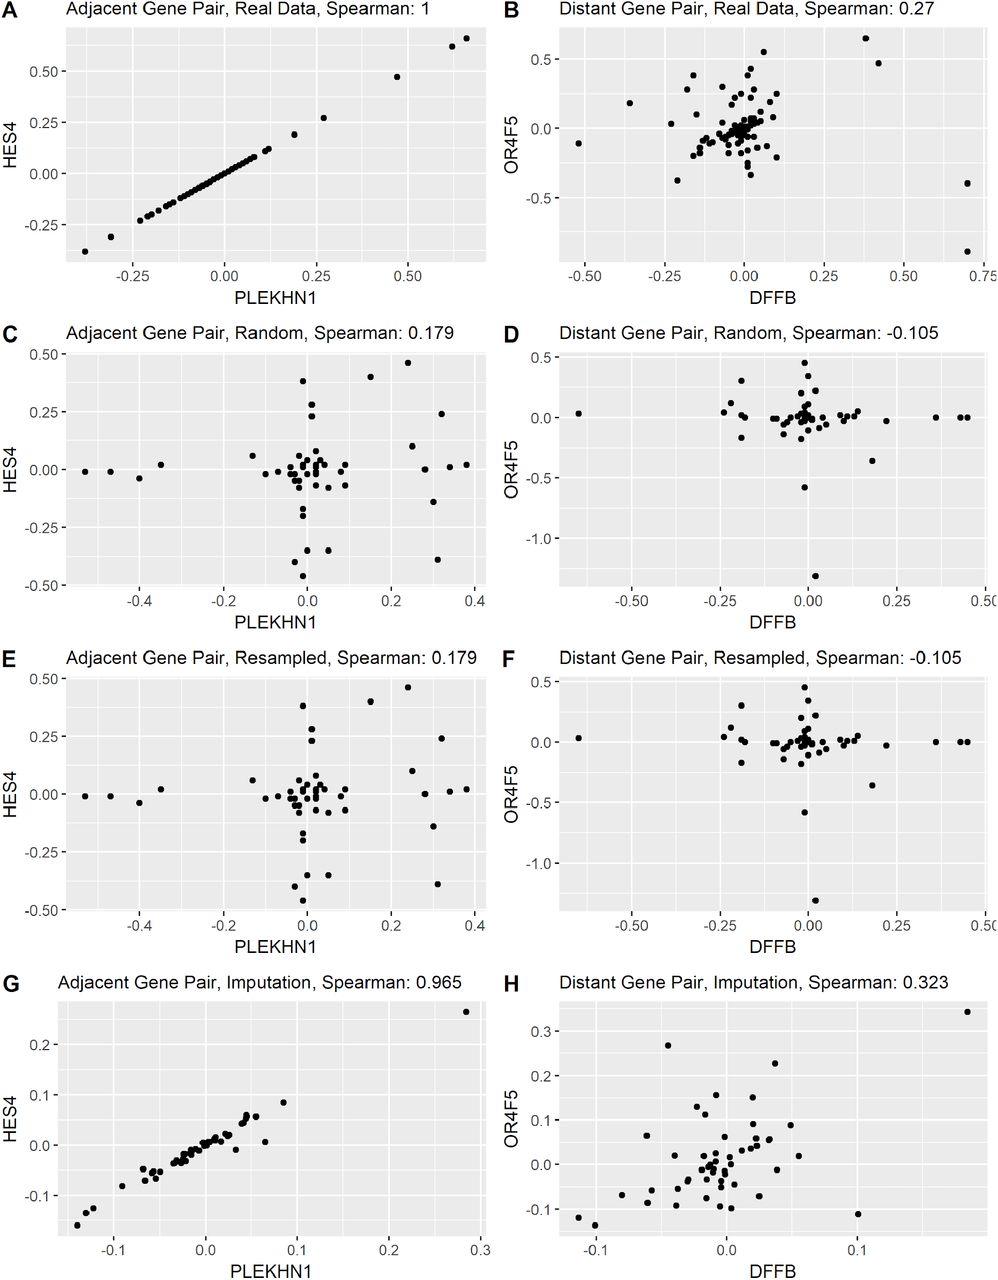
Data relationships in fabricated data. The correlation between pairs of genes is evaluated to determine whether fabrication methods can replicate inter-gene patterns. Plots on the left hand side (A,C,E, and G) display data from two correlated genes PLEKHN1 and HES4, adjacent genes found on 1p36. Plots on the right hand side (B,D,F, and H) display genes DFFB and OR4F5 gene with marginal Spearman correlation in the real data (.27). The plots reveal that random and resample data have little to no correlation between related genes. Imputation produces data with correlation values that are similar to the original data (.97 and .32, respectively).
Machine learning with quantitative data
We tested six different methods for machine learning to create a model capable of detecting fabricated data: Gradient Boosting (GBD), Naïve Bayes, Random Forest, K-Nearest Neighbor (KNN), Multi-layer Perceptron (MLP) and Support Vector Machine (SVM). Models were given as features the quantitative data table containing copy number data on 75 labeled samples, 50 real and 25 fake. In the copy number data, each sample had measurements for ~17,000 genes, meaning that each sample had ~17,000 features. After training, the model was asked to classify held-out testing data containing 75 samples, 50 real and 25 fake. We evaluated the model on simple accuracy, whether the predicted label was correct or incorrect. To ensure that our results represent robust performance, model training and evaluation was performed 50 times with 50 different fabricated datasets (see Methods). Reported results represent the average accuracy of these 50 trials. We note that two methods, SVM and MLP, performed poorly compared to other classification methods. Testing data was comprised of 2/3 real data an 1/3 fake data; therefore, baseline accuracy (the accuracy achieved if the model predicting all test samples as the majority class) is 66%. Both SVM and MLP had an average accuracy at or below this baseline for classification of the simplest fabrication method (random), and were excluded from further analysis.
The remaining four models performed relatively well on the classification task for data fabricated with the random approach. The average accuracy of 50 trials was: Random Forest 94%, GBC 92%, Naïve Bayes 88%, and KNN 72% (Figure 2A). Mean classification accuracies were lower for data created with the resampling method, with most models losing ~10% accuracy (Random Forest 84%, GBC 83%, Naïve Bayes 73%, and KNN 70%). We also note that the variability in model performance was much higher for classification of the resampled data (Figure 2B). As the resampling method uses data values from the real data, it is possible that fake samples sometimes more closely resemble real samples. Imputation classification results fluctuated (Random Forest 90%, GBC 89%, Naïve Bayes 66%, and KNN 56%). While Random Forest and GBC both increased in accuracy compared to the resampled data, Naïve Bayes and KNN both now perform at or below the baseline accuracy (Figure 2C).
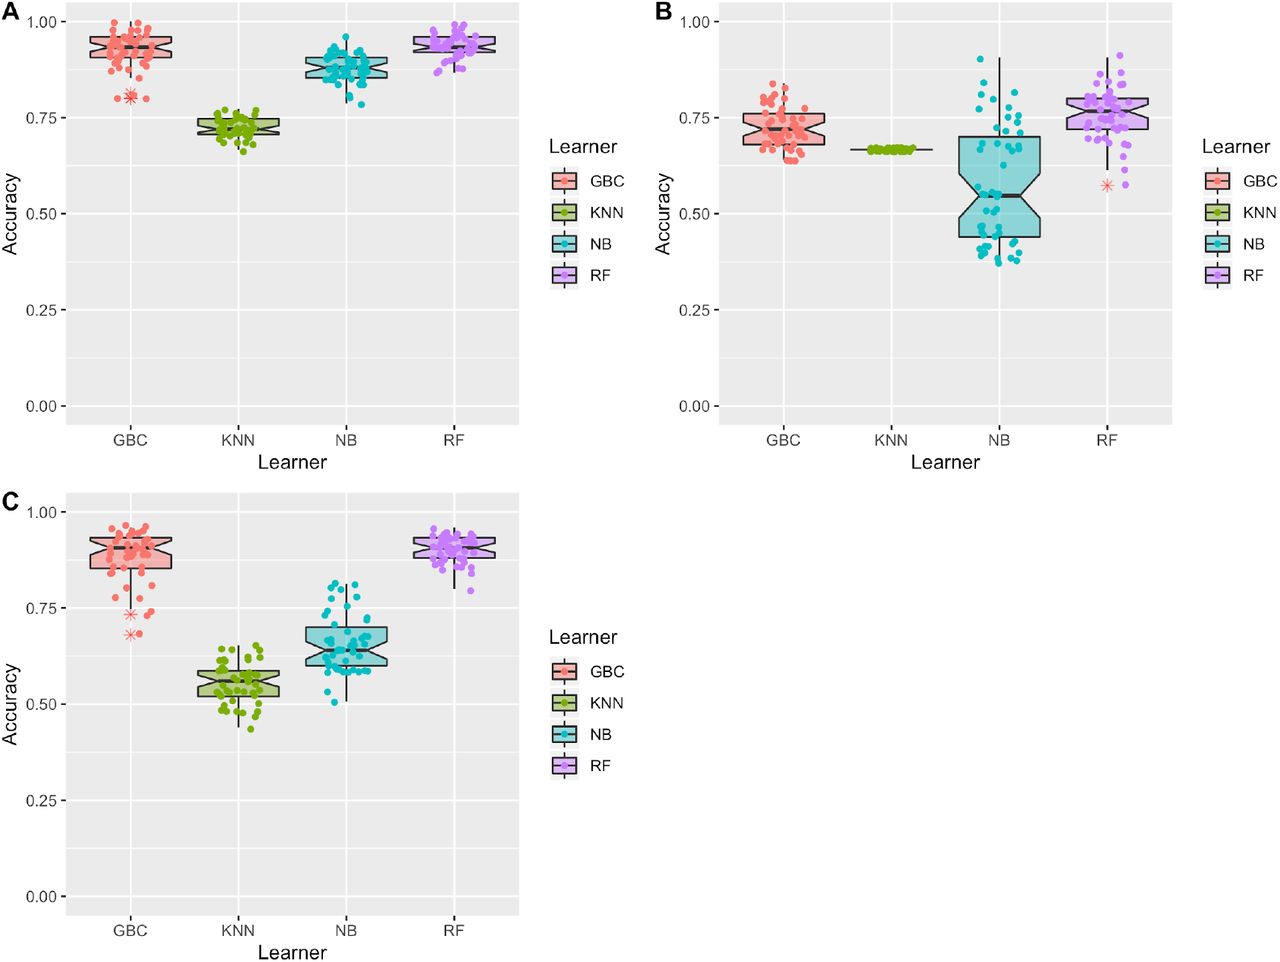
Fabricated data was mixed with real data and given to four machine learning models for classification. Data shown represents 50 trials for 50 different fabricated dataset mixes. Features in this dataset are the copy number values for each sample. A. Results for data fabricated with the random method, mean classification accuracy: Random Forest 94% (+/− 3.1%), GBC 92% (+/− 4.5%), Naïve Bayes 88% (+/− 3.5%), and KNN 72% (+/− 2.6%). B. Results for data fabricated with the resampling method, mean classification accuracy: Random Forest 84% (+/− 6.5%), GBC 83% (+/− 5.2%), Naïve Bayes 73% (+/− 15.2%), and KNN 70% (+/− 0%). C. Results for data fabricated with the imputation method, mean classification accuracy: Random Forest 90% (+/− 3.4%), GBC 89% (+/− 6.4%), Naïve Bayes 66% (+/− 7.4%), and KNN 56% (+/− 5.3%).
Machine learning with digit preference
We were unsatisfied with the classification accuracy of the above models. One challenge for machine learning in our data is that the number of features (~17,000) far exceeds the number of samples (75). We therefore explored ways to reduce or transform the feature set, and also to make the feature set more general and broadly applicable. Intrigued by the success of digit frequency methods in the identification of financial fraud (Badal-Valero et al., 2018), we evaluated whether this type of data representation could work for bioinformatics data as well. Therefore, all copy number data was transformed into 20 features, representing the digits 0-9 in the first and second place after the decimal of each gene expression value. While Benford’s Law describes the frequency of the first digit, genomics and proteomics data are frequently normalized or scaled and so the first digit may not be as characteristic. For this reason, our method may be accurately referred to as Benford’s Law inspired or Benford-like. These features were tabulated for each sample to create a new data representation and fed into the exact same machine learning training and testing routine described above.
In sharp contrast to the models built on the quantitative copy number data, machine learning models which utilized the digit frequencies were highly accurate and showed little variability over the 50 trails (Figure 3). When examining the results of the data fabricated via imputation (both the most sophisticated and most realistic), the models achieved impressively high accuracy. As an average accuracy for the 50 trials, both random forest and the gradient boosting models achieved 100% accuracy. The naïve Bayes model was highly successful with a mean classification accuracy 97%.

Fabricated data was mixed with real data and given to four machine learning models for classification. Data shown represents 50 trials for 50 different fabricated dataset mixes. Features in this dataset are the digit frequencies for each sample. A. Results for data fabricated with the random method, mean classification accuracy: Random Forest 99% (+/− 1.0%), GBC 100% (+/− 0.2%), Naïve Bayes 100% (+/− 0.0%), and KNN 93% (+/− 3.4%). B. Results for data fabricated with the resampling method, mean classification accuracy: Random Forest 98% (+/− 1.3%), GBC 94% (+/− 3.5%), Naïve Bayes 97% (+/− 2.1%), and KNN 92% (+/− 2.8%). C. Results for data fabricated with the imputation method, mean classification accuracy: Random Forest 100% (+/− 1.0%), GBC 100% (+/− 0.7%), Naïve Bayes 97% (+/− 1.1%), and KNN 89% (+/− 3.8%).
Discussion
We present here a proof of concept method for detecting fabrication in bioinformatics data. Just as has been previously shown in the financial sector, digit frequencies are a powerful data representation when used in combination with machine learning to classify whether data is real or falsified. While multiple methods of fabrication were used, we acknowledge there are more subtle or sophisticated methods that could be used. We believe that fraud detection methods, like the models presented herein, could be refined and generalized for broad use in monitoring and oversight.
Regulatory bodies at multiple levels could enforce scientific integrity thought the application of these methods. For example, the government bodies charged with evaluating the efficacy of new medicine could employ such techniques to screen large datasets that are submitted as evidence for the approval of new drugs. Within individual clinical trials, data monitoring committees could add a data consistency check to the statistical monitoring currently utilized. For fundamental research, publishers could mandate the submission of all data to fraud monitoring. Although journals commonly use software tools to detect plagiarism, a generalized computational tool focused on data could make data fraud detection equally simple.
Acknowledgments
This work was supported by the National Cancer Institute (NCI) CPTAC award [U24 CA210972].


