

Abstract
Cells store energy in the form of neutral lipids packaged into micrometer-sized organelles named lipid droplets (LDs). These structures emerge from the endoplasmic reticulum (ER), but their biogenesis remains poorly understood. Using molecular simulations, we found that LD formation proceeds via a liquid-liquid phase separation process that is modulated by the physical properties and lipid composition of the ER membrane. LD formation is promoted at ER sites characterized by high membrane curvature and by the presence of the ER-associated protein seipin, that cause accumulation of triglycerides by slowing down their diffusion in the membrane. Our data indicate how a combination of membrane physical properties and protein scaffolding is used by the cell to regulate a broad and energetically-efficient biophysical process such as liquid/liquid phase separation to achieve LD biogenesis.
Lipid droplets (LD) are ubiquitous intracellular organelles that consist of a core of fat molecules, mostly triglycerides (TGs) and sterol esters (SEs), surrounded by a phospholipid monolayer1. Because of this unique composition, they are the cellular sites responsible for energy and lipid storage and they play a central role in lipid and cellular metabolism1–4. LDs emerge from the endoplasmic reticulum (ER), where the neutral lipids (NLs) constituting them are synthetized by acyltransferases that are essential for LD formation5. These early LDs have been observed with electron microscopy (EM), showing an oblate lens-like structure with diameters of 40-60 nm6. The early steps of LD biogenesis, however, remain largely unexplored and our understanding of how LDs form 3,4,7–12 is based solely on the extrapolation of sparse experimental observations in reconstituted systems. First, micrometer-sized oil blisters have been observed during the formation of black lipid membranes13,14 or after addition of TGs to Giant Unilamellar Vesicles15. Second, molecular dynamics (MD) simulations have suggested that oil lenses can form between the two bilayer leaflets when the ratio between oil and phospholipids exceeds a certain threshold16. These observations have led to a model that posits that LDs form from the spontaneous accumulation of NLs between the two leaflets of the ER into nanometer-sized lipid lenses, before a subsequent maturation that involves LD growth and budding3,4,7–12. The current model, however, appears to be at odds with cellular observations in which NLs fail to cluster into LDs, rather accumulating in the ER17 or in non-native NL-enriched membraneous structures18. These phenotypes, caused by deletion of proteins such as the lipid phosphatase Pah1p17 or the membrane-shaping protein Pex30 together with seipin18, strongly suggest the presence of regulatory mechanisms modulating LD biogenesis rather than spontaneous NL aggregation.
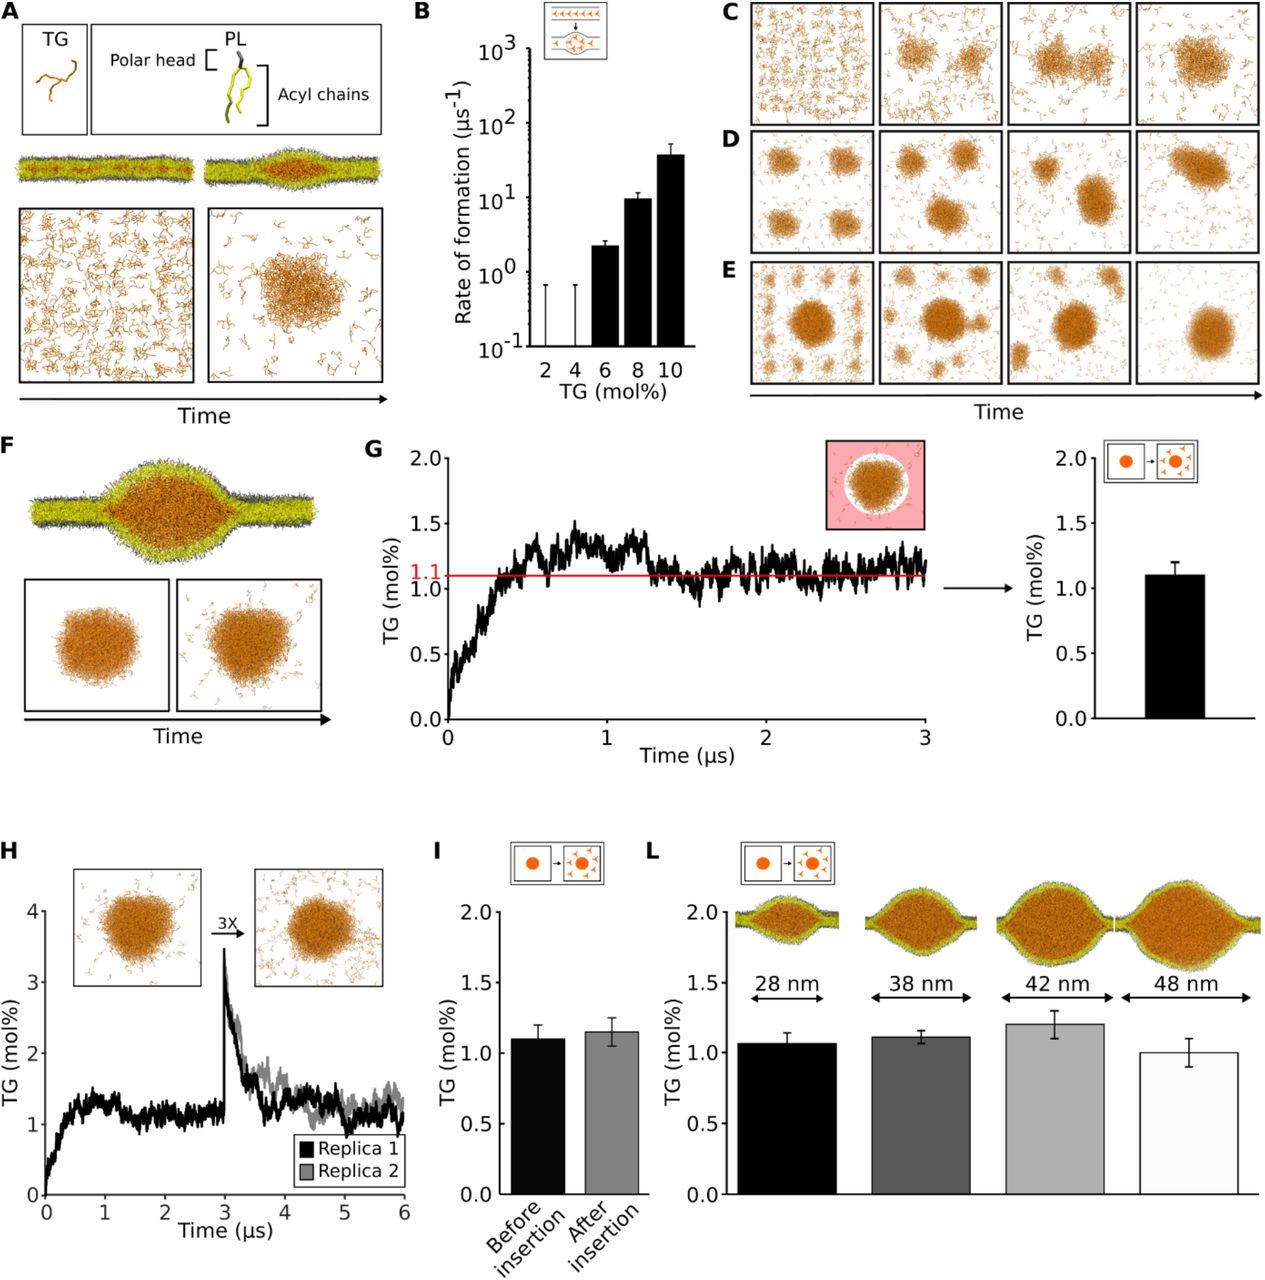
Given the small length scales of the process and the difficulty of controlling the ratio between NL and phospholipids in both cellular and reconstituted approaches, we investigated the mechanism of LD biogenesis using in silico MD simulations. To do so, we built lipid bilayers with increasing concentrations of TG (from 2% to 10%). We initially distributed the TG molecules randomly between the two leaflets of the membrane (Figure 1A) and we let the systems run towards equilibrium. Lens formation took place starting at TG concentrations above 4% following a concentration-dependent nucleation process (Figure 1B). Since both TGs and lipid bilayers can adopt a liquid state at physiological temperature, we hypothesized that LD formation could proceed via a liquid/liquid phase separation (LLPS) process. LLPS is characterized by two main requirements: (i) the two phases must be liquid and (ii) the process must be driven by the equilibrium concentration (e.g. the chemical potential) of the solute (TG, in our case) in the diluted phase19.

(A) Setup of the nucleation system. (B) Rate of formation of oil lenses at different TG%. (C-E) Coalescence of oil lenses in different MD simulations. (F) Setup of diffusion simulations to quantify the amount of diluted TG and (G) quantification over time. The area in which the diluted TG is measured is highlighted in light red. (H) Quantification of the injection of additional TG molecules and measurement of diluted TG over time. (I) Comparison between the values of diluted TG before and after the insertion of excess TG in the bilayer. (L) Quantification of diluted TG in systems of different sizes.
To test the first requirement, we first computed the diffusion of TG molecules in both the diluted phase (the ER membrane) and the condensed phase (the oil blister), and we observed that TG molecules are able to freely diffuse in both phases (Movie S1) with diffusion rates comparable to those of phospholipids (Table S1). Next, we tested whether oil blisters in bilayers can coalesce using three different computational assays: first, we observed that during spontaneous blister formation at high TG concentration (10%), multiple small lenses that initially formed in the simulation coalesced over time to a single one (Figure 1C). Second, we prepared a configuration with 4 identical lenses and observed the formation of a single lens over time (Figure 1D, S1A). Third, we prepared a system with a big lens surrounded by 12 small lenses. Again, we observed their spontaneous coalescence, in this case accompanied by Ostwald ripening. (Figure 1E, S1B, movie S2).
To test the second requirement, i.e. whether the process is driven by the chemical potential of TG in the diluted phase, we first prepared a system that allowed us to estimate the concentration of TG molecules in a lipid bilayer. To do so, we packed all TG molecules in a pre-formed lens inside a lipid bilayer (Figure 1F) and we followed the time evolution of the concentration of TG molecules spreading into the bilayer (Figure 1F,G). After an initial equilibration, the system reached an equilibrium at the concentration of 1.1±0.1 mol% (Figure 1G, S2), in close agreement with experimental values reported using capacitance measurements14 or NMR20.
To test whether the TG concentration in the bilayer is the driving force between the LLPS, we used two different approaches. First, we arbitrarily increased the concentration of the diluted TG in the bilayer by computationally “injecting” new TG molecules in an equilibrated system (Figure 1H). When the system reached equilibrium, all excess TG molecules translocated to the oil lens, with the bilayer TG concentration returning to its initial value after few microseconds (Figure 1H,I). Second, we prepared oil lenses of different sizes compatible with the ones observed using EM6, ranging from 25 to 50 nm in diameter (Figure 1L). We observed that the concentration of equilibrium TG in the bilayer is independent of the blister size. Finally, when TG blisters with a total TG concentration below the computed chemical potential (1.1% TG/PL) were simulated, this led to blister dissolution (Movie S3). Taken together, our results indicate that indeed oil blister formation in lipid bilayers can be considered as a bona fide LLPS.
LLPS is a ubiquitous cellular strategy to achieve membrane-free intracellular compartmentalization19. The underlying molecular mechanisms governing the precise spatial regulation of these processes in cellular systems, however, remain mostly elusive, but the establishment of nucleation sites where the local concentration of the solute is higher than in its surroundings is a common requirement19. We hypothesized that in our specific case, solvent properties (i.e. characteristics of the ER membrane) together with the activity of specific ER-embedded proteins, could control the localization of LD formation by promoting LLPS at specific ER sites.
We first tested whether ER properties could modulate the propensity for blister formation and, concomitantly, the concentration of TG molecules residing in the ER membrane. We first tested whether ER physical properties, such as low membrane tension and widespread membrane curvature, might also modulate this mechanism. We observed that increasing membrane tension antagonizes blister formation, by both decreasing its rate (Figure 2B) and by increasing the amount of diluted TG in bilayers (Figure 2C), in agreement with in vitro experiments15. Membrane curvature, on the other hand, didn’t appear to affect blister formation rate (Figure 2E), nor the chemical potential of TG molecules (Figure 2F).

(A) Cartoon of the TG-enriched bilayer at different tensions. (B) Rate of formation and (C) diluted TG quantification at different surface tensions. (D) Cartoon of flat and curved bilayers containing TG. (E) Rate of formation and (F) diluted TG quantification in curved systems. (G) Chemical representation of various lipid compositions tested and corresponding (H) rates of blister formation and (I) diluted TG quantification.
Next, we investigated the effect of lipids that are either relatively abundant in the ER, such as those carrying unsaturated chains, phosphatidyl-ethanolamine (PE) or those that are precursors of NLs, such as DAG and cholesterol (Figure 2G)21,22. Lipid unsaturation slightly promotes blister formation, as does the presence of PE lipids (Figure 2H). A more pronounced effect towards blister formation was observed in the case of the NL precursors, with even mild concentrations of DAG and cholesterol promoting phase separation at low (<4%) TG concentrations (Figure 2H). Since deletion of Pah1p, the lipid phosphatase converting PA in DAG upstream of TAG synthesis, results in a phenotype where NLs are present in the cell at significant concentration but fail to cluster into LDs and rather accumulate in the ER17, our data suggest that a local increase in the membrane concentration of DAG, the precursor of TG, could promote LD biogenesis at specific ER sites enriched in Pah1p.
Taken together, our results suggest that the ER membrane appears engineered to promote oil blister formation, allowing only very low concentration of diluted TG in the ER (Figure 2I), possibly to reduce TG-induced lipotoxicity. Indeed, a lipid composition mimicking that of the ER showed the lowest concentration of diluted TG and the highest blister formation rates, including at low TG concentration (Figures 2H,I).
The observation that membrane curvature doesn’t promote blister formation appears to be at odds with the recent experimental observation of a prominent role of membrane-shaping proteins in LD formation18,23. We reasoned, however, that if LD biogenesis occurs via a LLPS that is triggered by the TG concentration in the ER, as our simulations suggest (Figure 1B), it would be possible to increase the local TG concentration by slowing down its diffusion in predetermined ER sites.
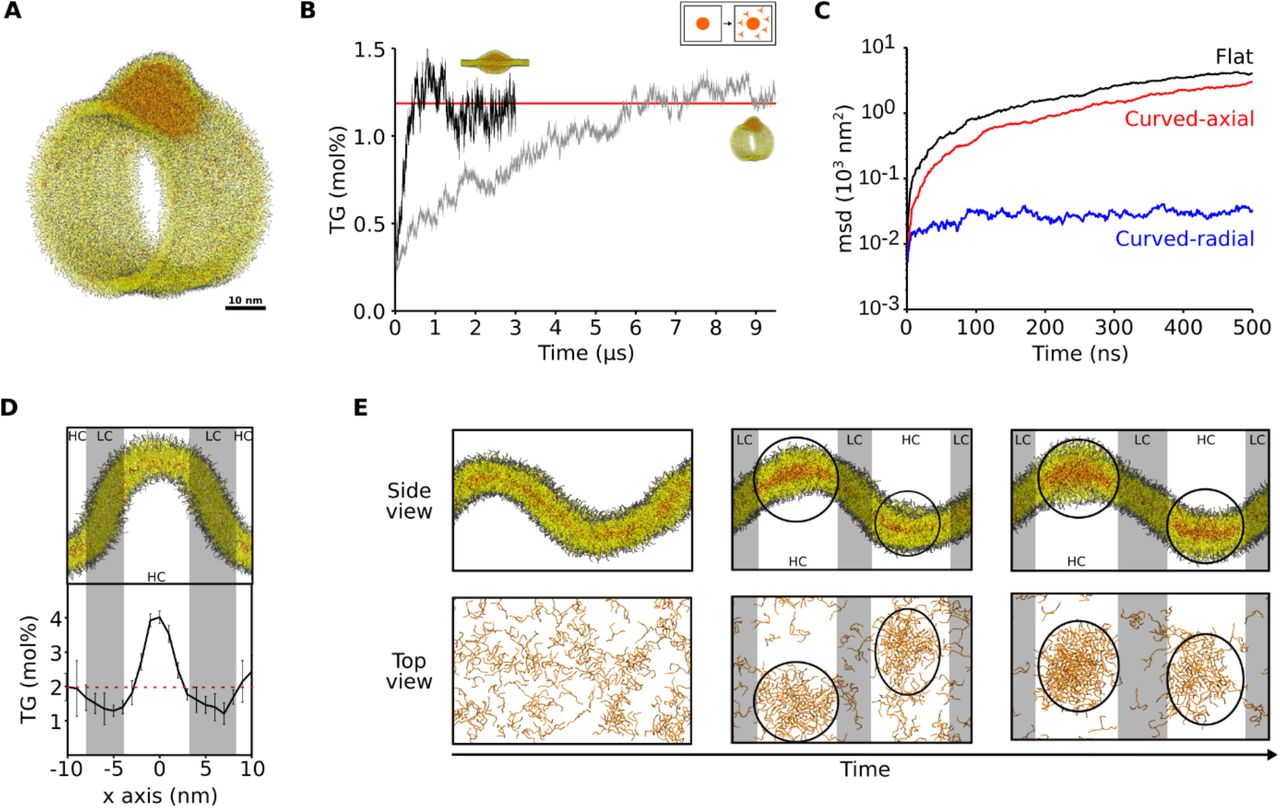
To investigate this possibility, we first ruled out that physicochemical membrane properties such as membrane tension or presence of specific lipids slows down TG diffusion (Table S1). We noticed, however, that in highly curved tubular structures mimicking ER tubules (Figure 3A), equilibration of TG molecules inside the tubule was much slower than in flat bilayers (Figure 3B). We thus computed the diffusion of TG molecules along the radial and axial coordinates of the tubule, and we found that diffusion along the radial axis was significantly slower in comparison with that along the axial coordinate or with that in flat bilayers (Figure 3C), similarly to what has been shown for the diffusion of phospholipids in curved membranes24. To further test this hypothesis, we measured the distribution of TG molecules in lipid bilayers with coexisting flat and curved patches as a function of membrane curvature, at TG levels below the critical concentration for nucleation (Figure 3D). We observed that the concentration of TG molecules is up to 2-fold higher in regions of high curvature when compared to flat regions (Figure 3D). At higher TG concentrations, when spontaneous formation of oil blisters was observed, lens invariantly nucleated at sites of high curvature, remaining there throughout the entire simulation (Figure 3E).

(A) Snapshot from the MD simulation of a membrane tubule with an embedded nascent TG blister. (B) Equilibration of the diluted TG concentration over time in tubular and flat systems. (C) Mean square displacement of TG molecules at low concentration (2 mol%) in different systems: flat bilayer (black), along the axial coordinate of the membrane tubule (red) and along the radial coordinate of the membrane tubule (blue). (D) Quantification of TG concentration as a function of membrane curvature. Regions of high curvature (HC) are highlighted in white, while regions of low curvature (LC) are highlighted in gray. (E) Snapshots of blister formation in curved system. Oil blisters are highlighted with black circles.
The membrane-shaping protein Pex30 has been shown to promote LD biogenesis in cooperation with the ER-resident protein seipin18,23. We thus reasoned that the seipin oligomer (Figure 4A) could also cooperate with membrane curvature to slow down the diffusion of TGs in its proximity due to lipid-protein interactions. Of note, seipin has been recently shown to mark the sites of LD formation25, and stand-alone deletion of seipin has been shown to lead to NL accumulation in the ER and delayed LD formation26. To test this hypothesis we first prepared a model of the transmembrane region of seipin based on the recently determined cryo-EM structures of the soluble part of seipin 27,28 and we embedded this model in a large membrane patch with 2% TG (Figure 4A,B). We next measured the concentration of TG molecules as a function of the distance from the protein complex, and we found that interactions between the TG molecules and the seipin complex raise the local concentration of TG in the proximity of the protein to 4%, twice the initial value in the bulk membrane (Figure 4C,D) in our MD simulations. This increase in local concentration is due to a decrease in TG diffusion in proximity of the protein (Figure E,F), analogously to what has been shown for diffusion of lipids around proteins29.

(A) Top and side view of the seipin structure from EM (light blue) and of the TM helices modeled for the simulations (blue). (B) Setup of the MD simulations with seipin and TG. (C) Quantification of TG% as a function of the distance from the center of the seipin ring. (D) MD screenshot showing TG molecules trapped between seipin TMs. (E) Starting position (black) and single trajectories of 4 representative TG molecules: two that are far from seipin (red and blue lines), one that is trapped into the seipin circular structure (green) and one that is trapped closed to seipin (orange). (F) Mean square diffusion of the 4 molecules along time.
Our observations suggest that the mechanism of LD biogenesis is a LLPS process arising from the accumulation of NLs between the two leaflets of the ER. This model is consistent with multiple cellular observations showing a diffuse localization of NLs inside the ER17,18,26, and with the role of Pex30 and seipin in marking the sites of LD biogenesis18,25. This process provides a highly-efficient framework, since all newly-synthetized excess NLs in the ER will translocate to LDs without the need of ad-hoc protein machineries and energy consumption other than their biosynthesis, while retaining high spatial selectivity. Our investigations provide a conceptual framework for the investigation of the spatial localization of LLPS inside the cell.
Methods
Molecular dynamics (MD) simulations
The MD simulations containing only lipids were performed using the software LAMMPS30 and employing the Shinoda-Devane-Klein (SDK) force field 31–34. Combination rules, as described in 35, were used to derive non-bonded interactions of DAG with DOPE and cholesterol. Initial configurations and input files were obtained through conversion of atomistic snapshots using the CG-it software (https://github.com/CG-it/).
For the systems containing the protein Seipin, GROMACS software36 was used to perform MD in combination with the MARTINI2 force field 37. TG was mapped according to 16.
In the simulations run with LAMMPS, pressure and temperature were controlled via a Nosé-Hoover thermostat38 and barostat39–41: target temperature was 310K and average pressure was 1 atm. The lateral xy dimensions were coupled, while the z dimension was allowed to fluctuate independently. Temperature was dumped every 0.4 ps, while pressure every 1 ps. Linear and angular momenta were removed every 100 timesteps. In systems with non-zero surface tension, the xy dimensions were kept fixed with no pressure-coupling. Van der Waals and electrostatic interaction were truncated at 1.5 nm. Long-range electrostatics beyond this cutoff were computed using the particle-particle-particle-mesh (PPPM) solver, with an RMS force error of 10−⁵ kcal mol−1 Å−1 and order 3. In all CG-SDK systems, a time step of 20 fs was used, except for bilayers containing cholesterol, where a time step of 10 fs was used.
For the simulations containing Seipin, pressure was controlled through a Parrinello-Rahman barostat38,39 and temperature through a thermostat that uses velocity rescaling with a stochastic term42. Target pressure and temperature were set at 1 bar and 310K. Pressure was coupled every 12 ps, with a compressibility constant of 3×10⁻⁴ bar−1 and temperature was coupled every 1 ps. Van der Waals and electrostatic interactions cutoffs were fixed at 1.1 nm. A time step of 20 fs was used.
MD systems setups
In order to study the formation of TG lenses (Figure 1A-B), bilayers containing different concentrations of TG were studied. To build the system, a box consisting of 50 phospholipids (PLs) molecules and a variable number of TG molecules corresponding to the different TG concentrations was initially prepared. The two PL monolayers were displaced along the z-axis in order to allow the insertion of the TG molecules without any steric contact between the molecules. The TG molecules were subsequently randomly placed between the two monolayers. The box was then replicated 8 times along the x and y axis for a total of 3200 PL molecules in each system. Different bilayer compositions were tested, as reported in Table 1. Simulations were run until spontaneous lens formation (see MD simulations analysis for details) or for a total of 1.5 us per run if no spontaneous lens formation was observed (Table 1).
List of all the MD setups, with bilayer composition, number of TG molecules, number of replicas and length of simulations.
For the study of coalescence processes, two additional systems were built. For the first one (Figure 1D), we replicated 4 times the coordinates from the last snapshot of the simulation with DOPC and 10% TG (radius 7 nm, last panel Figure 1C). For the second, we used the coordinates from the last step of the simulation to calculate “free TG” (see below) and the ones from the last snapshot of the simulation of TG lenses formation with DOPC and 6% TG, in order to have a big lens (14 nm radius) in the center surrounded by 12 small lenses with a radius of 5 nm (Figure 1E).
To simulate systems with tension > 0 mN/m (Figure 2A-B), systems containing 3200 DOPC and 192 TG molecules were minimized and equilibrated for 1 ns, then, for 250 ps, the box was increased gradually in x and y dimensions using different scaling factors to obtain different values of tension. Then, the obtained systems were run keeping x and y dimensions fixed. The same protocol was applied to bigger systems in order to study the effect of tension on the concentration of “free TG” (see below, Figure 2C).
The curved systems (Figure 2E, 3D and 3E) were created by building bilayers of 1600 DOPC molecules containing different concentration of TG uniformly distributed. After equilibration, a force along the x direction was applied and then x and y dimensions were kept fixed during the production, as described in 43. The curvature radii were computed using MATLAB scripts.
To calculate the concentration of diluted TG in the bilayer (Figure 1F-G, 1I and Figure 2I), systems were formed by positioning a lens of 1836 TG molecules between two monolayers with 3025 DOPC lipids each, as in 15. We also created bigger systems with 12250 lipids and 1836, 5508 or 9180 TG molecules or 16200 DOPC and 13665 TG, in order to study the size independence of the concentration of diluted TG in the bilayer at equilibrium. The bilayer compositions described in Table 1 were tested.
The tubular bilayer was obtained from a DOPC vesicle built using Packmol software44: a central circular crown of 5 nm length was isolated and replicated 10 times. The crowns were then placed 1 nm apart and the system was run without restraints leading to spontaneous self-assembly of the tubular structure. The obtained tubule was equilibrated and small holes were used to equilibrate the number of lipids in the inner/outer monolayers. The holes were created by applying a cylindric indenter of radius 3 nm to the beads corresponding to the polar head of PLs. Then, the monolayers of a small portion of the tubule were separated in order to allow the insertion of a lens of 1794 TG molecules. The system was further equilibrated until complete reconstruction of the tubular structure and then the simulation was run for additional 9.5 μs. We kept the holes open to allow equilibration of the lipids between the two monolayers.
To study the effect of inserting new TG molecules in the bilayer (Figure 1H) we built systems from the coordinate file of the last frame of one of the two simulations used to computed the amount of diluted TG (Figure 1F,G). The two bilayers were slightly separated from TG in the z direction using TCL scripts and only the molecules considered as outside the lens (see section MD simulations analysis) were replicated 3 times using the tool for VMD TopoTools Plugin [Axel Kohlmeyer, (2017)].
The system with the protein seipin (UniProt reference number: Q96G97) was built using the program Packmol. The all atom representation of the transmembrane helices of Seipin were built with the plugin Molefacture present in VMD and then coarse grained using CHARMM-gui tools45. An elastic network, defined using MARTINI2 standard parameters for force constant and cutoffs, was used to keep the secondary structure of the helices. The position of the transmembrane helices was obtained from the coordinates of the terminal residues of the cryoEM structure of human Seipin, present in the PDB data bank with the code 6D5S27. After a short 10 ps equilibration without restraints and subsequent 4 ns equilibration with positional restraint along all the directions (Fc=1000 kj/mol nm2), positional restraints of Fc=1000 kj/mol nm2 along x and y directions were applied to the helices in order to maintain a circular conformation consistent with the cryoEM structure. Seipin was positioned in a DOPC bilayer containing 2% TG.
MD simulations analysis
The formation of a triglyceride lens was determined according to the following algorithm: an aggregate of at least 25 TG molecules within 3.5 nm of a TG molecule, that was stable for at least 5 ns. The simulations were run until formation of a TG lens or for 1.5 μs if no aggregation occurred. For each TG concentration, bilayer composition and setup, 3 independent simulations were performed. Rate of formation is calculated as the inverse of the time of formation, obtained from the average over the three replicas. Error bars are computed from error propagation from standard deviation of time of formation from the three independent simulations. For simulations where no formation was observed, error bars are given as the inverse of the total simulation time (1.5 μs).
The analysis of the concentration of diluted TG was performed using the following algorithm: first, we defined as part of the lens all the TG molecules that are within 5 nm of another TG molecule and not within 2.8 nm of the PLs. The “free bilayer” was defined as all lipid molecules that are at least 2.5 nm far away from the lens. We tested different selections and the chosen one allowed us to consider the widest area of free bilayer, excluding the side of the lens where TG molecules move continuously inside and outside the lens (Figure S2). Except for the tubular structure, the simulations were run for 3 μs (see Table 1). The percentage of TG molecules inside the bilayer was obtained averaging the values of the last 1.5 μs of simulation, while the error bars are obtained from the standard deviation over two independent simulations. The dimensions of TG lenses were calculated using the minimum and the maximum x, y and z coordinates of the TG molecules at each side of the lens, averaged over time.
The concentration of TG in the curved systems (figure 3D) was obtained by dividing the box in slices of 1 nm along the x axis and by counting the number of TG and DOPC molecules in each region. The percentage of TG was obtained averaging the values of 300 ns of simulation for three different replicas, while the error bars are obtained from the standard deviation over the three independent simulations.
In the systems containing Seipin, TG mol% vs distance from the center of the seipin ring was calculated dividing the bilayer in annuli delimited by concentric circles of radius=R+1 nm and counting the number of TG and DOPC molecules in each region. The percentage of TG was obtained averaging the values of 1.5 μs of simulation for three different replicas, while the error bars are obtained from the standard deviation over the three independent simulations. Trajectories of single molecules and mean squared displacement for 4 selected TG molecules were calculated using the tool Trackpy (https://soft-matter.github.io/trackpy/v0.3.2/).
Mean squared displacement (MSD) of TG and DOPC molecules were obtained using the LAMMPS command “compute msd” during production. For the tubular system, axial and radial MSD were calculated using the following equation:

Being the axis of our cylinder oriented toward y, for the axial diffusion coefficient, xt is the coordinate y of the particles at time t and x0 is the coordinate y at the reference point t=0. For the radial diffusion, xt is the radial coordinate ρ (ρ2 = x2 +z2) at time t and x0 is the radial coordinate ρ at t=0. Then, diffusion coefficients were calculated using the script msd2diff.py available in the ELBA-LAMMPS toolkit (https://github.com/orsim/elba-lammps/tree/master/tools).
For all simulations, surface tension was computed from the diagonal values of the pressure tensor (Pxx, Pyy, and Pzz) using the Kirkwood-Irving method:
 where L is the box length in the z dimension and <> means an ensemble average. All molecular images were rendered using VMD software46 and the graph produced with the software MATLAB.
Acknowledgments
We thank Vikram Reddy and Vineet Choudhary for useful discussions. This work was supported by the Swiss National Science Foundation (grant #163966). This work was supported by grants from the Swiss National Supercomputing Centre (CSCS) under project ID s726 and s842. We acknowledge PRACE for awarding us access to Piz Daint, ETH Zurich/CSCS, Switzerland.
References


