

Abstract
Ocean microbes are responsible for about 50% of primary production on Earth, and are strongly affected by environmental resource availability. However, selective forces resulting from environmental conditions are not well understood. We studied selection by examining single-nucleotide variants in the marine environment, and discovered strong purifying selective forces exerted across marine microbial genes. We present evidence indicating that this selection is driven by the environment, and especially by nitrogen availability. We further corroborate that nutrient availability drives this ‘resource-driven’ selection by showing stronger selection on highly expressed and extracellular genes, that are more resource-consuming. Finally, we show that the standard genetic code, along with amino acid abundances, facilitates nutrient conservation by providing robustness to mutations that increase nitrogen and carbon consumption. Notably, this robustness generalizes to multiple taxa across all domains of life, including the Human genome, and manifests in the code structure itself. Overall, we uncover overwhelmingly strong purifying selective pressure across marine microbial life that may have contributed to the structure of our genetic code.
Introduction
Ocean microbes, the largest group of organisms on the planet1, are involved in key cycling of nutrients that make up all living systems. They account for nearly half of the carbon compound synthesis on Earth, thereby producing about 50% of breathable oxygen2. These marine microbes also cycle nutrients to perform numerous other important roles, such as biodegradation of complex organic material and fixation of atmospheric nitrogen, while flourishing in a wide range of environments with varying ambient conditions such as oxygen and nitrogen levels, light and temperature3,4. Nonetheless, and despite their importance in global energy flux and nutrient cycling, evolutionary forces acting on ocean microbes are not fully understood4.
With rapidly changing climate and environment, understanding the types of stress exerted on microbes in marine habitats is of paramount importance. Recent studies4,5 provide evidence of high variability in the core genomic properties of marine microbes, including GC content and genome size, suggesting that this variability is linked to the concentrations of nutrients in the environment. Nitrogen and carbon are major limiting factors in the marine environment and their concentrations are typically inversely correlated6. It was shown that in low-nitrogen environments there is lower incorporation of nitrogen-rich side chains into proteins, a strong A+T bias in nucleotide sequences, and smaller genome sizes, suggesting that nitrogen conservation is a strong selective force7. An opposite trend was shown for carbon4. Previous studies7,8 identified a purifying selective pressure associated with resource conservation, which we term ‘resource-driven’ selection. Such ‘resource-driven’ selection against incorporation of nutrients in a resource-limited environment may be further propagated by the high effective population sizes observed in the open ocean, where even slightly deleterious mutations are rapidly selected against9. Notwithstanding, the ways in which resource-driven selection manifests in protein-coding sequences are not fully elucidated.
To illuminate mechanisms through which resource-driven selection affects protein-coding genes, we amalgamated measurements of environmental conditions with publicly available marine metagenomic data from oceanic habitats across the globe (Fig. 1A)3,10. We analyzed purifying selection in 746 such marine samples by devising a tailored computational pipeline examining single nucleotide polymorphisms. This enabled us to systematically associate purifying selection with related environmental measurements. We revealed a strong purifying selective pressure, which seems to be acting in a similar fashion across most marine microbial genes. This purifying selection is associated with environmental nutrient concentrations, specifically nitrate. We further show that resource-consuming genes, which are highly expressed or code for extracellular proteins, are under stronger resource-driven selection as compared to other, less resource-consuming genes. We analyze mutations in nitrate-rich as compared to nitrate-poor waters and show that this selection is likely characterized by specific amino acid preferences depending on environmental conditions. Finally, we demonstrate that the distribution of amino acids, along with the structure of the genetic code, provides robustness against random mutations that increase carbon and nitrogen incorporation into protein sequences. We extend this observation to codon distributions across many diverse life forms, and suggest that nutrient conservation is encoded in the standard genetic code, which is robust to mutations that result in higher nitrogen and carbon utilization.

(A) Geographical overview of the samples used in this study. (B) Illustration of our computational pipeline. (C,D) Histogram of pN/pS rates for eggNOG orthologous groups (OG; C) and KEGG orthologs (KO; D) across all marine samples.
Results
Single nucleotide polymorphisms in marine microbial genes reveal strong purifying selection
To better understand the underlying mechanisms governing resource-driven selection acting on marine microbes, we sought to characterize, at the single nucleotide level, how coding sequences of marine microbes are affected by resource availability in their environment. To this end, we devised a computational pipeline that calculates metrics of selection from marine metagenomic samples (Fig. 1B). We downloaded metagenomic sequencing data from 746 samples from the Tara oceans3 (n=136); bioGEOTRACES10 (n=480); Hawaii Ocean Time-series10 (HOT; n=68); and Bermuda Atlantic TimeSeries10 (BATS; n=62) expeditions (Fig. 1A; Methods). We aligned these reads to the Ocean Microbiome Reference Gene Catalog (OM-RGC)3 and searched for single nucleotide polymorphisms (SNPs) in genes that had sufficient high-quality coverage (Fig. 1B; Methods). Overall, we found 71,921,864 high-confidence SNPs in 1,590,843 genes.
Next, to quantify purifying selection on different gene functions, we annotated genes from the OM-RGC database to inform their functional group membership with either KEGG orthology (KO) or eggNOG orthologous group (OG; Methods). We then calculated, using called SNPs per orthologous group in each of the samples, the ratio of non-synonymous to synonymous polymorphisms11,12 (pN/pS; Methods). We used pN/pS rated to approximate purifying selection at the population level as dN/dS ratios, which are typically used to characterize these stresses12, were not applicable in this setting (Methods). pN/pS quantifies the rate of nonsynonymous polymorphisms (pN), which lead to a change in the resulting amino acid, normalized to the rate of synonymous polymorphisms (pS), which maintain the coded amino acid.
As pN/pS is a proxy for the magnitude of purifying selection exerted on protein-coding sequences, we sought to utilize it to evaluate the selective forces acting on marine microbial functions. The rate of non-synonymous to synonymous polymorphisms was on average, across samples, 0.074 (CI [0.072, 0.075]) across all OGs and 0.079 (CI [0.077, 0.080]) across all KOs, similar to previously reported pN/pS ratios across different microbial genomes in the human microbiome11 (Fig. 1C,D). With values close to zero indicating very strong selection against amino acid changes, these findings imply that purifying selection is on the same scale in free-living marine organisms as compared to host-associated microbes in the human gut. While gut microbes are expected to be under strong purifying selection in order to keep functioning in the host-associated niche13, the source of this strong purifying selection on ocean microbes is not well understood.
Strong resource-driven selection apparent across marine microbial genes
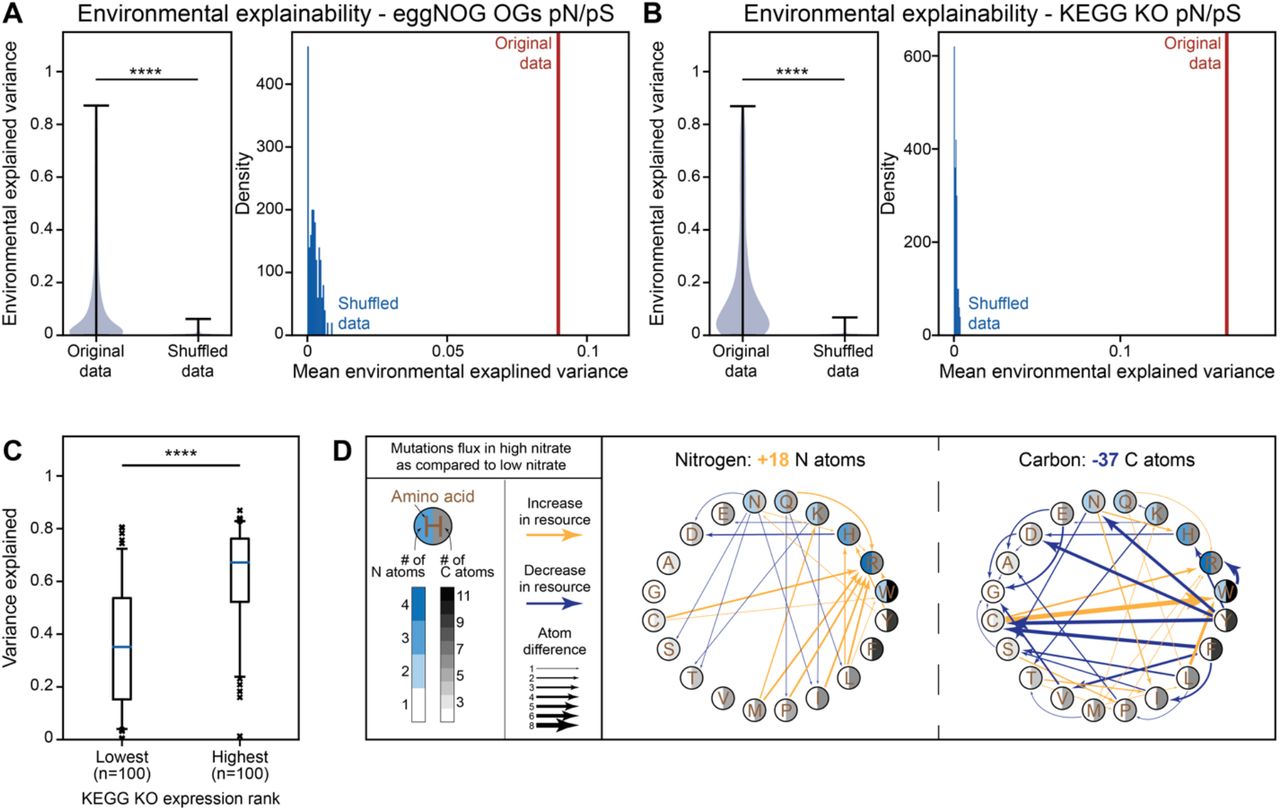
To quantify the effects of environmental conditions on selective forces acting on marine microbial genes, we extracted measurements regarding the environment in which each sample was taken. This included the depth of the sample, water temperature and salinity, as well as concentration of the key molecules nitrate, nitrite, oxygen, phosphate and silicate (Fig. S1A-H; Methods). All these measurements of environmental conditions are highly correlated with each other (Fig. S1I), and also presented consistent correlation patterns with pN/pS of many KEGG and eggNOG orthologs (Fig. S2), with low pN/pS at shallow depths and low nitrate concentrations. We therefore sought to estimate the overall variance explained by the environment while accounting for these covariations. To this end, we used a linear mixed model (LMM) with variance components, commonly used in population genetics 14 (Methods). We defined the environmental covariates as random effects in order to quantify the fraction of variance in pN/pS that is explained by resource availability (i.e., environmental explained variance; EEV; Methods). Across both KEGG and eggNOG orthologs we found that a substantial fraction of the variance in pN/pS can be attributed to the environment, where across all orthologs this effect is significantly bigger than zero (Fig. 2A,B; Mann-Whitney U test P < 10−16).

(A-H) Distribution of measurements taken alongside marine microbial samples for depth (A), nitrate (B), nitrate and nitrite (C), oxygen (D), phosphate (E), salinity (F), silicate (G) and temperature (H). (I) Spearman correlation coefficients between all pairs of environmental measurements across all available samples.
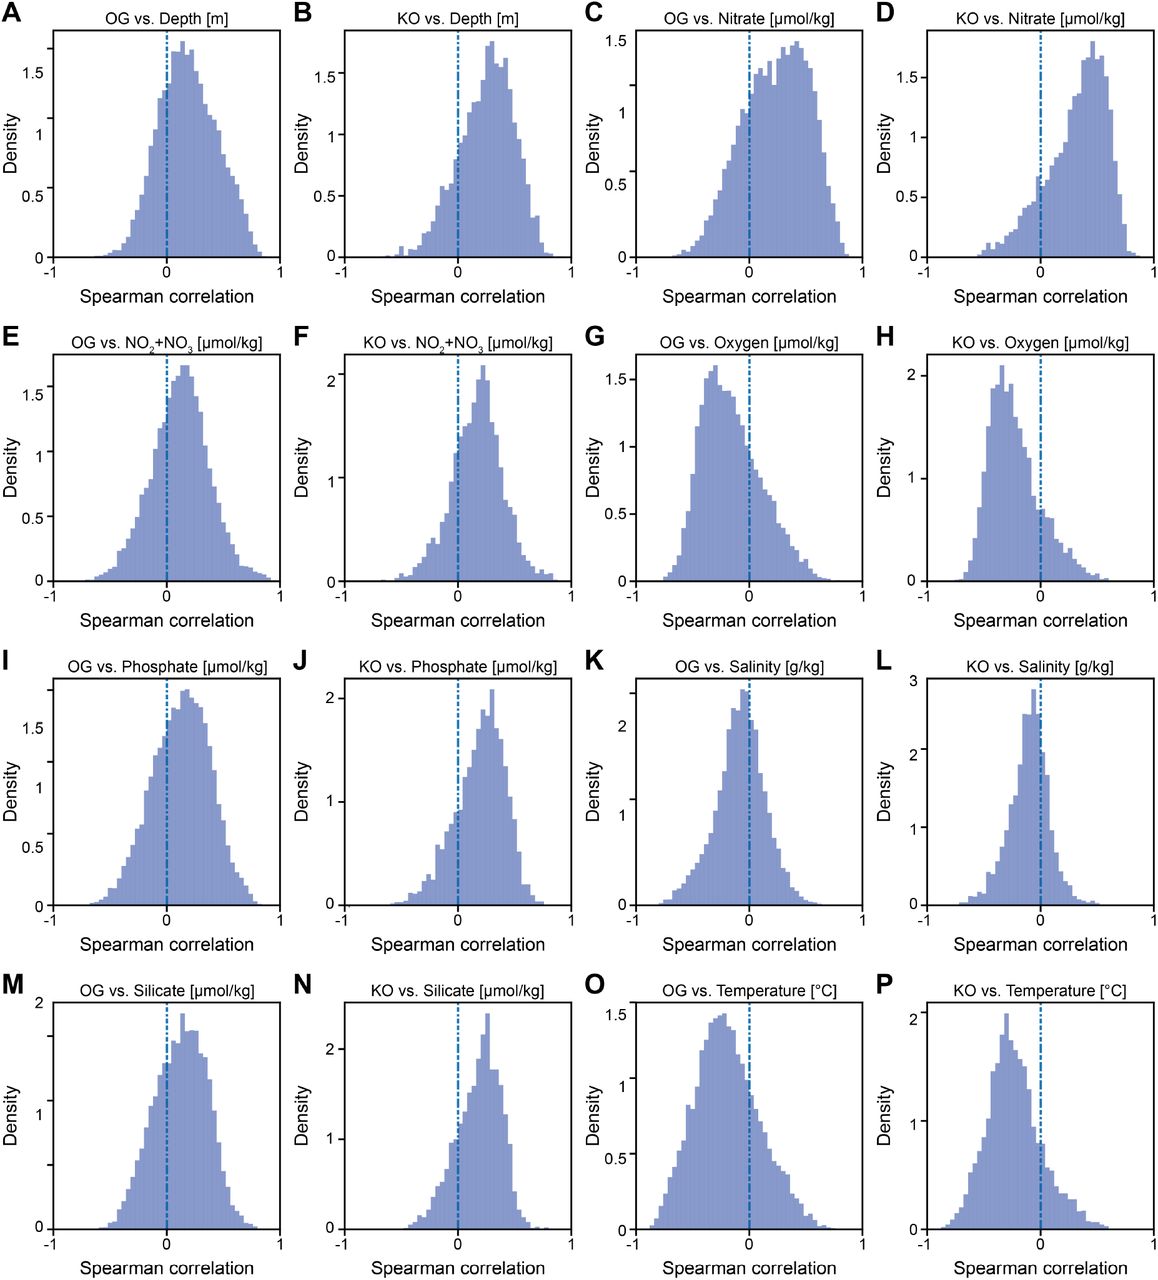
(A-P) Histograms of Spearman correlations between πwithin (red) or pN/pS rates (blue) and environmental variables, for both KEGG KOs and eggNOG OGs. Panels A, C, E, G, I, K, M and O depict correlations between OG calculated parameters and depth, nitrate, nitrite and nitrite, oxygen, phosphate, salinity, silicate and temperature, respectively. Panels B, D, F, H, J, l, N and P depict correlations between KO calculated parameters and depth, nitrate, nitrite and nitrite, oxygen, phosphate, salinity, silicate and temperature, respectively.
Different environmental niches may harbor different taxa with different trophic interactions that could lead to differences in selective pressures. Thus, we sought to ensure that these associations between pN/pS and the environment are not confounded by organismal differences across different depths and nitrate concentrations. To this end, we analyzed genes belonging exclusively to the genus Synechococcus (Methods). We calculated pN/pS across all of the coding sequences combined and found a significant positive correlation with nitrate concentrations (P<10−20; Fig. S3A). To further validate that this correlation does not stem from the different effective population sizes in the gradient of environmental nitrogen, we divided the samples into five identically sized groups, based on environmental nitrate concentrations while constraining the scope of each group to genes present in at least half of the samples. We show that an association of pN/pS with nitrate extends to specific niches across the nitrocline, i.e., in concentrations higher than 1 μmol/kg (P<0.05; Fig. S3B). These results demonstrate the existence of pN/pS gradient as a function of nitrate concentrations, even in a single taxonomic group in a specific environmental niche. This indicates that correlations of pN/pS with environmental variables are not driven exclusively be organismal properties or by differences in trophic conditions across environments, but rather exhibit a significant trend even within a single taxon, in specific niches.

(A,B) Scatter plot of the association of pN/pS genes from genus Synechococcus with environmental concentrations of nitrate (A) for all synechococcus genes and (B) for genes present in over 50% in nitrate strata.
Genes are not stand-alone entities, but are rather coded as a sequence in the genome of a microbe. We therefore accounted for a potential non-random association structure between pN/pS rates of different orthologs. To this end, we used a different setting of the LMM, now including both the environmental covariates and pN/pS rates of all other orthologs. Even after accounting for potential non-random association structure between pN/pS rates of different orthologs due to clonal reproduction, the environmental effect was still significantly bigger than zero (P<0.05). In particular, there is an overlap of over 40% in orthologs that are top ranked in terms of EEV between these two model settings. Overall, we observed a very strong association between environmental measurements and the magnitude of purifying selection exerted on most orthologous gene groups. We also observed an association with environmental parameters across many functional categories, including ‘housekeeping’ genes that are important for survival in any given niche, and wished to further elucidate potential mechanisms that can explain it.
Environment-associated selection is stronger in resource-consuming genes
Previous studies4,7 suggested that random mutations that lead to incorporation of additional nutrients to the protein sequences of microbes result in a selective disadvantage. This implies that genes whose protein sequences consume more resources would be under stronger selection. Specifically, highly expressed genes would consume more resources and will therefore be under stronger purifying selection7,8,15. In these genes, a mutation leading to incorporation of additional resources would be magnified, as one highly transcribed DNA sequence could translate to thousands of proteins, each consuming more resources. To quantitatively corroborate this hypothesis and examine whether these underlying forces are reflected in the above associations with pN/pS rates, we used an additional expression dataset for marine microbial genes 16 to rank KEGG orthologs by their mean expression (Methods). We found that the most highly expressed genes had a significantly higher fraction of the variance in their pN/pS explained by the environment, as compared to the least expressed ones (Fig. 2C; Mann-Whitney U test P<10−9). We found a significant difference between the gradient of pN/pS rates, as a function of depth (highly correlated with nitrate, nitrite and oxygen; Fig S1I), in highly expressed genes, as compared to least expressed ones (Fig. S4A; Mann-Whitney U test P<10−5), where the former increased more sharply with depth. A few notable examples for genes with high expression and environmental explained variance, as compared to other KEGG KOs, are the β subunit of RNA polymerase (K03043; EEV = 0.82, 0.33 in the first and second LMM settings, respectively; ranked first in both model settings), the β’ subunit (K03046; EEV = 0.8, 0.28; ranked in the top five in both settings) and a peptide/nickel transporter involved in quorum sensing (K02035; EEV = 0.81, 0.33; ranked second in both settings).

(A, B) Box plots (line, median; box, IQR; whiskers, 5th and 95th percentiles) of (A) Spearman correlation coefficients between depth and pN/pS in highly expressed (left) and lowly expressed (right) KEGG KOs. (B) Spearman correlation coefficients between depth and pN/pS in highly expressed (left) and lowly expressed (right) KEGG KOs. Variance explained by the environment in extracellular gene groups versus all eggNOG OGs (Methods). *, P<0.05; ***, P<10−5.

(A) Left, violin plot of the variance of eggNOG OG pN/pS rates that was explained by the environment as compared to the same data with shuffled labels; Right, mean variance explained in unshuffled data (red) as compared to a histogram (blue) of mean variance explained in 100 executions with shuffled data. (B) Same as A, for KEGG KO pN/pS. (C) Box plots (line, median; box, IQR; whiskers, 5th and 95th percentiles) of variance in pN/pS explained by the environment in the 100 lowest and highest expressed KEGG KOs. (D) Depiction of mutation flux (Methods) common in high versus low environmental nitrate concentrations, affecting amino acid nitrogen (left) and carbon (right) content. Yellow arrows, increase in resource; blue arrows, decrease in resource; arrow thickness corresponds to number of atoms changed by mutation. ****, Mann-Whitney U p<10−9.
We additionally hypothesized that genes coding for extracellular proteins will have a similar pattern as in this case, the resources excreted from the cell cannot be recycled. We found the same pattern of significantly higher EEV in extracellular protein-coding genes as compared to other gene groups (Methods; Fig. S4B; P<0.05). Overall, our results indicate that these genes exhibit higher ‘resource sensitivity’, manifested by higher variance explained by the environment, potentially due to their high expression levels. This finding provides a data-driven evolutionary perspective to theory and experiments showing lower resource incorporation in highly expressed genes7,8. In summary, the variation in resource-consuming genes, (i.e., highly expressed and extracellular protein-coding), further strengthens our results regarding the breadth of resource-driven selection.
Resource-driven selection exerts a strong effect on protein-coding sequences
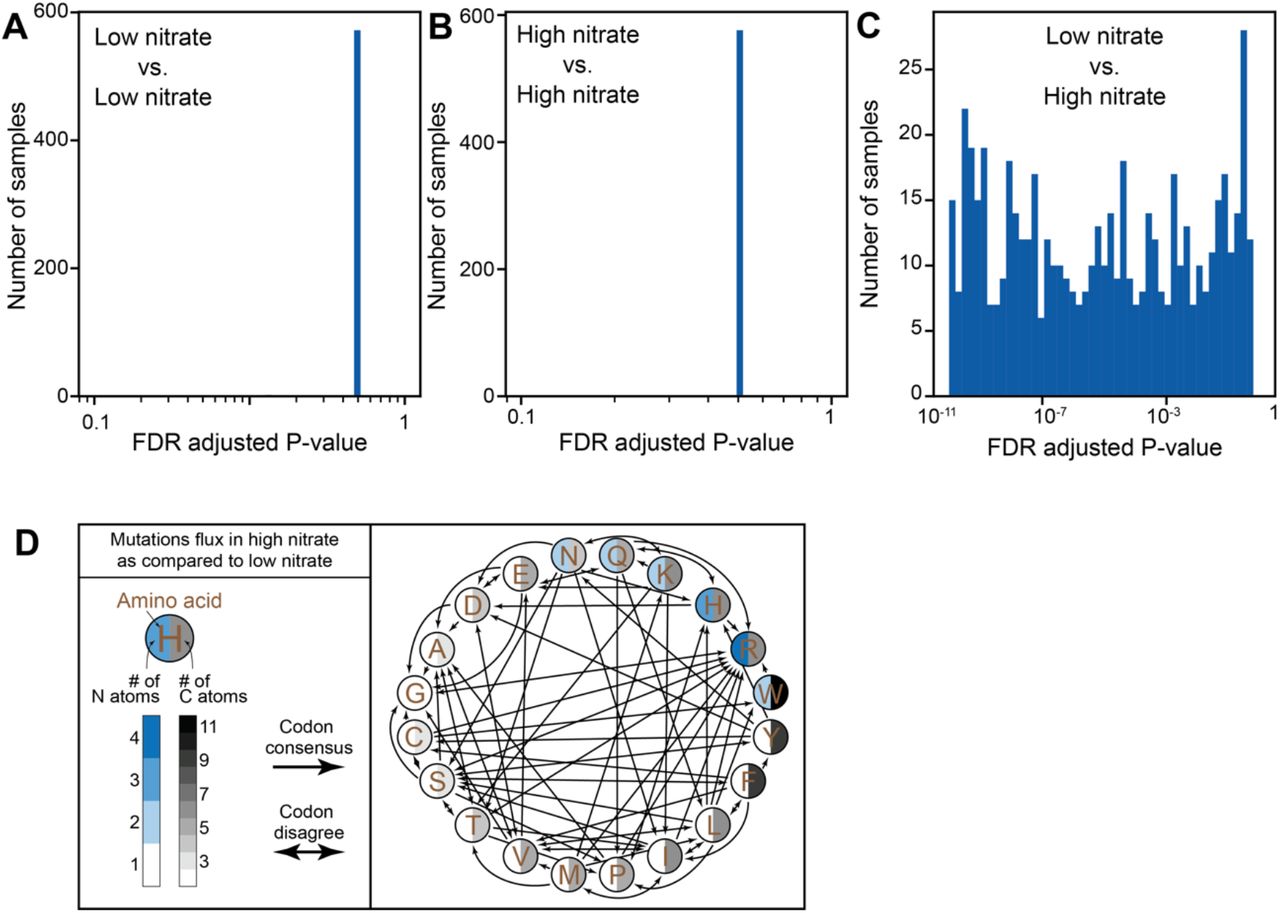
We next sought to quantify the effects of this resource-driven selection on protein-coding sequences. To this end, we compared the codon mutation frequencies in low- and high-nitrate samples, after accounting for simplex-related confounders (Methods), and found significant differences in codon mutation frequencies (Fig. S5A-C). We sought to examine the typical change in nutrient consumption in varying nitrate concentrations. We thus defined mutation flux, as the ratio between a codon mutation and its reverse, and estimated it using the log-odds ratio between the two (e.g., log (p(AAA → AAC)/p(AAC → AAA)). Notably, across all the mutations significantly more prevalent in samples from high nitrate environments (Methods), averaged across amino acids, we find a significant total increase in nitrogen (Fig. 2D; 18 N atoms summed across all significant amino acid changes, P=0.0082), decrease in carbon (Fig 2D; −37 atoms, P=0.0165), decrease in sulfur (−6 atoms, P=0.009), a significant decrease in molecular weight (−508.91 g/mol, P=0.0193) and a non-significant decrease in oxygen (−6 atoms, P=0.1505). These results indicate that the lower the nitrate concentrations are, the stronger the selection against mutations leading to higher nitrogen incorporation in protein sequences.

(A-C) Histograms of the distribution of P-values of codon-to-codon mutations compared between (A) 40 low-nitrate samples and 40 other low-nitrate samples selected randomly out of the 80 lowest-nitrate samples; (B) 40 high-nitrate samples and 40 other high-nitrate samples selected randomly out of the 80 highest-nitrate samples; (C) 40 low-nitrate samples and 40 high-nitrate samples selected randomly out of the 80 lowest and highest nitrate samples. (D) Depiction of mutations common in high versus low environmental nitrate concentrations. Two edged arrows mark aminoacids in which some codon mutations were more common in high-nitrate but the opposite codon mutation was more common in low-nitrate.
While nitrate concentrations increase with depth (Fig. S1I), dissolved organic carbon concentrations typically decrease6. Our results are supported by previous observations regarding genomic and proteomic changes associated with environmental concentrations of nitrate4. Mutations in nitrate rich and, typically, carbon poor environments were shown to drive an increase in genomic GC content, accompanied by higher rates of nitrogen incorporation and lower rates of carbon incorporation into protein sequences. Here we show, in high resolution, the typical mutations that underlie this phenomenon (Fig. 2D; Fig. S5D). As we base our analysis on pN/pS rates, a proxy for the magnitude and direction of selection exerted on coding sequences, we suggest that the differences observed in gene GC content across varying nitrate concentrations are inseparable from changes to the proteome, and are possibly the result of resource-driven selection exerted on these coding sequences.
Resource-conservation as an optimization mechanism in the genetic code
The standard genetic code is known to be highly efficient in minimizing the effects of mistranslation errors and point mutations17–20. This optimality is prominent among theories regarding the origin of the genetic code21–24. According to the theory of error minimization, selection to minimize the adverse effect of point mutations and translation errors was the principal factor governing the evolution of the genetic code25–32. As a quantitative exploration of this theory requires a well-defined cost function, a few measures of amino acid fitness were previously suggested (e.g., PR scale, Hydropathy index) based on stereochemical theories and hydropathy properties33–36. As we have observed strong patterns of selection for specific amino acids in nutrient-limited environments, we hypothesized that resource conservation may also be a factor in code error minimization.
Specifically, we hypothesized that the strong resource-driven selection, whose signature is visible on protein-coding sequences across marine functional groups, may also have resulted in a resource-optimized genetic code, such that the expected cost of a random mutation, in terms of added resources, is minimized. To rigorously test this hypothesis, we first defined a cost function for each element e (e.g., carbon, nitrogen), such that the ‘tariff’ of a single mutation is the difference in the number of atoms before and after the mutation. As an example, a missense mutation from codon CCA to codon CGA results in an amino acid change from proline to arginine, and an increase of 3 nitrogen atoms and one carbon atom, setting the nitrogen cost of such mutation to 3 and the carbon cost to 1 (Fig. 3A).

(A) Nitrogen (left), carbon (center) and oxygen (right) content of different amino acids depicted along their positions in the standard genetic code. (B) Histograms of the expected random mutation cost (ERMC), in 10,000 random permutations of the genetic code for nitrogen (left, blue), carbon (center, black) and oxygen (right, red). Green bar marks the ERMC of the standard genetic code, ERMC(Vs), for each of the elements. (C) Heat map of ERMCCN P-values across 39 organisms and 11 transition:transversion rates. Organisms in each of the groups are ordered according to the GC content of their coding sequences.
To estimate the cost of a random mutation on each element, across the entire genetic code, we calculated, for nitrogen, carbon and oxygen, the Expected Random Mutation Cost (ERMC) for the standard genetic code Vs:
 Where P(ν) is the abundance of codon ν, calculated from all marine samples; P(mut(ν, ν′)) is the probability of mutation from codon ν to codon ν′, set to be the relative abundance of the single nucleotide mutation driving this codon change (e.g. for mutation from GCA to CCA, we use the abundance of G-to-C transversions), calculated from all mutations observed in fourfold degenerate codons to avoid sites under strong selection; and
  is the ‘tariff’ of a single mutation if an atom of element e has been added to the post-mutation amino acid (Methods). For the standard genetic code, and typical codon abundances and mutation rates calculated from marine microbes, we report an ERMC of 0.440, 0.158 and 0.163 for carbon, nitrogen and oxygen respectively, corresponding to an average increase of this number of atoms per random mutation.
To check if the genetic code, along with codon abundances and mutation rates in marine microbes, is indeed robust to resource-consuming mutations, we compared it to other hypothetical codes. To this end, we simulated alternative genetic codes by randomizing the first and second position in all codons, while constraining the permutation in stop codons (Methods), creating a null distribution of ERMC. We found that the standard genetic code, common to most life forms, is parsimonious in terms of carbon and nitrogen utilization, given a random mutation, manifested by minimization of the ERMC for nitrogen (Fig 3B; ERMCN P=0.0153) and carbon (Fig. 3B; ERMCC P=0.0109), while in the ERMC for oxygen we did not find a significant trend (Fig. 3B; P=0.8659). Remarkably, only two out of 10,000 randomized genetic codes were more resource-robust than the standard genetic code in conservation of nitrogen and carbon together (P=0.0002). Nonetheless, these alternative codes are less conservative than the standard code in maintaining hydrophobicity and hydrophilicity of amino acids given a random mutation (Methods; Fig. S6). They may therefore lead to proteins that are more susceptible to structural changes in the event of a random mutation, as was postulated previously in theories governing the evolution of the genetic code.

(A-C) Hydrophobic or hydrophilic properties of different amino acids depicted across their positions in (A) the standard genetic code, (B+C) two permutations of the standard genetic code that were more conservative in terms of nitrogen and carbon ERMC.
Finally, we sought to confirm that our elemental cost function is not confounded by traditional properties of amino acids such as the polar requirement (PR) and hydropathy index33–36. To this end, we calculated the ERMC using these common cost functions for the standard genetic code and for simulated alternative ones, and compared the overlap between traditional cost functions and our elemental cost functions (Methods). For both cost functions, we found that optimality in terms of carbon or nitrogen utilization implies lack of optimality in polar requirement or in hydropathy (Table S1 nitrogen-PR, P<10−16; nitrogen-hydropathy, P<10−4; carbon-PR, P<10−7; carbon-hydropathy, P<10−20). This result indicates that carbon and nitrogen conservation in the genetic code is not confounded by previously reported optimization properties such as hydropathy and PR. Altogether, these results indicate resource optimization in marine microbes is driven by the structure of the genetic code, alongside specific amino acid choices.
Contingency tables for each pair of cost functions for both nitrogen (n+) and carbon (c+), compared to PR (pr) and Hydropathy index (hyd), across 1 million simulated genetic codes. Each code is assigned to one of four bins: (1) surpassing the standard genetic code in both cost functions (<; <), (2) surpassing the standard genetic code only in element e cost (<; >=), (3) surpassing the standard genetic code only in the traditional cost function (>=; <), (4) not surpassing the standard genetic code in neither (>=; >=). Chi-square test of independence was applied to each contingency table.
The genetic code facilitates resource conservation across kingdoms
To show that the robustness of the genetic code in terms of resource-consumption was not limited to our dataset and analytic approach, we calculated the ERMC of 187 species of genera Prochlorococcus and Synechococcus. We calculated codon abundances and mutation rates using prior knowledge of both protein-coding sequences5 and the published transition:transversion rate of 2:137 (Methods). By testing the ERMC of the standard genetic code against a null distribution generated, as before, given these known parameters rather than ones inferred from marine samples, we were able to reveal significant conservation of carbon, nitrogen, and both elements combined (Fig. S7A; ERMCC mean P=0.013, P=0.020; ERMCN mean P=0.049, P=0.032; ERMCCN P=0.0004, P=0.0007 for Prochlorococcus and Synechococcus, respectively). To account for inaccuracies and variation in the known parameters, we next calculated the ERMC null distribution for a wide range of transition:transversion rates. We show that the ERMC of the standard genetic code remains significantly conserved for nitrogen, carbon, and both elements combined for most physiological transition:transversion rates (Fig. S7B), indicating that the structure of the genetic code and codon abundances of organisms are the driving force behind genetic code optimization.

(A) Box plots (line, median; box, IQR; whiskers, 5th and 95th percentiles) of P-values for the ERMC of the standard genetic code for nitrogen (left), carbon (center) and both (right) across 187 Prochlorococcus (P, blue) and Synechococcus (S, red) strains. (B) P-values for the ERMC of the standard genetic code for nitrogen (blue), carbon (black) and both (purple) across a wide range of transition:transversion rates, calculated using combined codon abundance of 187 Prochlorococcus and Synechococcus strains. (C) Heat map of ERMC P-values for nitrogen, carbon and both, for a theoretical case in which all codons are of the same abundance. (D,E) Same as Fig. 3C for ERMCN (D) and ERMCC (E) P-values.
To explore whether this optimality in the genetic code in terms of nutrient conservation extends across different lifeforms, we performed a similar calculation using codon abundances from 39 organisms across all domains of life, including all human protein-coding sequences, and tested a range of transition:transversion rates (Methods). We find that, similarly to marine microbes, the genetic code features optimization in terms of resource utilization for all tested organisms, manifested by a significant minimization of the combined ERMC of nitrogen and carbon in all transition:transversion rates tested (P<0.01, Fig. 3C). Moreover, we find significant optimization, albeit of a lower magnitude, even in the theoretical case where all codon abundances are the same (Fig. S7C). The codon abundances of a great majority of organisms also demonstrate significant minimization of ERMC in nitrogen (Fig. S7D) and carbon (Fig. S7E), given a random mutation, for a wide range of transition:transversion rates. These results indicate that resource optimization in the genetic code transcends taxonomy, codon choices, and mutation rates. It shows that the genetic code may have structural properties that make it robust in terms of resource-consumption. It is also possible that amino acid and codon usage in organisms has evolved to lower nutrient consumption in case of a random mutation, informed by the structure of the code.
Structural principles drive optimization in the genetic code
We next wished to examine the organizing principles that drive the strong resource optimization evident in the standard genetic code. We observed that codons of the nitrogen-rich amino acids histidine, glutamine, asparagine, lysine and arginine span only two nucleotides in their first position and two in their second position. We define this organization to be a ‘square’ arrangement (Fig. 4A; Methods), and hypothesize that, as compared with other arrangements, it amplifies nitrogen conservation. Specifically, in the square arrangement, codons coding for some amino acids (alanine, valine, phenylalanine, and several leucine and serine codons) require at least two mutations to increase the number of nitrogen atoms in the resulting amino acid. This is in contrast to other hypothetical arrangements, including a ‘diagonal’ arrangement in which nitrogen-rich amino acid codons span all possible nucleotides in the first and second positions (Fig 4A; Methods). We suggest that the diagonal arrangement would be nutrient-wasteful, as in these arrangements a single mutation could increase the nitrogen content of a protein sequence in more than one way. To rigorously test this hypothesis, we generated 10,000 random genetic codes, with 220 arrangements happening to embody a square structure, and 127 a diagonal one. We found that, when compared to all other possible arrangements, square arrangements present a significantly lower ERMC (Fig 4A; Mann-Whitney U P<10−10) while diagonal arrangements exhibit a significantly higher ERMC (Fig. 4A; Mann-Whitney U P<10−10). This result demonstrates that resource optimization in the genetic code is driven by structural principles, perhaps underlying the significant optimization observed across kingdoms.

(A) Box plots (line, median; box, IQR; whiskers, 5th and 95th percentiles) of ERMCN of square arrangements (left) and diagonal arrangements (right, Methods), as compared to all other arrangements (center) out of 10,000 randomized arrangements of the code. (B) Violin plot of codon usage among 187 species of Prochlorococcus and Synechococcus showing significant preference of threonine codons ACT and ACC as compared to ACA and ACG, and of isoleucine codon ATT as compared to ACA. ****, P<10−10.
Finally, we hypothesized that codon usage for a single amino acid may also be biased due to differential cost of a random mutation for each codon. We therefore examined all amino acids coded by codons with adenine in their first position, focusing on codon usage of the amino acid threonine. We note that a C-to-G transversion in the second position for codons ACT and ACC yields serine (AGT and AGC, respectively), and that the same mutation for codons ACA and ACG yields arginine (AGA and AGG, respectively; Fig. 4B, inset). As arginine has higher carbon and nitrogen content than serine, and lysine a higher carbon content than asparagine, we hypothesized that following a nutrient-conservative model, codons ACT and ACC will have a higher abundance than codons ACA and ACG, respectively, given a known genomic GC content.
We thus examined codon usage in 187 Prochlorococcus and Synechococcus strains, and show a significantly higher use of ACT as compared to ACA (Fig 4B; Wilcoxon signed-rank test P<10−20) and ACC as compared to ACG (Fig 4B; Wilcoxon signed-rank test P<10−20). Similarly, Isoleucine codon ATT has higher abundance as compared to ATA (Fig 4B; Wilcoxon signed-rank test P<10−20). These results demonstrate that resource conservation is a central driving force in selection processes guiding codon usage and may affect not only protein sequence but also cellular translation efficiency.
Discussion
In this work, we use the proxy of pN/pS rates to show strong purifying selection acting upon protein-coding genes in the marine environment. We demonstrate that a substantial fraction of the variance in pN/pS rates could be attributed to environmental factors, and highlight a strong association of these rates with nitrate concentrations. We show that the variance in pN/pS rates, across resource-consuming genes (i.e., highly expressed and extracellular protein-coding), can be attributed to environmental factors, suggesting that stronger resource-driven selection is exerted upon them. Using single nucleotide polymorphisms from across marine samples, we characterize the typical mutations in nitrate-rich versus nitrate-poor environments and show that these drive incorporation of additional nitrogen-rich amino acids and fewer carbon-rich amino acids to protein sequences. Finally, we provide evidence that the standard genetic code, shared among most lifeforms, facilitates resource conservation, demonstrating that along with codon choices, it is conservative in incorporating additional atoms of nitrogen and carbon given a random mutation. Notably, we show, across tens of thousands of simulated genetic codes, that the standard genetic code surpasses almost all other random simulated codes in conservation of nitrogen and carbon, across multiple taxa from all domains of Life and across multiple codon choices and mutation rates.
Hypotheses regarding the origin of the genetic code include stereochemical affinity between a codon or anticodon and their amino acid38,39; a frozen accident theory24, relying on the fact that the code is highly immutable; a co-evolution of the genetic code with the emergence of amino acid-producing biosynthetic pathways22; and an early fixation of an optimal genetic code, suggesting that the code evolved under selection for error minimization40. Our observations are in line with the latter theory of optimality, and suggest that the genetic code may have been optimized also for nutrient conservation. While we do not know the nature of nutrient cycling in the primordial ocean, we hypothesize that scarcity of nitrogen and carbon that are common now may have also prevailed alongside early lifeforms. Thus, an organism harboring a nitrogen- and carbon-efficient genetic code would have had a selective advantage over its peers, especially in the absence of fully evolved DNA mutation repair mechanisms.
We note that while we observe resource optimization for nitrogen and carbon conservation in the standard genetic code, oxygen conservation is not optimized. We offer several hypotheses regarding this lack of optimization. First, it is possible that since oxygen is highly abundant in organic molecules, it is less of a limiting factor as compared to carbon and nitrogen and therefore its optimization does not confer a selective advantage. Another option is that oxygen-rich amino acids may function in cellular processes that are independent of protein synthesis and are therefore more readily available and thus not optimized. Prominent examples for this hypothesis are aspartate, which also performs an important function in the malate-aspartate shunt, and glutamate, which plays a role in countless cellular processes.
Overall, by using publicly available data on ocean microbes and their corresponding environmental measures, we were able to discern strong purifying selective pressure which shapes marine microbial life, and may have even shaped the structure of the genetic code that was since preserved for billions of years. With the advent of new multi-omic data from environmental studies, we will be able to better divulge the intricate relationships of microbes with a rapidly changing global environment.
Methods
Marine microbiome samples
Marine samples collected with Tara oceans3, bioGEOTRACES10, the Hawaii Ocean Timeseries (HOT) and the Bermuda Atlantic Timeseries Series (BATS)10 were downloaded from ENA with accessions ENA:PRJEB1787 (TARA oceans prokaryotic fraction), ENA:PRJNA385854 (bioGEOTRACES) and ENA:PRJNA385855 (HOT/BATS), each sample with a minimum of 5 million reads.
Mapping of Illumina reads to reference gene sequences
Samples were mapped to nucleotide sequences from the Ocean Microbiome Reference Gene Catalog (OM-RGC)3 using bowtie2 with parameters --sensitive -a 20 --quiet -p 8 and saved as a bam file using the ‘samtools view’ command. As gene sequences are relatively short, reads from both ends of the metagenomic sequencing samples were mapped separately, and reunited prior to variant calling.
Determining metagenomic read assignment probability
We determined the probability of assignment of metagenomic reads to marine microbial genes using the Iterative Coverage-based Read-assignment Algorithm (ICRA)43 with parameters max_mismatch=12, consider_lengths=True, epsilon=1e-6, max_iterations=30, min_bins=4, max_bins=100, min_reads=10, dense_region_coverage=60, length_minimum=300, length_maximum=2e5, use_theta=False. To prevent spurious mapping, alignments were considered for downstream analysis only if the probability of alignment was higher than 0.9.
Variant calling
Alignments from both ends of all sequencing runs pertaining to the same sample were united using the samtools cat command and sorted using the samtools sort command, with default parameters.
To facilitate variant calling in tractable timescales, each filtered, untied and sorted .bam file was split into chunks, each encompassing 10,000 reference sequences (out of about 40 million reference sequences). For each such batch of reference sequences, we called variants across all samples using the following command: bcftools mpileup --threads 4 -a FORMAT/AD -Q 15 -L 1000 -d 100000 -m 2 -f <OM-RGC fasta> <bam filenames> | bcftools call --threads 4 -Ov -mv -o <output vcf>, where <;OM-RGC fasta> is the fasta file of OM-RGC nucleotide sequences, <bam filenames> are the filenames of all .bam files pertaining to the reference sequence chunk in question, and <output vcf> is the output .vcf file pertaining to that same chunk.
Single nucleotide variants were considered as SNPs if they had an allele frequency if at least 1% 44, were supported by at least 4 reads across samples, and had a GATK quality score of at least 30.
For a sample mapped to a reference gene to be considered for downstream analysis, we demanded that at least 60% of SNPs called along the length of the reference gene for that sample would be supported by at least 4 reads, thereby enabling accurate calculation of pN/pS rates. For a gene to be considered for downstream analysis, we demanded for that gene to have at least one SNP common to 20 or more samples.
Calculation of pN/pS in single genes
While comparing SNP patterns across samples, it is instrumental to avoid biases due to differences in coverage. We therefore downsampled the read coverage depth to the minimum depth across all samples, for each position in a sample that was supported by more than 4 reads. For positions that had minimum support of fewer than 4 reads, no subsampling was performed. Subsampling was performed by drawing from a multinomial distribution, with n trials and variant probabilities p, where n was set to the calculated minimum depth and p set to the relative abundance of each variant in the given sample.
The expected ratio of non-synonymous and synonymous substitutions was calculated by considering all called SNPs in every gene. First, we calculate a consensus sequence for each gene by taking, for each SNP position, the variant that was overall more common across all samples (after the subsampling performed above). We counted, for each gene, the number of non-synonymous and synonymous sites across the consensus sequence. For each SNP position in each sample, we counted the number of synonymous and nonsynonymous substitutions. As more than one variant can exist in a single sample, we considered the relative abundance of synonymous to nonsynonymous substitutions dictated by the different variants. For example, if the reference codon was CAC, coding for histidine, one variant, a C-to-G transversion in the third position abundant at 50%, led to a nonsynonymous mutation that resulted in glutamine (CAG) while another variant in the same sample and the same position was a synonymous C-to-T transition, we counted 0.5 synonymous substitutions and 0.5 nonsynonymous substitutions. We followed by calculating the pN/pS ratio:
 pN/pS characterizes selective constraints at the population level, as opposed to dN/dS that characterizes it between individual species 12 and can thus be standardized to a specific time interval and used as an absolute metric. Nonetheless, dN/dS ratios are not applicable in our study since polymorphic sites derived from short read sequencing impede having haplotypes which are a prerequisite for calculating dN/dS.
Aggregation of calculated metrics using KEGG and eggNOG orthologies
Functional assignments to KEGG KOs and eggNOG OGs for all OM-RGC genes were computed using eggNOG-mapper v2 based on the eggNOG v5.0 database41,45. For each functional assignment in each sample, all OM-RGC genes assigned with the same functional assignment were concatenated and treated as one long genomic sequence per the calculation of pN/pS ratios. To reduce noise in pN/pS calculation, we considered only KOs and OGs that had at least 5 genes per sample, in at least 50 samples.
Environmental variables
For each sample, we compiled measurements pertaining to the following environmental measurements: Depth [m], Nitrate [μmol/kg], Nitrite [μmol/kg], Oxygen [μmol/kg], Phosphate [μmol/kg], Silicate [μmol/kg], Temperature [C] and Salinity.
Tara oceans metadata was downloaded from PANGAEA (https://doi.pangaea.de/10.1594/) with accession numbers PANGAEA.875575 (Nutrients) and PANGAEA.875576 (Watercolumn sensor), and recorded median values for all the above nutrients were extracted. Tara nutrient concentrations were given as [μmol/l]. Conversion to [μmol/kg] was done by dividing the measured concentration by the measured specific gravity for the same sample.
bioGEOTRACES metadata was compiled from CTD sensor data and discrete sample data from the GEOTRACES intermediate data product v.246. HOT metadata was downloaded from the ftp server of the University of Hawai’i at Manoa (ftp.soest.hawaii.edu/hot/) and BATS metadata was downloaded from the Bermuda Institute of Ocean Sciences (http://bats.bios.edu/bats-data/). As GEOTRACES/HOT/BATS ocean water samples are not linked to specific biological samples as is the case with Tara oceans samples, we considered only water samples from the exact same geographic location, within a day from biological sample collection time, and within 5% difference in depth of collection, and chose the closest sample in terms of time and depth of collection. As all these measurements of environmental conditions are highly correlated with each other (Fig. S1I), we utilized this correlation structure to impute missing values using the EM algorithm47.
Linear mixed models
Generative model
Consider a collection of Mi, where i ∈ {1,2} features (i.e., M1,2 number of KEGG and eggNOG orthologs respectively), each measured across K samples. We get as input an (Mi × K) matrix O i, where Okji is the pN/pS of ortholog j in sample k. Let yim = (Om1i, …, OmKi) be a K × 1 vector representing the pN/pS in ortholog m, according to grouping i, across K samples (e.g., pN/pS in KEGG KO K02274 across K samples). Let W be a (K × q) normalized matrix of environmental measurements. This included the depth of the sample, water temperature and salinity, as well as concentration of the key molecules nitrate, nitrite, oxygen, phosphate and silicate.
With these notations, we assume the following generative linear model
 Where um and ϵm are independent random variables distributed as
  and
and 
 . The parameters of the model are
  and
and  .
.
It is easy to verify that an equivalent mathematical representation of model (1) is given by
 where
where  . We will refer to K as the environmental kinship matrix, which represents the similarity, in terms of environmental covariates, between every pair of samples across grouping i (i.e., represent the correlation structure to the data).
Environmental explained variance
The explained variance of a specific feature yim. by the environmental measurements

In the second model setting, we wished to account for a potential non-random association structure between pN/pS rates of different orthologs. To this end, we included both the environmental covariates and pN/pS rates of all orthologs not inferred as two different sets of variance components.
In this setting, Let W1 be an (K × q) normalized matrix of environmental measurements, as before and W2 be an (K × Mi − 1) normalized matrix of pN/pS measurements according to grouping i (i.e., KEGG or eggNOG orthologs) across K samples, where for each yim. we exclude the pN/pS rates of the focal ortholog m.
With these notations, we assume the following model

It is easy to verify that an equivalent mathematical representation of model (1) is given by
 where
where  . K1 and K2 represent the similarity, in terms of environmental covariates and pN/pS rates, between every pair of samples across grouping i (i.e., represent the correlation structure to the data).
In this setting, the environmental explained variance is:

KEGG KO expression data as a ranking metric
Using expression data from 4,092 KEGG KOs collected by Kolody et al. 16, we ranked the KO genes in our marine samples in the following way. We first represent the expression data in relative abundance space (normalize each sample by its read counts). Next, for each KO i, where i ∈ {1, …, I}, we sum across different instances of this focal KO. The input is an m × n matrix, where m is the number of different instances of focal KO i, and n is the number of samples. The output is a vector of length n: (x1, …, xn). Finally, we average the expression levels (x1, …, xn) across samples:  and rank the KOs based on the calculated averages expression. Notably, we limited the scope of our analysis to samples collected only in small fraction filters (0.22 μm).
Determination of Synechococcus-specific pN/pS rates
We identified genes from the OM-RGC database belonging exclusively to genus Synechococcus using eggNOG-mapper. We filtered out genes that were present in fewer than 20% of all samples. For each of the samples, we calculated pN/pS on all gene sequences combined. We further divided the samples into five identically sized groups, based on environmental nitrate concentrations, and for each group filtered out genes that were present in fewer than 50% of all samples in the group. We next calculated pN/pS on all the gene sequences that remained in each of the groups.
Determination of extracellular genes
To determine extracellular gene groups, we searched the eggNOG v.5 OG database for the words ‘secreted’ or both words ‘extracellular’ and ‘protein’ in their description. We demanded that the words ‘autoinducer’, ‘expression’, ‘role’ and ‘hypothetical’ are not in the description to prevent instances where (a) the OG in question describes a hypothetical protein; and (b) where the OG produces a secreted particle but is not secreted by itself, as is the case with autoinducer producing genes. To ensure robust pN/pS calculations, descriptions encompassing 10 OGs or more were assigned a group name, while descriptions encompassing less than 10 OGs were all grouped together in one group.
Calculation of mutation flux in divergent nitrate concentrations
We created matrix H(U) as follows: Consider a set U of all genes for which SNP measurements exist and a subset T ⊆ U of this set across K samples. Let  be a codon graph for subset T and sample j, where ν ∈ V is a codon (e.g., CUU coding for Alanine) and (ν, ν′) ∈ E if and only if ν and ν′ are one mutation apart (e.g., CUU for Alanine and CAU for Histidine). Let w(T)j: (ν, ν′) → [0,1] be a weight function where
 . Let H(T) be a matrix of dimension (|E| × K), where
  .
.
We next sum-normalized H per each sample and compared the codon mutation frequencies between the 40 lowest- and 40 highest-nitrate samples. Despite significant differences in codon mutation frequencies between low-nitrate and high-nitrate samples, some of the difference could be driven by the simplex properties of the sum-normalized codon mutation frequencies, and some could be attributed to the different rates of synonymous mutations between the high- and low-nitrate groups, which, combined with simplex properties, may affect observed nonsynonymous mutation rates. To address simplex properties, we employed a centered log-ratio (CLR) normalization on H. The CLR transformation is a mapping, per codon composition, from the simplex to a Euclidean vector subspace. This log transforms each value and then centers them around zero as given below:
 where g(v) is the geometric mean of all of the codons.
To address differences in rates of the different types of mutations, for each mutation (ν, ν′) in the CLR normalized matrix H′(U) we calculated the log odds ratio between the mutation and its reverse mutation. Namely, we computed mutation flux matrix F(U) where 
 . We compared differences in codon mutation flux between low- and high nitrate samples using the Mann-Whitney U-test.
Calculation of expected random mutation cost per genetic code
Let Vbe a genetic code with a set VS ⊂ V of stop codons. Let P(ν) be the abundance of codon ν ∈ V in a sample and P(mut(ν, ν′)) the probability of a single mutation from codon ν to ν′. Let ce: V × V → Z be a cost function for element e, where:

When testing the random mutation cost on hydrophobicity:

With these notations, we define the expected cost of genetic code V for element e as follows:
 And the ERMC cost as:

Where

We estimate ERMCe(V) as follows:
We define P(ν) as the median abundance of all codons ν′ coding for the same amino acid as ν.
We wished to calculate mutation rates in sites that were under minimal selection. To this end, we estimated P(mut(ν, ν′)) by calculating, from fourfold-degenerate synonymous mutation sites the average abundance of each single nucleotide mutation (e.g. A to C) across all genes in which there are called SNPs in all ocean samples, excluding stop codons. We then estimate P(mut(ν, ν′))using the relative abundances of all pairs of single nucleotide mutations. We estimate P(mut(ν, ν′)) for Prochlorococcus, Synechococcus and Human genomes using published transition:transversion rates5,48.
We calculate c using information on the amino acids which each codon codes for.
To compute a p-value, we generate a null distribution by calculating ERMCe(V) for alternative genetic codes. We randomize the first and second position of all codons, while maintaining that the two sets of first and second positions in which the stop codons reside are separated by a single transition mutation.
Confounding effects between cost functions for the structure of the genetic code
To confirm that our elemental cost function is not confounded by traditional properties of amino acids such as the polar requirement (PR) and hydropathy index33–36, we calculated the expected random mutation cost (ERMC), per genetic code, using these common cost functions across 1 million simulated alternative codes. To this end, we randomized the first and second position of all codons, while maintaining that the two sets of first and second positions in which the stop codons reside are separated by a single transition mutation. We next calculated a contingency table for each pair of cost functions for both nitrogen and carbon (i.e., ERMCN(V):ERMCPR(V), ERMCN(V):ERMChydropathy(V), (V):ERMCPR(V), ERMCC(V):ERMChydropathy(V)). We assign each code to one of four bins in the following way: (1) surpassing the standard genetic code in both cost functions (e.g., nitrogen and PR), (2) surpassing the standard genetic code only in element e cost (e.g. only nitrogen), (3) surpassing the standard genetic code only in the traditional cost function (e.g., PR), (4) not surpassing the standard genetic code in neither. Finally, we applied the Chi-square test of independence with two degrees of freedom to each contingency table.
Determination of ‘square’ and ‘diagonal’ arrangements of the nitrogen genetic code
We define a ‘square’ arrangement of the codons coding for nitrogen-rich amino acids histidine, glutamine, asparagine, lysine and arginine as one where their codons span only two nucleotides in the first position and two nucleotides in the second position. In the standard genetic code, these amino acids are coded by CAN, CGN, AAN, AGR, following a square configuration. In contrast, a ‘diagonal’ arrangement of the codons coding for these amino acids is one where they span all possible nucleotides in the first position and all possible nucleotides in the second position. For example, a genetic code where TTY codes for histidine, TTR for glutamine, CCN and AAR for arginine, GGY for asparagine and GGR for lysine constitutes a ‘diagonal’ arrangement of nitrogen amino acids. In each of the alternative genetic codes we generated, we tested whether either of these conditions hold and, if so, designated the code as ‘square’ or ‘diagonal’ accordingly.
Prochlorococcus and Synechococcus genomic data and mutation rates
We downloaded Prochlorococcus and Synechococcus protein-coding gene sequences (where available) from the Joint Genome Institute (https://genome.jgi.doe.gov/portal/) following accession numbers published by Berube et al. 5. To estimate codon relative abundance P(ν), we counted and sum-normalized codons in all protein-coding genes for each species. To estimate codon mutation rate P (mut(ν, ν′)) we used the published transition:transversion rate of 2:1 for Prochlorococcus and Synechococcus 37.
Multiple taxa ERMC calculation
To calculate ERMC for 39 taxa across multiple transition:transversion rates, we downloaded codon usage and GC-content data collected by Athey et al.49. We used codon usage counts to estimate P(ν)and 11 transition:transversion rates (1:5, 1:4, 1:3, 1:2, 2:3, 1:1, 3:2, 2:1, 3:1, 4:1, 5:1) to estimate P(mut(ν, ν′)).
Footnotes
↵^ dzeevi{at}rockefeller.edu


