

Abstract
Gene regulation interprets most variations of biological phenotype and remains a crucial topic in biology. Conventionally, manipulating gene sequences like knockout helps to infer gene regulation, but these inferences suffer several pitfalls like transcript compensation1, leading to biased results. An unbiased regulation has rarely been appreciated. Here, we develop a software, FINET2, to infer unbiased regulatory networks from massive data, including all human RNAseq data publicly available from Sequence Read Archive (SRA, 274469 samples) and The Cancer Genome Atlas (TCGA, 11574 samples), and unearth the general regulatory rules in normal genome and cancer as deposited3. Generally, the genome is positively regulated. Regulators primarily self-regulate their targets in the same annotated category, like processed-pseudogenes regulating processed-pseudogenes. At normal, ribosomal proteins drive the regulatory network, and proteins tightly control the genome and primarily regulate the remote proteins across chromosomes, but rarely regulate local targets (<1M bp), yet cancer noncoding RNAs, especially pseudogenes, strongly activate the cancer genome and induce local targets, including noncoding RNAs and proteins. As a result, the whole regulatory regime switches from a normal remote protein-controlled domain to a cancerous local noncoding RNA-activated niche. This parallels with our recent discovery from clinical data revealing noncoding RNAs as the deadliest drivers for cancer4, instead of proteins as conventionally thought. This refreshes the fundamental basis of cancer research and therapy. Our overall finding provides a systems version of the natural regulatory regime in human genome, which helps to correct the biased notions standing in current literature.
To generate a general gene regulatory network, we needed to obtain data with all conditions and a software. SRA and TCGA provides such data, referred to as normal and cancer respectively (materials and methods). We developed FINET2, which combines julia language with elastic-net and stability-selection methods, and can efficiently and accurately infer regulatory interactions with >90% true positive ratio (true positives/total true callings), dramatically improving when compared to current software5. We used FINET to search all possible gene regulations by treating each gene as target to select its regulators from the rest of all annotated genes (materials and methods). This search generated a comprehensive network for normal and cancer, respectively, and contained 19721 nodes (genes) with 63878 interactions, and 25402 nodes with 61772 interactions (Fig. 1A). As expected, our networks were much less complex than normal because they only collected the reliable positive interactions with generality in all conditions.

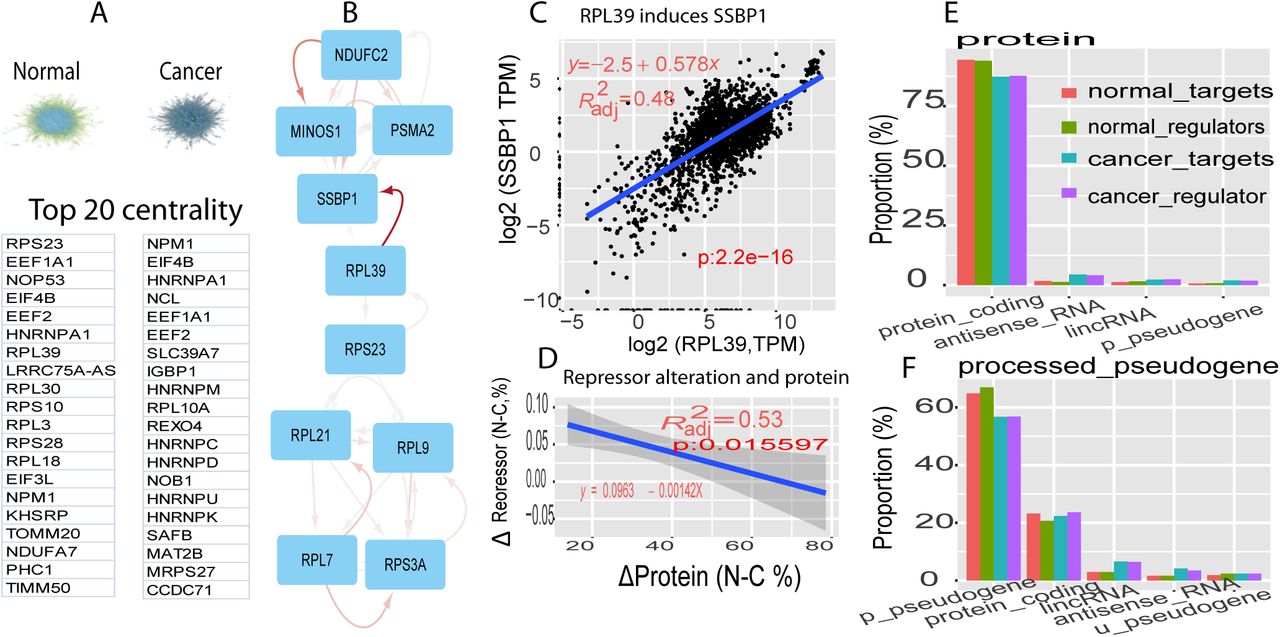
A, general regulatory network and its top 20 central rulers for normal (left) and cancer (right). B, a module containing top 1 ruler (RPS23) in normal. Edge color represents strength of regulation, darker, stronger, and arrow as regulatory directions, arrow as positive and square as negative. C, linear regression between SSBP1 and RPL39. D, linear regression between delta protein percentage and delta repressor percentage (normal percentage-cancer percentage). E-F, profiling self-regulated gene categories for protein (E) and p-pseudogene (F). Regulators and their targets were counted separately. For example, in protein(E) at normal, proteins work as regulators and count their targets, marked as normal-target; in reverse, proteins serve as targets and count their regulator, denoted as normal-regulators(E).
To understand the core controllers of the normal and cancer networks, we investigated each network centrality and modules6 (materials and methods). Ribosomal proteins dominate the top 20 centrality in normal, while telomerase ranks at the top in the cancer (Fig. 1A). At normal, the number one centrality, RPS23, works as a bridge in a module (module #35 in table S1) and as an inducer to RPL39, which strongly activated a hub in the module, SSBP1 (R2 adj=0.48, p< 2.2e-16, Fig. 1B-1C). SSBP1 did not interact with any members of this module in STRING database, although the interactions between ribosomal proteins have also been identified in STRING (Fig. S1). This suggests that the current knowledge of gene regulations is seriously biased to genes with similar functions, but lacks depth and investigation about interactions between seemingly irrelevant genes. In addition, only 7% of interactions were mapped to the STRING database (materials and methods), suggesting the novelty of our network.
We clustered network modules into either protein or noncoding module (materials and methods). At normal, protein modules (proteins > 50% in a module members) occupied 60.52% of total 38 modules (table S1) and noncoding (noncodings >50% in module components) only took 28.94% (Fig. S1B), while cancer modules significantly changed their compositions (p-value = 0.02963, Pearson’s Chi-squared test with Yates’ continuity correction, referred as chisq-test thereafter), with protein reduced to 47.29% and noncoding increased to 45.94% of total 74 cancer modules (Fig. S1B, table S2). In addition, the overall regulators and targets also significantly shifted from normal proteins to cancer noncoding RNAs (p-value = 0.06917,chisq-test, Fig. S1C).
Based on gene ontology (GO), these top 20 centralities in normal networks perform crucial functions in translation (RPL18, RPL3, RPL30, RPL39, RPS10, RPS23, RPS28). Consistently, the functions for the whole normal network and modules (table S1) were also relevant to translation and negative regulations, suggesting ribosomal proteins as the active, tightly regulated core of the human genome. In contrast, telomere maintenance guided by telomerase served as the function for top 20 cancer centrality (HNRNPA1, HNRNPC, HNRNPU). The whole cancer network and modules (table S2) also executed relevant functions and regulation of the cell cycle and alternative splicing, but these proteins activated in cancer were actually driven by noncoding RNAs as shown below and in our another study4.
To understand general regulation direction (positive or negative), we examined the coefficient distribution of regulators. In total, more than 99% of regulators in both normal and cancer carried positive coefficients referred to as the inducer, and less than 1% as repressors (Fig S2A-S2B). This evidence indicates that the human genome is positively regulated in both normal and cancer, consistent with GENCODE observation7. However, cancer has much stronger inducers, with significantly higher coefficients than normal (p<1.1e-9 Fig S2C). Furthermore, a cancer genome’s lost repressors (Fig S2D), leads to increased protein activation (R2 adj=0.53,p<0.0155, Fig 1D). These together suggest the cancer genome, in a highly activated state, featured greater, stronger inducers and fewer repressors.
To understand the general gene regulatory rule of regulators, we examined the distribution of regulator numbers and their targets in top 4 abundant gene categories: protein-coding, processed-pseudogene (p-pseudogene), lincRNA, and antisense RNA. When protein-coding genes served as regulators at both normal and cancer, their targets were mostly proteins(>87%), and the noncoding gene targets are very limited. On the other hand, when proteins worked as targets, their regulators were also proteins (>87%, Figure 1E). Surprisingly, when p-pseudogenes served as regulators, their targets were also mostly (>60%) p-pseudogenes (Figure 1F). The reverse was also true. Furthermore, similar patterns of self-regulation occurred in lincRNAs and antisense RNAs (Figure S3A-S3B). This evidence places self-regulation in the same gene category as one of the general regulatory rules in biology.
To appreciate the target location rule debated recently8,7,9, we investigated the target site distribution of top four gene categories. Generally in both normal and cancer, all regulators prefer to target their targets densely in two locations: either outside the chromosome as trans-regulators, or less than 1M bp as cis-regulators (Figure 2A-2B). Yet the target density in these two locations were quite different between normal and cancer. At normal, p-pseudogene, protein and lincRNA served as trans-regulators and mostly regulated their targets located outside the chromosome, 80%, 60%, 55% respectively (Figure 2A), while antisense RNAs worked as cis-regulators and targeted mostly (>50%) local (<1M bp) targets. In addition, 25% and 10% of antisense RNAs and lincRNAs respectively regulated their targets with overlapped sequences, while p-pseudogenes and proteins rarely regulated their targets with overlapped sequences. In cancer, however, most regulators of all categories turn to regulate their targets locally (<1M bp Figure 2B). Specifically, more than 80% of lincRNAs and antisense RNAs and significant proteins (45%) worked locally. This suggests the target site rule switching from remote in normal to local in cancer.

A-B, target location distribution of top abundant gene categories (>10%) in normal (A) and cancer (B). outchro: target locating outside chromosome, M as million inside the chromosome.
To appreciate the strongest regulatory rule and to make our pattern robustC, we examined the composition of the top regulators and their targets. Based on coefficient, the top 300 inducers and repressors were selected respectively for normal and cancer. At normal, proteins worked as the strongest inducers. From the top 300 to top 10 inducers, proteins occupied 60% out of top 300 and 50% at top 10 (Figure 3A-3C). lincRNAs came next and occupied ∼20%. Yet in cancer, proteins even did not show up (<10%) and noncoding RNAs dominated the top inducers instead. For example, p-pseudogenes counted 70% out of top 10 (Figure 3A), suggesting noncoding RNAs as the primary rulers in cancer genome. Interestingly, these noncoding RNAs almost purely targeted proteins (>98%) in cancer, while in normal, proteins, p-pseudogene, and lincRNA became targets (Figure 3B, 3C). This suggested that proteins work as targets instead of fundamental drivers for cancer, and the conventional practice to treat proteins as cancer drivers is a mistake. Consistently, analyzing clinical data also reveals noncoding RNAs as the deadliest regulators for all types of cancers4.

A, profiling gene categories of top 300 inducers at normal and cancer, from top 300 to top 10 inducer. B, the gene categories of targets of top 300 inducers of normal and cancer. C, top 10 inducer lists at normal (upper) and cancer (bottom).
As for the strongest repressors, almost all repressors were proteins at normal, while at cancer repressors contained antisense RNAs, p-pseudogene, and proteins, with at least 10% at each (Fig S4A). Surprisingly, regardless of repressors, almost all targets were proteins >85%, and any noncoding RNA category was too low to show (<10%) (Fig. S4B). Identifying proteins as targets for both inducers and repressors in cancer interprets why the current observations have focused on proteins, yet treating targets as cancer drivers is a big mistake. Our discoveries identifying noncoding RNAs as key cancer drivers evidently presents a novel basis for understanding cancer, eventually making all cancers curable.
Our overall results establish fundamental rules and resources of general gene regulations in the human genome.
Availability
software FINET and network were respectively deposited in github2 and project website3
Materials and methods included in supplemental data.
Footnotes


