

Abstract
Many biosynthetic gene clusters (BGCs) in the genomes of environmental microorganisms require heterologous expression in order to realize their genetic potential, including cryptic and metagenomic BGCs. Streptomyces coelicolor M1152 is a widely used host strain for the heterologous expression of BGCs, as it has been genetically engineered for this purpose via the deletion of four of its native biosynthetic gene clusters (BGCs) and the introduction of a point mutation in the rpoB gene that encodes the beta subunit of RNA polymerase. This latter mutation was shown to have a strong positive impact on antibiotic biosynthesis via processes that remain poorly understood. Therefore, a systemic understanding of the consequences on cellular metabolism of the genomic changes of M1152 could greatly contribute to this understanding. Here we carried out a comparative analysis of M1152 and its ancestor strain M145, connecting observed phenotypic differences to changes in transcript and protein abundance. Measured protein abundance was used to constrain an amended genome-scale model (GEM) and to predict metabolic fluxes. This approach connects observed differences in growth rate and glucose consumption to changes in central carbon metabolism, accompanied by differential expression of important regulons. Our results suggest that precursor availability is not limiting the biosynthesis of secondary metabolites. This implies that alternative strategies could be beneficial for further development of S. coelicolor for heterologous production of novel compounds.
Importance This study provides the first systems description of S. coelicolor M1152, an engineered host widely used for the heterologous expression of BGCs directing the synthesis of natural products. By combining time-series proteomics and transcriptomics, batch fermentation data and genome-scale modelling, we can connect observed phenotypes to known genetic modifications and find extensive metabolic rewiring in the M1152 strain compared to the wild-type stain M145. Our study indicates that the deletion of secondary metabolite biosynthetic pathways thought to enhance precursor availability, only has a minor impact on the ability of the modified strain to produced heterologous molecules. In contrast, the rpoB mutation is likely responsible for the most dramatic changes in regulatory features and precursor availability. The amended genome-scale model, reconstructed in an open-science framework, allowed us to contextualize the transcriptional changes. This framework facilitates further development by the research community in an organized manner, including version control, continuous integration and quality control and tracking of individual contributions.
Introduction
The bacterium Streptomyces coelicolor has been the de facto model actinomycete for the production and regulation of antibiotics (1). Being known for over 100 years, the interest in this organism predates the golden age of antibiotic research. With its complex life cycle, featuring mycelial growth and differentiation, spore formation, programmed cell death and the ability to produce multiple secondary metabolites, including calcium-dependent antibiotic (CDA) and the conveniently coloured actinorhodin (Act, blue) and undecylprodigiosin (Red, red), it has assisted greatly in our understanding how streptomycetes sense their surrounding (2–6), activate their developmental cycle (7) and regulate the production of antibiotics (8, 9). Further aided by the publication of its genome sequence (10), the antibiotic coelimycin P1 (yellow), produced from the formerly cryptic polyketide gene cluster known as cpk, was added to this list (11). Today, the widespread use of S. coelicolor continues as a host for heterologous production of biosynthetic gene clusters (BGCs) (12–17). Heterologous expression is a powerful strategy for novel compound discovery from BGCs that are either natively silent or originate from an unculturable source (18). Both are large untapped resources of microbial biodiversity, nowadays made evident and accessible due to recent advances within the fields of metagenomics, molecular biology and bioinformatics (19).
The efficiency of S. coelicolor as a heterologous production host relies on a metabolism that has evolved to provide the necessary precursors to produce a broad range of complex molecules. Many of these molecules are produced when the strain is experiencing nutrient-limiting conditions that lead to growth cessation and complex re-modelling of its metabolism (20). Metabolic switching in S. coelicolor M145 in response to phosphate and glutamate depletion has previously been studied in detail at a wide variety of metabolic levels (1–3), unravelling a complex sequence of switching events that ultimately lead to the biosynthesis of the antibiotics CDA, Red and Act. The biosynthesis of coelimycin P1 occurs earlier than the three other compounds in the growth cycle and appears to be independent of the major metabolic switch (8).
To improve S. coelicolor M145 as a host for heterologous BGCs expression, strain M1146 was created by the sequential deletion of its four major BGCs (act, red, cda and cpk) (13). This should increase precursor availability for the production of a whole range of heterologous products and provides a cleaner chromatographic background to easier identify novel compounds. S. coelicolor M1152 is a derivative of M1146, that besides the deletion of the four main BGCs bears the C1298T point mutation in the rpoB gene that encodes the beta subunit of RNA polymerase. This mutation was shown to have strong positive effects on the production of various antibiotics (13, 22). Up to now, M1152 is a preferred general ’superhost’ for heterologous BGC expression (12, 16, 23–25) and is the starting point for further strain development.
A hurdle in further development of S. coelicolor as a ’superhost’ is the limited knowledge of M1152 metabolism and its regulatory systems, even if some insight can be gained from analysing snapshots of gene expression levels during regular time intervals of a batch fermentation (26–30). Since enzymes are catalysing most metabolic transformations, assessing protein abundance or gene expression contributes to the elucidation of metabolic behaviour. Here, we therefore apply proteomics data as constraints (31) on a genome-scale metabolic model (GEM) of S. coelicolor to reveal how proteome changes affect the metabolic fluxes during the different stages of growth and development, and how the metabolism of S. coelicolor M1152 differs from its parent strain, M145.
GEMs are both valuable resources of strain-specific knowledge, mathematical models able to predict steady-state flux distributions, and frameworks for interpretation and integration of different ‘omics’ data, e.g. transcriptomics and proteomics (32). The increased interest in using genome-scale models of S. coelicolor is conspicuous. Since the first reconstruction in 2005 (33), five GEMs have been published (15, 34–37), including three in 2018: iKS1317 (15), Sco4 (37) and iAA1259 (35). Additionally, as a model organism for the Actinomycetes, the GEMs of S. coelicolor are frequently used as template for model development of closely related strains (38), such as S. clavuligerus (39), Saccharopolyspora erythraea (40) and S. lividans (41). The recent updates of the S. coelicolor GEM were developed in parallel by different research groups: while all groups share the common interest of utilizing a high-quality model for predictions and data analysis, the prevailing approach of independent parallel development is inefficient. Additional to duplicating a considerable amount of work, lack of common standards for documentation of progress and issues, evaluation of model performance, as well as the use of different annotations makes it cumbersome to compare and merge models.
To increase the rate and quality of model reconstruction, in this study two research groups of the Sco-GEM community, responsible for two of the latest model updates (15, 37), have joined forces to merge existing GEMs of S. coelicolor into one consensus-model that is publicly hosted on GitHub and can be continuously updated and improved by all members of the community. Hosting the model on GitHub has many advantages: (i) open access and contribution; (ii) version control; (iii) continuous development and integrated quality control with memote (42); (iv) new improvements released instantly (no publication lag time); and (v) complete documentation of model reconstruction. Such an approach has historic precedents: model reconstruction as a community effort has been a success for the human GEM (43), baker’s yeast (44–49) and Chinese Hamster Ovary cells (50). The recent developments in S. coelicolor model and strain improvements in different research groups prove that it is an opportune time now to join forces in the Streptomyces modelling efforts as well.
Results
Improvement of Sco-GEM
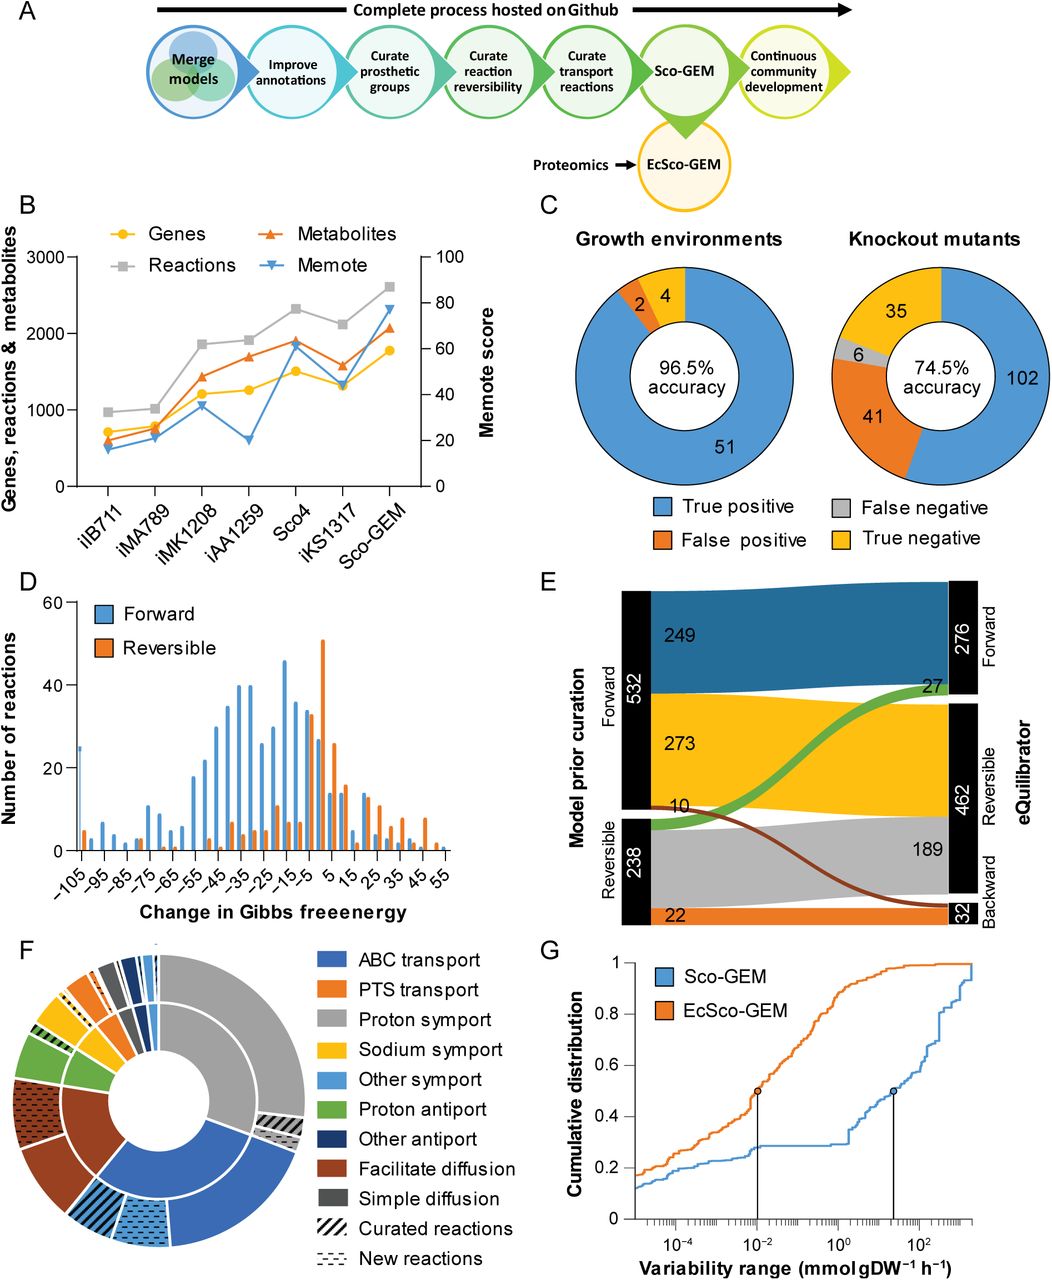
We conducted a stepwise reconstruction of Sco-GEM, the consensus genome-scale metabolic model of S. coelicolor, while tracking development using Git for version control (Figure 1A; Data Set S1, Tab 1). Sco-GEM is the most comprehensive and highest quality GEM of this organism (Figure 1B), comprising 1777 genes, 2612 reactions, 2073 metabolites and a memote score of 77%, which is indicative of the overall model quality (42). Sco-GEM features accuracy of 96.5% and 74.5% (Figure 1C) in predicting correct phenotypes for growth environments and knockout mutants, respectively.

A) Schematic overview of the various steps in the Sco-GEM reconstruction process. B) The overall memote score and number of genes, reactions and metabolites for the 7 published S. coelicolor GEMs. C) Assessment of the model quality by comparing in vivo observations with in silico predictions. D) The change in Gibbs free energy for 770 reactions that were annotated as either reversible or forward irreversible in the model prior curation of reaction reversibility. The histogram is truncated at -105 kJ/mol, and more negative values are assigned to the leftmost bin. E) Analysis and comparison of the directionality and reversibility of reactions prior curation and the direction inferred from the change in Gibbs free energy as estimated by eQuilibrator. F) Overview of the 369 transport reactions included in Sco-GEM, whereof 42 were curated and 65 added during this work. The inner ring categorizes the reactions into 9 different subgroups, while the outer ring displays the amount of curated and added reactions within each category. G) Comparison of cumulative flux variability distributions, demonstrating that the incorporation of kinetic coefficients in EcSco-GEM greatly constrains the solution space.
Sco-GEM has been reconstructed by curating the recently published iKS1317 model (15) to include genes, reactions and metabolites from the equally recently published models iAA1259 (35) and Sco4 (37). While the curations from iAA1259 were primarily related to coelimycin P1, butyrolactone, xylan and cellulose pathways, the 377 reactions added to Sco-GEM from Sco4 were scattered across a large range of different subsystems, covering both primary and secondary metabolism (Figure S1).
Subsequent to merging the existing S. coelicolor GEMs, we performed a number of further curations of the model: including improvement of annotations, both in terms of coverage and number of different databases, e.g. KEGG (51, 52), BioCyC (53), ChEBI (54) and MetaNetX (55). All reactions and metabolites have been given identifiers according to the BiGG namespace (56), and all reactions are categorized into 15 different subsystems, covering 128 different pathways.
The biomass composition was curated to reflect estimated levels of prosthetic groups that are associated to cellular proteins. Proteomics data, as discussed below, were used to estimate protein levels, while UniProt (57) provided annotations of proteins with prosthetic groups, which was used to estimate overall prosthetic group levels (Data Set S1, Tab 2).
Reaction reversibility updated for almost a third of queried reactions
The determination of reaction directionality and reversibility is an important step in a GEM reconstruction (58). However, the thermodynamic consistency of reactions was not considered in previous S. coelicolor models. We calculated Gibbs free energy changes for 770 of the 2612 model reactions (Data Set S1, Tab 3) using eQuilibrator (59), and inconsistencies in assigned reaction bounds transpired from a significant overlap of the range of Gibbs free energies between reversible and irreversible reactions (Figure 1D). A relatively lenient threshold of −30 kJ/mol was defined to classify a reaction as irreversible; with the intent not to over-constrain the model (Figure 1E). The proposed changes in reversibility were evaluated against growth and knockout data (15), discarding 59 of 770 of the proposed reactions. Consequentially, the flux bounds of 273 reactions were modified, while all ATP-driven reactions were manually curated and generally assumed irreversible, unless they had an estimated positive change in Gibbs free energy or were known to be reversible. Examples of this include nucleoside diphosphate kinase (60) and ATP synthase (61).
Curation of transport reactions
As transport reactions have previously not been extensively curated in S. coelicolor models, we performed a thorough curation of transporters by querying various databases and BLAST analysis as detailed in Materials and Methods. This culminated in adding 43 new transport reactions and updating 39 of the 262 existing reactions in Sco-GEM (Figure 1F; Data Set S1, Tab 4). The majority of the transporters comprises primary active transport proteins and secondary carriers (46%), in accordance with previous work (62). Most primary active transporters are ATP-binding cassette (ABC) transporters (30%), while proton symports (30%) dominate the secondary carriers.
Development of the enzyme-constrained model EcSco-GEM
To include explicit constraints regarding enzymes catalysing metabolic reactions, the GECKO formalism (31) was applied to introduce enzyme turnover rates (kcat) and prepare the model for integration of proteome data. The flux variability of the resulting enzyme-constrained model (EcSco-GEM) is strongly reduced compared to the classic genome-scale model (Figure 1G), as infeasible solutions due to limitation in protein allocation are discarded, significantly improving model predictions. From this, 17 time- and strain-specific EcSco-GEM models were generated by incorporation of estimated growth-, secretion- and uptake rates, as well as proteome data from cultivations that are detailed and analysed below.
Framework for further development of Sco-GEM by the community
The Sco-GEM model is hosted as an open repository as suggested by memote, a recently developed tool for transparent and collaborative model development (42). The memote tool is incorporated in the repository through Travis CI and tracks the model development on every change of the model. Sco-GEM v1.2.0 achieved a memote-score of 77%, which is superior to any previous model of S. coelicolor (Figure 1B; Supplemental Information).
Hosting Sco-GEM on GitHub with memote integration ensures continuous quality control and enables public insight into all aspects of model reconstruction and curation: any user can report errors or suggest changes through issues and pull requests. As contributions to the model development are fully trackable and can therefore be credited fairly, Sco-GEM is positioned as a community model that we envision to be continuously updated and widely used by the S. coelicolor research community.
In the remaining parts of the Results section, we have applied Sco-GEM along with transcriptome and proteome data, to study and compare the responses of S. coelicolor M145 and M1152 to phosphate depletion on a systems level and for the first time provide detailed insight into the distinct physiological features of engineered ’superhost’ strain M1152, which will be of value for its further development.
The enzyme-constrained model connects regulatory changes in S. coelicolor M145 in response to phosphate depletion with the production of the major secondary metabolites
To evaluate whether the (Ec)Sco-GEM models can simulate behaviours of S. coelicolor metabolism, we performed and analysed time-course sampled cultivations of secondary metabolite producing strain M145 in the context of the generated models. For that purpose, S. coelicolor M145 was cultivated in batch fermentations using standardized protocols reported earlier (20). Cultures were sampled for ’omics data, as well as substrate utilization and secondary metabolite measurements to identify regulatory, proteomic and metabolic changes during the metabolic switch. The online and offline measurements showed that phosphate depletion in the cultivation medium was reached approximately 35 hours after inoculation. Shortly after, the culture growth ceased, and first Red and subsequently Act were detected in the culture medium (Figure 2A and 2B). Both D-glucose and L-glutamate were consumed concomitantly, and their consumption continued after phosphate depletion, while both remained in excess until the end of cultivation. Note that Streptomyces can utilize intracellular phosphate storages after the medium is phosphate depleted (63). The RNA-seq and untargeted proteomic data were analysed in the light of previous studies (8, 9) and were in good agreement with data previously obtained from microarrays or targeted proteomics (8, 34) (Figure 2C and S2). This confirmed the high reproducibility of the experiments across independent cultivations and high reliability of the chosen cultivation and analytic procedures (Figure 2).

Compounds produced (A) and consumed (B) during batch fermentation of S. coelicolor M145. Time points for sampling for transcriptome and proteome analysis are indicated with red triangles. The dashed vertical line indicates when phosphate in the medium has been depleted. Error bars are standard deviations of three biological replicates. CDW, Cell Dry Weight; Red, undecylprodigiosin; TBP, Total Blue Pigments/actinorhodins; CO2 volume corrected respiration; D-Glc, D-glucose; L-Glu, L-glutamate; PO4, phosphate. C) Comparison of previously published microarray data (8) and RNA-seq data (this study) for genes previously found to respond to phosphate depletion (8). D) Clustered heatmap of CO2-normalized Z-scores for each of the top 10 varying pathways plus the pathways for the 4 major BGCs in M145, as revealed by simulations with the proteomics-integrated EcSco-GEM model. The dashed vertical line indicates the time point of the metabolic switch. E) RNA-seq data of the 4 major BGCs show the onset of biosynthesis of actinorhodin (Act), calcium-dependent antibiotic (CDA), coelimycin P1 (Cpk) and undecylprodigiosin (Red) at different time points during the batch fermentations of M145.
The proteome data were incorporated into EcSco-GEM to yield time-specific metabolic models of M145, giving insight on the changes occurring in the metabolic activity of different pathways during batch cultivation. Metabolic fluxes were estimated using an unbiased approach of random sampling, as alternative to optimization of a well-defined cellular objective used in flux balance analysis (64). It is possible that S. coelicolor is wired to maximize its growth rate prior to phosphate depletion, but after the metabolic switch, it is difficult to define a clear cellular objective. We applied an approach that samples the vertices of the solution space (65), and used their mean values to compare the metabolic fluxes between the two strains and between different time points. The general overview from Figure 2D is an initial validation of the model. It shows that the metabolic switch induces a large shift in global gene expression (8) and predicts that the most drastic changes in fluxes occur in response to phosphate depletion.
The response to phosphate depletion from the medium is achieved by a set of genes, positively regulated by PhoP, that are involved in phosphate scavenging, uptake and saving (66–68). The metabolic switch can be readily identified by the rapid upregulation of this regulon after 35 hours of cultivation in M145 and 47 hours in M1152 (Figure 2C). PhoP also negatively regulates nitrogen assimilation (69), which can partly explain the change in amino acids metabolism after phosphate depletion. Indeed, from the RNA-seq data we find that glutamate import, the glutamate sensing system gluR-gluK (70), glnR (71) and glnA are downregulated immediately subsequent to phosphate depletion (Figure S3). Since PhoP is also known to regulate negatively the biosynthesis of secondary metabolites, the switching of its expression likely delays these pathways (69, 72). However, after 37 hours of cultivation the upregulation of the cda and red genes was observed, whereas that of the act genes was initiated at 41 hours (Figure 2F). Production of Red and Act was measurable in the culture medium after 41 and 49 hours of cultivation, respectively (Figure 2B). The enzyme-constrained models predict an immediate increase in fluxes through the biosynthetic pathways for the four main compounds Act, Red, CDA and coelimycin P1 after the metabolic switch (Figure 2D).
The onset of secondary metabolism is strongly correlated with an increase in oxidative phosphorylation and a decrease in fatty acid biosynthesis in M145. The metabolic switch was shown to be correlated with an enhanced degradation of branched-chain amino acids (valine, leucine and isoleucine), an increase in oxidative phosphorylation and a decrease in fatty acid biosynthesis (Figure 2D and S4). An active oxidative phosphorylation relies on an active TCA cycle that generates reduced co-factors whose re-oxidation by the respiratory chain generates a proton gradient that drives ATP synthesis by the ATP synthase. The feeding of the TCA cycle requires acetyl-CoA, as well as nitrogen. Nitrogen likely originates from degradation of glutamate and branched-chain amino acids, whereas acetyl-CoA likely originates from glycolysis, as well as from the degradation of these amino acids as previously demonstrated (73). Indeed, the model predicts an increased flux through citrate synthase feeding acetyl-CoA into the TCA cycle (Figure S5A). The predicted increase in oxidative phosphorylation is supported by the RNA-seq data showing upregulation of enzymes belonging to the respiratory chain (Figure S5B). This is consistent with the clear correlation previously reported between high ATP/ADP ratio, resulting from an active oxidative phosphorylation, and actinorhodin production (74). Furthermore, the consumption of acetyl-CoA by the TCA cycle to support the oxidative metabolism logically impairs fatty acids biosynthesis (74).
The pentose phosphate pathway provides the main redox cofactor NADPH for polyketide biosynthesis, as well as to combat oxidative stress, and its model-predicted flux increase upon initiation of polyketide synthesis is in agreement with previous studies (75, 76). A clear positive correlation was also noticed between the biosynthesis of alanine, aspartate and glutamate, which are precursors for CDA and/or coelimycin P1 (Figure 2D) and the biosynthesis of these antibiotics. Similar observations were made in the antibiotic-producing Amycolatopsis sp. (77). Our EcSco-GEM model proved to be in good agreement with previously reported findings, indicating that it is able to capture S. coelicolor metabolic behaviour.
Model-assisted characterization of engineered S. coelicolor M1152 and its responses to phosphate depletion
As detailed above, EcSco-GEM shed a new light on the metabolic switch in secondary metabolite producing strain M145. S. coelicolor M1152 (13) is a M145 derivative devoid of the four major BGCs and bearing a point mutation in the rpoB gene. A better systemic understanding of M1152 metabolism would benefit to its further development as a performing host. To do so, a comparative analysis of gene expression levels and metabolic fluxes was carried out in the strains M145 and M1152.
Batch cultivations of M1152 were performed using identical conditions and comparable sampling regimes as for M145 reported above. This enabled a direct comparison of the two strains at a systems level, revealing both expected and unexpected effects of the strains’ genetic differences (Figure 3). As anticipated, the products of the Cpk, CDA, Red, and Act biosynthetic pathways were undetectable in M1152 (Figure 3A). As previously observed (13), the growth rate of M1152 is reduced compared to M145 (0.15 h−1 vs 0.21 h−1 in the initial exponential growth phase), delaying phosphate depletion by M1152 to 47 hours after inoculation (Figure 3A).

Compounds produced (A) and consumed (B) during batch fermentation of S. coelicolor M1152. Time points for sampling for transcriptome and proteome analysis are indicated with red triangles. The dashed vertical line indicates when phosphate in the medium has been depleted. Error bars are standard deviations of three biological replicates. CDW, Cell Dry Weight; Red, undecylprodigiosin; TBP, Total Blue Pigments/actinorhodins; CO2, volume corrected respiration; D-Glc, D-glucose; L-Glu, L-glutamate; PO4, phosphate. C) Alignment of sample time points of M145 and M1152 cultivations based on the expression profiles of genes that were earlier found to respond to phosphate depletion in respect to the metabolic switch (8). D) Clustered heatmap of proteomics data for M145 (triangles) and M1152 (circles), for each time-point and culture. The first principal component separates the time points, while the second principal component separates the two strains. E) CO2-normalized Z-scores of pathway fluxes predicted by EcSco-GEM for 10 of the most varying pathways in M145 and M1152. The data for M145 (Figure 2D) and M1152 are standardized together to make values and colours comparable. E) Principle component analysis of the proteomics data for M145 (triangles) and M1152 (circles), for each time-point and culture. The first principal component separates the time points while the second principal component separates the two strains.
The sampling time points for proteome and transcriptome were adjusted accordingly (Figure 3B), enabling pairwise comparison of measurements between the two strains. Genes responsive to phosphate depletion, members of the PhoP regulon (8), were used to align the different sample datasets for M145 or M1152 (Figure 3C). Interestingly, most of the responses of M145 to phosphate depletion were retained in M1152 (Figure 3D). Principle component analysis of the proteome data confirms high consistency between corresponding biological replicates and incremental changes between sample points for both M145 and M1152 (mainly explained by PC1: 18.6% variance, Figure 3E). A clear strain dependent clustering of the data (PC2: 15.5% variance) indicates global significant differences at the protein level. EcSco-GEM was subsequently used to predict metabolic changes in M1152 (Figure 3E).
The different glutamate and glucose consumption rates of M145 and M1152 (Figure 4A and 4B) resulted in substantial metabolic differences between the two strains prior to phosphate depletion. During cultivation on SSBM-P medium, where glutamate is the sole nitrogen source, glucose and glutamate are co-consumed. M1152, as M1146 (74), has a reduced specific glucose uptake rate compared to M145. It thus obtains a larger share of its carbon from glutamate (Figure 4A and 4B) and has consequently also a higher nitrogen availability than M145. A reduced flux through glycolysis has also been reported previously for strain M1146 (78). This might be an effect of the predicted increased concentration of ATP in M1146 compared to M145, which inhibits glucose uptake and phosphofructokinase (74, 78). Since Act was proposed to act as an electron acceptor reducing the efficiency of the oxidative phosphorylation, it is suggested that the lack of Act in M1146 causes the elevated ATP levels (74). However, we find the largest difference in glycolytic flux at early time points, prior to phosphate depletion and Act production in M145, proving that Act itself cannot explain this observation.

A) The ratio between estimated uptake rates of glucose and glutamate showing that M1152 acquires a smaller part of its carbon from glucose compared to M145. B) Roughly half of the nitrogen from glutamate is excreted as ammonium (both strains), while higher uptake of glucose in M145 leads to more excretion of acetate. C) Comparison of predicted fluxes for the second sampling time points for M145 and M1152, i.e. after 29 and 41 hours, respectively. The second time point for each strain was chosen because the estimated uptake rates are more reliable than the first time point. The strength of the colour of the lines correspond to the flux difference between the strains; green reactions have higher flux in M1152, and red reactions have higher flux in M145. Note the reduced biomass-specific uptake rate of glucose and increased oxidative stress in M1152.
The EcSco-GEM predicts the consequences of the reduced glucose uptake of M1152 on its central carbon metabolism (Figure 4C). A less active glycolysis in M1152 than in M145 leads to a lower carbon flow towards acetyl-CoA and thus lower excretion of acetate compared to M145 (Figure 4B). Furthermore, EcSco-GEM reveals an increased flux from glutamate to alpha-ketoglutarate. Indeed, a fraction of the pool of oxaloacetate might be converted into alpha-ketoglutarate by aspartate transaminase to feed the TCA cycle. The rest might be converted into phosphoenolpyruvate (PEP) by PEP carboxykinase for gluconeogenesis, since PEP carboxykinase was shown to carry higher fluxes in M1152 than in M145 (Figure 4C).
Since recent studies have demonstrated a reverse correlation between antibiotic and triacylglycerol biosynthesis in S. lividans and S. coelicolor (74, 79), one can speculate that the acetyl-CoA/malonyl-CoA units yielded by glycolysis for the biosynthesis of antibiotics in M145 are being used for enhanced growth and/or fatty acids and TAG biosynthesis in M1152. However, this is likely not the case, as M1152 has rather a reduced growth rate compared to M145, and fatty acid biosynthesis remains downregulated after the switch (Figure 5). It is noteworthy that the flux toward this acetyl-CoA/malonyl-CoA sink is still 3- to 6-fold larger than the total flux going into secondary metabolite biosynthesis. We thus propose that together with enhanced nitrogen availability, acetyl-CoA made available from the deletion of these BGCs is used to feed the TCA cycle to support the oxidative metabolism in M1152. This would generate oxidative stress whose toxic effects might be responsible for the growth delay of this strain.

From EcSco-GEM predictions, a reduced malonyl-CoA production (left panel) by both acetyl-CoA carboxylase (ACCOAT; blue) and acetyl-CoA carboxytransferase (ACCOAT_1; orange) is observed in both strains. Most of the malonyl-CoA is consumed by fatty acid biosynthesis through malonyl-CoA-ACP transacylase (MCOATA), even after metabolic switching, and this consumption balances the malonyl-CoA production. The other main sinks for malonylmalonyl-CoA are the pathways encoded by the 4 major BGCs (Act, Cpk, Red and CDA) in addition to biflaviolin synthase (THYDNAPS).
Transcriptome analysis reveal differential expression of global regulators
While the proteome data are an integral part of the EcSco-GEM models, RNA-seq data were used to both verify the trends and to gain further insights in the regulatory changes that are not captured by the metabolic models. As the proteomic data, the RNA-seq data showed large global differences between M1152 and M145, revealing 499 differentially expressed genes with a significance threshold of p<0.01.
Unsupervised clustering of the significantly changed genes reveal differences in regulatory systems related to redox regulation, signalling and secondary metabolism. The significantly changed genes were clustered into 7 groups with K-means clustering, with clusters 1-3 containing genes that are upregulated in M1152 compared to M145 and clusters 4-7 vice versa (Figure S6A and Data Set S1, Tab 5). A Gene Ontology (80, 81) enrichment analysis of the seven clusters was conducted to identify upregulated processes in each of the two strains (Figure S7, cf. Figure S6A).
The enriched processes upregulated in M1152 point to increased oxidative stress (Figure S7): antioxidant and peroxidase activity (SCO2633 [sodF]; SCO4834-35) in addition to biosynthesis of carotenoid (SCO0185–SCO0188), a known antioxidant (82, 83). The putative proteins within the cytochrome-P450 family (SCO7416–SCO7422) found in cluster 1 might also be linked to increased oxidative stress (84), but also to oxidation of precursors used for the synthesis of macrolides (85). Indeed, by comparing the time series expression levels for genes related to oxidative stress we observe that the majority of genes related to oxidative stress are upregulated in M1152 (Figure 6). These changes correlate to a more active oxidative metabolism and TCA cycle as predicted by Ec-ScoGEM (Figure 4).

Included are genes related to oxidative stress either present in Sco-GEM or within the 499 differentially expressed genes. A general upregulation in M1152 and the first time point of M145 is observed.
In cluster 2 we find scbA (SCO6266) and its downstream gene scbC (SCO6267), which stands out by being almost 6-fold upregulated in M1152. This high expression level is likely due to the deletion of scbR2 (SCO6286), the last gene selected to be part of the cpk BGC (86). Besides regulation of the cpk cluster, ScbR2 binds upstream of several global regulators of development and secondary metabolism, including AfsK, SigR, NagE2, AtrA, AdpA and ArgR (87). It also acts together with ScbR to regulate ScbA, which produces the y-butyrolactone SCB1. However, when looking at the genes regulated by ScbR (87), we only observe a clear difference in expression for genes regulated by AfsR (phosphorylated by AfsK) (88, 89), while this is not the case for genes regulated by ArgR, AdpA or ScbR itself (Figure S5C-F).
Amongst the genes upregulated in M145, in cluster 4 we find genes related to the redox regulated transcription factor SoxR (90), and a similar pattern is observed for the entire SoxR regulon (Figure S6B). SoxR is known to react directly to the presence of actinorhodin (91, 92), and indeed, in M145 this group of genes follows the production profile of actinorhodin, while their expression remains low in M1152 since Act is not produced. The benzoquinone Act, as electron acceptor, is thought to reduce respiration efficiency and thus energy charge as well as to combat oxidative stress (74). Consistently, the RNA-seq data revealed that the ATP-synthase gene cluster (SCO5366–SCO5374) was upregulated almost 2-fold in M1152 compared to M145, most prominently in the stationary phase during Act production (Figure S6C). This agrees with observations in the M1146 strain (78). Cluster 4 also contains the genes directly up- and downstream of the deleted actinorhodin BGC in M1152 (SCO5071– SCO5072, encoding 3-hydroxyacyl-CoA dehydrogenase, and SCO5091–SCO5092, encoding a two-component flavin-dependent monooxygenase system) (93). In clusters 5, 6 and 7 we find genes with reduced expression in M1152, and the enriched processes are related to cellular and iron ion homeostasis, development, signalling and morphology. This corresponds to the delayed sporulation observed for M1152 (13).
Elevated expression of ribosomal proteins in M1152 after phosphate depletion
An increased transcription of genes encoding ribosomal proteins could be observed in M1152 after phosphate depletion (Figure S6D). The rpoB mutation of the RNA polymerase present in M1152 is thought to induce a conformational change mimicking the binding of guanosine tetraphosphate (ppGpp) to this enzyme (22). ppGpp is synthesized in response to nutritional stress and reduces the transcription of genes related to active growth, such as genes encoding ribosomal RNAs and ribosomal proteins (94), whereas it up-regulates those involved in development/differentiation and antibiotic production (95, 96). In consequence the up-regulation of ribosomal proteins was unexpected in M1152, especially since the expression of the ppGpp regulon was not found to be significantly changed in M1152 (Figure S5G and S5H). However, since high nucleoside triphosphate levels are known to have a positive impact on ribosome synthesis (97), we hypothesize that the higher ATP content of M1152 compared to M145, after phosphate depletion, may be responsible for the differences in expression of ribosomal proteins. Such difference in ribosomal protein expression is mainly seen in the antibiotic production phase and correlated with production of Act in M145, which has a negative impact on the energetic state of the cell (74).
Reduced production of the polyketide germicidin in M1152
It is usually thought that removal of sinks consuming valuable precursors improves the ability of a strain to produce heterologous metabolites requiring these precursors for their biosynthesis. It was therefore unexpected that the production rate (in ng ml-1 hour-1) of the polyketides germicidin A and B (98), autologous to both M145 and M1152, was reduced by 92% and 82% for germicidin A and B in M1152, respectively (Figure 7). This could be explained by the more active oxidative metabolism of M1152 compared to M145. In M1152 the pool of acetyl-CoA would thus be used to feed the TCA cycle rather than be used for germicidin biosynthesis.

The shaded regions display the uncertainty range (± 1 standard deviation) based on three replicate cultivations. Germicidin production rates after the metabolic switch (in ng ml-1 hour-1) are: 41.4 (A) and 75.5 (B) for M145; 30.2 (A) and 56.4 (B) for M1146; 3.3 (A) and 13.3 (B) for M1152. Note that the growth rate is different between the strains, displayed by the vertical lines representing phosphate depletion at 35, 38 and 47 hours for M145, M1146 and M1152, respectively.
To further understand the cause of the reduced production in M1152, we also measured the production of germicidin in the intermediate strain M1146 (Figure 7, Figure S6E), which does not feature the rpoB mutation but is missing the 4 BGCs also deleted in M1152 (13). The production rate of germicidin A and B in M1146 was found to be reduced by 27% and 25%, respectively, compared to M145. This demonstrates that, while the removal of BGCs may influence polyketide production, a strong reduction appears to be assignable to the rpoB mutation in M1152.
Discussion
In this work, we carried out a multi-omics study to compare the metabolic changes of Streptomyces coelicolor M145 and the BGC-deletion mutant M1152 during batch fermentation. The defined cultivation medium used in this work was chosen because it supports sufficient growth and a delayed, well-defined onset of secondary metabolism, necessary to study the metabolic switch (20). We aimed at defining the metabolic features differing between the two strains, both during exponential growth and stationary phase after phosphate depletion.
To achieve this from a systems biology perspective, we combined time-course sampled cultivation and transcriptome analysis with enzyme-constrained genome-scale models generated with proteome data. Such genome-scale models are extensively used to connect transcriptome- and proteome data to metabolic fluxes. Leveraging metabolic simulations to contextualize transcriptional changes is mainly impacted by the quality of the computational model used. Here, two teams joined efforts to improve a consensus model of S. coelicolor, yielding a comprehensive model useful for the scientific community.
Genome-scale models provide hypothesis for slow growth of M1152
The reduced growth rate of M1152 is correlated with reduced glucose uptake and enhanced glutamate uptake compared to M145. This is expected to lead to a less active glycolysis but a more active TCA cycle, and thus, a more active oxidative metabolism in M1152 compared to M145. An active oxidative metabolism is known to generate oxidative stress, and indeed, the in vivo data, as well as the genome-scale model, predict an increased oxidative stress in M1152. The toxicity of oxidative stress might, at least in part, be responsible for the growth delay of M1152, while the rpoB mutation may add to this phenotype, since one of the functions of the ppGpp-associated RNA polymerase is to promote a growth arrest in conditions of nutritional stress.
Further development may improve M1152 as host for heterologous expression
The strain M1152 has several advantages as a host for heterologous production of secondary metabolites. The deletion of the 4 major BGCs not only removes presumed competing sinks for valuable precursors, but also generates a clean background to ease the identification of novel products by mass spectrometry. M1152 was already proven to be more efficient than M145 and M1146 in heterologous production of the nitrogen-containing antibiotics chloramphenicol and congocidine, as well as Act production from reintroduction of its BGC (13). Strains M1146 and M1152 produce, respectively, 3- to 5-, and 20- to 40-fold more chloramphenicol and congocidine from respective heterologous clusters than M145.
Furthermore, in strain M1317, derived from M1152 by additional removal of three Type III PKS genes (16), the (re-)introduction of germicidin synthase gave a 10.7 and 7.8-fold increase in the total germicidin production by M1317 and M1152, respectively. This demonstrated that the rpoB mutation, earlier shown to have a positive impact on the biosynthesis of secondary metabolites (13), has a higher impact on the production of these compounds than the deletion of competing precursor sinks, even while it cannot be excluded that unintended and unknown genetic differences introduced during strain development are underlying some of the observed behaviours. Nonetheless, the comparative analysis of M145 and M1152 provides valuable insight to the impact of the rpoB mutation on cellular metabolism and its relationships with antibiotic production, while a dedicated, systematic comparative analysis of M1152, M1146 (13) and M145 will be necessary to in detail dissect the overlapping influences of BGC deletion and the rpoB mutation (99).
As earlier work has suggested a competition for common precursors (acetyl-CoA/malonyl-CoA) between fatty acids and secondary metabolites biosynthesis (100), it could be anticipated that the deletion of BGCs would have a positive effect on fatty acids, and thus TAG biosynthesis, but our data indicate that this is not the case (Figure 5).
Materials and Methods
Sco-GEM consensus model reconstruction and development
A brief description of the model reconstruction process is given in the following section, while all details are described in the Supplemental Information. and in the community model’s GitHub repository (https://github.com/SysBioChalmers/sco-GEM). The model is hosted on GitHub to facilitate further development by the community, and we’ve also created a channel on Gitter dedicated to Sco-GEM questions and discussions (https://gitter.im/SysBioChalmers/Sco-GEM).
Protocol for model merging
Using iKS1317 (15) as a starting point, additional reactions, metabolites and genes were added from Sco4 (37) and iAA1259 (35). These three models are all based on the preceding model iMK1208. To facilitate model comparison, modified or added reactions and metabolites in Sco4 and iAA1259 were mapped to the iKS1317 namespace by using reaction and metabolite database annotations, reaction equations and metabolite names and formulas. The full list of reactions and metabolites added or modified according to Sco4 and iAA1259 is given in Data Set S1, Tab 6 - 10.
The next step of the reconstruction process involved mainly manual curations: known flaws and missing gene annotations in iKS1317 and Sco4 were fixed; reactions and metabolites added from Sco4 were given IDs according to the BiGG namespace (56); all reactions, metabolites and genes were given SBO annotations (101) (Data Set S1, Tab 11); all possible reactions and metabolites were given MetaNetX (55) and chebi (54) (metabolites only) annotations; the extensive annotation of genes from iAA1259 were expanded to cover 1591 of the 1777 genes in Sco-GEM. We also created pseudo-metabolites for the redox cofactors NADH/NADPH and NAD+/NADP+ and introduced them into reactions where the cofactor usage is uncertain.
The biomass equation was curated with the following main improvements: 1) Adopting the curation of 2-demethylmenaquinol and menaquinol from iAA1259; 2) Separating the biomass reaction into the pseudometabolites lipid, protein, dna, rna, carbohydrate, cell wall and misc; 3) Updating the coefficients for prosthetic groups based on the proteomics data and information about prosthetic groups for individual proteins from UniProt. Additional details are given in the Supplemental Information.
Model reversibility
By using python-API (https://gitlab.com/elad.noor/equilibrator-api) of eQuilibrator (59) we calculated the change in Gibbs free energy for 770 reactions (Data Set S1, Tab 3). eQuilibrator can only calculate the change in Gibbs free energy for intracellular reactions (i.e. not transport and exchange reactions) where all metabolites are mapped to KEGG (51, 52). The calculations are based on the component contribution method (102). The change in Gibbs free energy was calculated at standard conditions (25 °C, 1 bar), pH7 and 1mM concentration of reactants, denoted ΔrG’m in eQuilibrator. This did not cover any transport or exchange reactions nor reactions with metabolites lacking KEGG annotation. We then applied a threshold of -30 kJ/mol to define a reaction as irreversible (103, 104). Using the set of growth data and knockout data, we evaluated the effect of these changes in reaction reversibility: by randomly applying these changes to 10 reactions at the time, we identified single, pair and triplets of reactions that reduced model accuracy when the reversibility was changed based on the change in Gibbs free energy (Data Set S1, Tab 12; Supplemental Information).
Analysis and annotation of transport reactions
Gene annotations, substrate and transport class information were mostly extracted from Transport DB 2.0 (105) and TCDB (106). Then, transport proteins were extracted from IUBMB-approved Transporter Classification (TC) System and categorized into 9 main classes (Figure 1F): 1) ABC transporter; 2) PTS transporter; 3) Proton symporter; 4) Sodium symporter; 5) Other symporter; 6) Proton antiport; 7) Other antiport; 8) Facilitated diffusion; 9) Simple diffusion. For those transport proteins with an ambiguous substrate annotation in TCDB, the specific substrate annotation was obtain by extracting annotations from KEGG (51, 52), UniProt (57) or through BLAST homology search (107) using a similarity threshold of 90% (Supplemental Information; Data Set S1, Tab 4).
Development of enzymatically constrained (EcSco-GEM) model
An enzyme-constrained version of the Sco-GEM model (denoted EcSco-GEM) was generated using GECKO (31). The GECKO method enhances an existing GEM by explicitly constraining the maximum flux through each reaction by the maximum capacity of the corresponding enzyme, given by the product of the enzyme abundance and catalytic coefficient. This is facilitated by splitting both, reactions catalysed by isoenzymes and reversible reactions. The Sco-GEM v1.1 model was modified using GECKO version 1.3.4. Kinetic data, in the form of kcat values (s-1), were automatically collected from BRENDA (108). If BRENDA did not report a kcat value for an enzyme, GECKO searched for alternative kcat values by reducing specificity, on the level of substrate, enzymatic activity (EC number) and organism. While 4178 out of 4753 queried enzyme activities could be matched to the full EC code, 306 of the matched activities reported in BRENDA were from S. coelicolor. Additionally, six kcat values were manually curated, and a thorough explanation and reasoning behind these modifications are given in the Supplemental Information. The NAD(H)/NAD(P)H pseudo-reactions were blocked to avoid infeasible loops.
Then, separate models were created for each strain (the gene clusters for actinorhodin, undecylprodigiosin, CDA and coelimycin P1 were removed to create M1152) and for each time point by using estimated growth, uptake rates of glutamate and glucose, secretion rates of undecylprodigiosin, germicidin A and B and proteome measurements (Supplemental Information). These time point specific models (9 time points for M145, 8 time points for M1152) were used to analyse the activity in individual metabolic pathways through random sampling (65). We also created one EcSco-GEM model for each strain with a global constraint on the protein usage instead of specific protein usage, which were used for model quality control.
Continuous integration and quality control with memote
Validation and quality assessment of Sco-GEM is carried out using the test-suite in memote (42). Memote provides by default a large range of tests, which we have used to identify issues and possible improvements. The test suite reports descriptive model statistics such as the number of genes, reactions and metabolites, and also checks the presence of SBO terms and annotations, the charge and mass balance of all reactions, the network topology and find energy-generating cycles (109). Additionally, we incorporated custom tests into the memote test-suite to automatically compare predicted phenotypes with experimental data in different growth media and for different knockout mutants. The experimental growth and knockout data are extracted from (15). Memote version 0.9.12 was used in this work, and the full memote report for Sco-GEM is given in the Supplemental Information. As a separate evaluation, we applied the method for identifying internal and unrealistic energy-generating cycles by (110), and no such cycles were found in Sco-GEM.
The simplest use of memote is generating snapshot reports showing the current state of the model. However, by integrating Travis CI [https://travis-ci.com/] into the gitHub repository, memote can be used to create a continuous report displaying how each commit affects the model quality.
Random sampling, normalization and pathway analysis
Because of the huge number of reactions in the EcSco-GEM, it is challenging to sample the solution space appropriately: we have chosen to use the method provided in the Raven Toolbox 2 (37, 65), which samples the vertices of the solution space. The drawback of this method is that it will not result in a uniform sampling of the solution space. However, it is more likely to span the entire solution space and also not prone to get stuck in extremely narrow parts of the solution space, which may happen with variants of the hit-and-run algorithm (111–113). For each of the time points for each strain (17 different conditions in total) we generated 5000 random flux distributions with Gurobi as the solver. The reactions catalysed by isoenzymes were combined into the set of reactions in Sco-GEM and the reactions providing protein for each reaction. The mean of the 5000 flux distributions for each metabolic reaction was used in the following analysis.
Finally, for each of the 17 conditions, the mean fluxes were normalized by the CO2 production rate. Then, the normalized mean fluxes were summarized for each metabolic pathway by using the curated pathway annotations, and we consider this a measure of the metabolic activity in each pathway.
Since glucose and glutamate uptake rates, as well as growth rates were significantly different in the two strains and at different time points, normalization of the data was necessary to compare flux distributions. We tested various proxies as indicators of overall metabolic activity for normalization, namely CO2 production; the total carbon uptake from glucose and glutamate; growth rate and mean flux value. As golden standard, we compared the fluxes through individual reactions that are well documented to change in M145 in response to the phosphate depletion (Figure S8). Normalization based on CO2 production was tested and gave similar results than the data normalized on total carbon uptake from glucose and glutamate (Figure S8A and S8B. The data normalized by the sum of fluxes showed similar patterns as those achieved by glucose/glutamate and CO2-normalized data but was noisier (Figure S8C). Considering the huge differences in growth rate, the growth-normalized data masked any other flux patterns (Figure S8D). The fact that different normalizations provided similar differences in metabolic fluxes proved that the inferred changes in metabolism were not artefacts of the normalization method but represent true metabolic activity of each strain.
Strains, cultivation conditions, sampling procedures, and analyses of media components and antibiotics box
Experiments were performed using strain M145 of S. coelicolor A3(2) and its derivatives M1146 and M1152. The latter two are lacking the 4 major BGCs for actinorhodin (Act), undecylprodigiosin (Red), coelimycin P1 (Cpk), and calcium-dependent antibiotic (CDA), while M1152 is also carrying the pleiotropic, previously described antibiotic production enhancing mutation rpoB [S433L] (13, 22). All strains were kindly provided by Mervyn Bibb at John-Innes-Centre, Norwich, UK.
Triplicate cultivations of the strains were performed based on germinated spore inoculum on 1.8 L phosphate-limited medium SSBM-P, applying all routines of the optimized submerged batch fermentation strategy for S. coelicolor established and described before (20). All media were based on ion-free water, and all chemicals used were of analytical grade. In brief, spore batches of M145, M1146 and M1152 were generated by cultivation on soy flour-mannitol (SFM) agar plates (114), harvesting by scraping off spores and suspension in 20% (v/v) glycerol, and storage in aliquots at −80 °C. 109 CFU of spores of each strain were germinated for 5 hours at 30 °C and 250 rpm in 250 mL baffled shake-flasks with 2 g of 3 mm glass beads and 50 mL 2x YT medium (115). The germinated spores were harvested by centrifugation (3200 × g, 15 °C, 5 min) and re-suspended in 5 mL ion-free water. An even dispersion of the germinated spores was achieved by vortex mixing (30 s), ensuring comparable inocula among biological replicas. Each bioreactor (1.8 liter starting volume culture medium in a 3-liter Applikon stirred tank reactor) was inoculated with 4.5 mL germinated spore suspension (corresponding to 9×10⁸ CFU). Phosphate-limited medium SSBM-P (8) consisted of Na-glutamate, 55.2 g/L; D-glucose, 40 g/L; MgSO4, 2.0 mM; phosphate, 4.6 mM; supplemented minimal medium trace element solution SMM-TE (115), 8 mL/L and TMS1, 5.6 mL/L. TMS1 consisted of FeSO4 × 7 H2O, 5 g/L; CuSO4 × 5 H2O, 390 mg/L; ZnSO4 × 7 H2O, 440 mg/L; MnSO4 × H2O, 150 mg/L; Na2MoO4 × 2 H2O, 10 mg/L; CoCl2 × 6 H2O, 20 mg/L, and HCl, 50 mL/L. Clerol FBA 622 fermentation defoamer (Diamond Shamrock Scandinavia) was added to the growth medium before inoculation. Throughout fermentations, pH 7.0 was maintained constant by automatic addition of 2 M HCl. Dissolved oxygen levels were maintained at a minimum of 50% by automatic adjustment of the stirrer speed (minimal agitation 325 rpm). The aeration rate was constant 0.5 L/(L × min) sterile air. Dissolved oxygen, agitation speed and carbon dioxide evolution rate were measured and logged on-line, while samples for the determination of cell dry weight, levels of growth medium components and secondary metabolites concentrations, as well as for transcriptome and proteome analysis were withdrawn throughout the fermentation trials as indicated in Figure 2B. For transcriptome analysis, 3 × 4 ml culture sample were applied in parallel onto three 0.45 μm nitrocellulose filters (Millipore) connected to vacuum. The biomass on each filter was immediately washed twice with 4 ml double-autoclaved ion-free water pre-heated to 30 °C, before the filters were collected in a 50 ml plastic tube, frozen in liquid nitrogen and stored at -80 °C until RNA isolation. For proteome analysis, 5 ml samples were taken and centrifuged (3200 × g, 5 min, 4 °C), and the resulting cell pellets frozen rapidly at -80 °C until further processing.
Levels of phosphate were measured spectrophotometrically by using the SpectroQuant Phosphate test kit (Merck KGaA, Darmstadt, Germany) following the manufacturer’s instructions after downscaling to 96-well plate format. D-glucose and L-glutamate concentrations were determined by LC-MS using suitable standards, and measured concentrations were used to estimate specific uptake and excretion rates.
Undecylprodigiosin (Red) levels were determined spectrophotometrically at 530 nm after acidified methanol extraction from the mycelium (116). To determine relative amounts of actinorhodins (determined as total blue pigments, TBP), cell culture samples were treated with KOH (final concentration 1 M) and centrifuged, and the absorbance of the supernatants at 640 nm was determined (116). Quantification of germicidin A and B was performed using targeted LC-MS analytics.
Proteomics
Sample preparation and NanoUPLC-MS analysis
Quantitative proteomics were performed using pipeline previously described (117). Mycelium pellets for proteome analysis were thawed and resuspended in the remaining liquid. 50 μL re-suspended mycelium was withdrawn and pelleted by centrifugation. 100 μL lysis buffer (4% SDS, 100 mM Tris-HCl pH 7.6, 50 mM EDTA) was added, and samples were sonicated in a water bath sonicator (Biorupter Plus, Diagenode) for 5 cycles of 30 s high power and 30 s off in ice water. Cell debris was pelleted and removed by centrifugation. Total protein was precipitated using the chloroform-methanol method described before (118). The pellet was dried in a vacuum centrifuge before dissolving in 0.1% RapiGest SF surfactant (Waters) at 95 °C. The protein concentration was measured at this stage using BCA method. Protein samples were then reduced by adding 5 mM DTT, followed by alkylation using 21.6 mM iodoacetamide. Then trypsin (recombinant, proteomics grade, Roche) was added at 0.1 μg per 10 μg protein. Samples were digested at 37 °C overnight. After digestion, trifluoroacetic acid was added to 0.5% followed by incubation at 37 °C for 30 min and centrifugation to remove MS interfering part of RapiGest SF. Peptide solution containing 8 μg peptide was then cleaned and desalted using STAGE-Tipping technique (119). Final peptide concentration was adjusted to 40 ng/μL using sample solution (3% acetonitrile, 0.5% formic acid) for analysis.
200 ng (5 μL) digested peptide was injected and analysed by reversed-phase liquid chromatography on a nanoAcquity UPLC system (Waters) equipped with HSS-T3 C18 1.8 μm, 75 µm × 250 mm column (Waters). A gradient from 1% to 40% acetonitrile in 110 min (ending with a brief regeneration step to 90% for 3 min) was applied. [Glu1]-fibrinopeptide B was used as lock mass compound and sampled every 30 s. Online MS/MS analysis was done using Synapt G2-Si HDMS mass spectrometer (Waters) with an UDMSE method set up as described in (120).
Data processing and label-free quantification
Raw data from all samples were first analysed using the vender software ProteinLynx Global SERVER (PLGS) version 3.0.3. Generally, mass spectrum data were generated using an MSE processing parameter with charge 2 lock mass 785.8426, and default energy thresholds. For protein identification, default workflow parameters except an additional acetyl in N-terminal variable modification were used. Reference protein database was downloaded from GenBank with the accession number NC_003888.3. The resulted dataset was imported to ISOQuant version 1.8 (120) for label-free quantification. Default high identification parameters were used in the quantification process. TOP3 result was converted to PPM (protein weight) and send to the modelers and others involved in interpreting the data (Data Set S1, Tab 13).
TOP3 quantification was filtered to remove identifications meet these two criteria: 1. identified in lower than 70% of samples of each strain and 2. sum of TOP3 value less than 1 × 10⁵. Cleaned quantification data was further subjected to DESeq2 package version 1.22.2 (29) and PCA was conducted after variance stabilizing transformation (vst) of normalized data.
Transcriptomics
RNA extraction and quality control
Bacteria were lysed using RNAprotect Bacteria (Qiagen) and following the manufactureŕs instruction. Briefly, filters containing bacteria were incubated with 4 ml of RNAprotect Bacteria reagent. After centrifugation, resulting samples were lysed using 500 µl of TE buffer (10 mM Tris·Cl, 1 mM EDTA, pH 8.0) containing 15 mg/ml lysozyme using 150-600 µm diameter glass beads (Sigma) agitated at 30 Hz for 5 minutes in the TissueLyser II (Qiagen).
Total RNA was extracted using RNeasy mini kit (Qiagen) and 700 µl of the resulting lysate complemented with 470 µl of absolute ethanol. RNAase-free DNase set (Qiagen) and centrifugation steps were performed to prevent DNA and ethanol contamination. Elution was performed using 30 µl of RNase-free water and by reloading the eluate on the column to improve the RNA yield. The RNA concentration was measured using Qubit RNA BR Assay Kit (ThermoFisher Scientific), RNA purity was assessed using A260/A280 and A260/A230 ratio using the Nano Drop ND-1000 Spectrophotometer (PEQLAB). RNA Integrity Number was estimated using RNA 6000 Nano Kit (Agilent) and the Bioanalyzer 2100 (Agilent).
Library preparation and sequencing
A total of 1 µg of total RNA was subjected to rRNA depletion using Ribo-Zero rRNA Removal Kit Bacteria (Illumina). The cDNA libraries were constructed using the resulting tRNA and the NEBNext Ultra II Directional RNA Library Prep Kit (NEB). Libraries were sequenced as single-reads (75 bp read length) on an Illumina NextSeq500 platform at a depth of 8–10 million reads each.
RNA-seq data assessment and analysis
Sequencing statistics including the quality per base and adapter content assessment of resulting transcriptome sequencing data were conducted with FastQC v0.11.5 (121). All reads mappings were performed against the reference strain of Streptomyces coelicolor A3(2) (RefSeq ID NC_003888.3). The mappings of all samples were conducted with HISAT2 v2.1.0 (122). As parameters, spliced alignment of reads was disabled, and strand-specific information was set to reverse complemented (HISAT2 parameter --no-spliced-alignment and --rna-strandness “R”). The resulting mapping files in SAM format were converted to BAM format using SAMtools v1.6 (123). Mapping statistics, including strand specificity estimation, percentage of mapped reads and fraction exonic region coverage, were conducted with the RNA-seq module of QualiMap2 v2.2.2-dev (124). Gene counts for all samples were computed with featureCounts v1.6.0 (28) based on the annotation of the respective reference genome, where the selected feature type was set to transcript records (featureCounts parameter -t transcript).
Normalization and differential gene expression
Raw count files were imported into Mayday SeaSight (125) for common, time-series-wide normalization. For this, the raw counts of all biological replicates of one strain across the time-series were log2-transformed (with pseudocount of +1 for the genes with zero counts) and then quantile-normalized. To make the two normalized time-series data of M154 and M1152 comparable, they were again quantile-normalized against each other. The normalized RNA-seq data are provided in Data Set S1, Tab 14.
Differentially expressed genes were identified by ANOVA using Orange (v3.2) and the bioinformatic toolkit (v), with FDR of <0.01 and a minimal fold enrichment >1 for at least one aligned time point. Genes with low expression (log2 < 5 for both strains and time points) were not considered for further analysis. The differentially expressed genes were subsequently scaled to the expression average and clustered by K-means. Visualization of genes and clusters were performed in python (v3.7) with matplotlib (v3.1.1). For this, the time-series of M145 and M1152 were aligned such that in the visual representation, the expression profiles of the two strains are aligned relative to the time point of phosphate depletion. Both DAVID (126, 127) and the string database (128) was used to evaluate the function of each cluster, identifying overrepresentation of function groups based on GO annotation or text mining. Identified differential clusters or regulons were extracted from literature and plotted (Data Set S1, Tab 5; Figure S7).
Data and Software Availability
Model repository
The model is hosted and developed in an open repository on GitHub: https://github.com/SysBioChalmers/Sco-GEM. Here, the latest version of the Sco-GEM is available in both YAML and SBML level 3 Version 1. Additionally, users can see all details of the model reconstruction and contribute to further model development by posting issues or suggest changes. This should encourage further, incremental development of Sco-GEM by the community.
Proteome data
The proteomics data have been deposited to the ProteomeXchange Consortium via the PRIDE (129) partner repository with the dataset identifier PXD013178 and 10.6019/PXD013178. Normalized proteome data is also available in Data Set S1, Tab 13.
Transcriptomics data
All high-throughput sequencing data have been deposited in NCBI’s Gene Expression Omnibus and are accessible under accession number GSE132487 (M145) and GSE132488 (M1152). Normalized counts are also found in Data Set S1, Tab 14.
Author contributions
Conceptualization, E.K., E.A., A.W., S.S., A.S.Y. and T.K. Methodology and software, E.K., S.S., A.S.Y. and T.K. Validation and formal analysis, C.D., K.N., D.V.D., S.S., T.K., E.K. Investigation, T.K., A.W., S.S., E.K. Data curation, S.S., T.K. Writing - original draft, S.S., T.K., D.V.D., C.D., K.N. Writing – review & editing, all authors. Visualization, S.S., E.K., C.D., D.V.D. Supervision, A.W., E.A., E.K., G.W. Project administration, A.W. Funding acquisition: A.W., E.K., E.A., G.W.
Supplemental Figures
Figure S1: Reaction subsystems and origin. The number of reactions in Sco-GEM in each of the 15 subsystems, and from which model they originate from. The other reactions (orange) are added during reconstruction of Sco-GEM.
Figure S2: Gene clusters associated with metabolic switch. RNA-seq (left column) and proteomics (right column) from M145 of the 8 gene clusters associated with the metabolic switch as previously identified (8). The 8 clusters are: A) genes related to ribosomal proteins; B) genes related to nitrogen metabolism; C) Cpk gene cluster; D) genes related to development; E) genes upregulated in response to phosphate depletion; F) genes involved in synthesis of phosphate-free polymers; G) Act gene cluster; H) Red gene cluster
Figure S3: Log-transformed expression levels of genes related to nitrogen metabolism. The glutamate import (SCO5774-5777), the glutamate sensing system gluR-gluK (SCO5778 and SCO57779), glnR (SCO4159) and glnA (SCO2198) are downregulated subsequent to phosphate depletion. We also observe that the first time point in M145 is very different from all other samples.
Figure S4: Clustered heatmaps of Z-score based on CO2-normalized sum of fluxes of all pathways standardized within each pathway and separated into different subsystems / parts of the metabolism. A) Central carbon metabolism. B) Amino acid metabolism. C) Metabolism of vitamins and cofactors. D) Pathways of Biosynthetic gene clusters. E) Lipid metabolism. F) Oxidative stress. G) Degradation of toxic compounds. H) All other pathways. For all panels only pathway with a minimum flux of 1e-8 mmol (g DW)-1 h-1 were included.
Figure S5: RNA-seq, proteome and flux prediction of specific gene clusters and reactions. A) EcSco-GEM predicts that the flux through citrate synthase (CS) and isocitrate dehydrogenase (ICDHyr) increases at later time points in M145, effectively increasing the shuttling of acetyl-CoA into the TCA cycle. B) Log2 normalized expression data of genes involved in oxidative phosphorylation indicate an increasing expression at later time points, while overall expression in M1152 is higher than in M145. C-H) Comparison of log2 normalized expression data as calculated with (log2 M145)-log2(M1152), where positive values indicate upregulation in M145 relative to M1152, and vice versa for negative values. C) Increased expression of genes of the afsR regulon in M145, while no significant difference in expression is observed for (D) scbR regulon; (E) adpA regulon; (F) argR regulon; (G) genes induced by ppGPP; and (H) genes repressed by ppGpp.
Figure S6: Analysis of transcriptome data of genes. A) Unsupervised clustering (k-means) of significantly changed genes into 7 clusters: the first three (clusters 1-3) are upregulated in M1152, while the last four (clusters 4-7) are upregulated from the beginning or at later time points in M145. B-D) Comparison of log2 normalized expression data as calculated with (log2 M145)-log2(M1152), where positive values indicate upregulation in M145 relative to M1152, and vice versa for negative values. B) Genes in the SoxR regulon are reducing expression in M1152 at later time points. C) Almost all genes in the ATP-synthase cluster are up-regulated in M1152 after the first time point. D) Also, the transcription of ribosomal protein genes after the metabolic switch is increased in M1152 compared to M145. E) Batch cultivation of S. coelicolor M1146. Error bars are standard deviations of three biological replicates. CDW, Cell Dry Weight; CO2 volume corrected respiration; PO4, phosphate.
Figure S7: Gene Ontology enrichment analysis of the 7 clusters identified in the 499 differentially expressed genes, categorized by function into four clustered heatmaps.
Each heatmap shows the p-value for the enrichment of each GO-process. A) Genes related to reactive oxygen species, the ribosome or development process and cell wall formation. B) Oxireductase and iron / metal ion homeostasis. C) Regulation, biosynthesis and metabolism related to RNA and DNA. D) All other GO-annotations. E) This color palette is the legend for the column colors on top of each heatmap which displays which of the seven clusters each gene belongs to. The red palette covers cluster 1-3 (upregulated in M1152), while the blue palette covers cluster 4-7 (upregulated in M145). Note that no GO-processes were enriched for the genes in cluster 2.
Figure S8: Comparison of normalization methods of randomly sampled fluxes. Heatmap showing mean flux values normalized by A) total carbon uptake from glucose and glutamate, B) CO2 production, C) sum of all fluxes and D) growth rate. Because the mean flux values in these reactions are different by several orders of magnitude, we display the data as standardized values (for each reaction).
Other Supplemental material
Supplemental Information: The Memote report of Sco-GEM, the protocols for Sco-GEM and EcSco-GEM development and a detailed description of estimation of rates from batch fermentation data.
Data Set S1
Tab 1: Detailed overview of the script performing the reconstruction of Sco-GEM.
Tab 2: Comparison of the new biomass reaction in Sco-GEM with the biomass reaction in iAA1259.
Tab 3: Reversibility prior update, calculated change in Gibbs free energy and standard deviation of the calculated change in Gibbs free energy of 770 reactions in Sco-GEM.
Tab 4: Overview of all transport reactions added or curated during the process of Sco-GEM model development, and the metabolites added along with the new transport reactions.
Tab 5: Genes present in the 7 clusters identified with K-Means clustering of the differentially expressed genes.
Tab 6: Sco4 ID, name and Sco-GEM ID of the reactions added from Sco4 to Sco-GEM.
Tab 7: Sco4 ID, name and Sco-GEM ID of the metabolites added from Sco4 to Sco-GEM
Tab 8: Reaction ID, name and gene annotation of reactions added from iAA1259 to Sco-GEM.
Tab 9: List of reactions modified according to iAA1259.
Tab 10: Metabolite ID and name of metabolites added from Sco4 to Sco-GEM.
Tab 11: List of SBO terms used in Sco-GEM
Tab 12: Single, pair and triplets of reactions which reduced model accuracy, in total 56 different reactions. The reversibility of these reactions was not changed according to the predicted change in Gibbs free energy.
Tab 13: Normalized proteome data for M145 and M1152.
Tab 14: Normalized RNA-seq data for all six fermenters. M145 is cultivated in F516-F518, while M1152 is cultivated in F519, F521, F522. Re-index IDs corresponds to sampling time point (1–9) and strain.
Tab 15: List of genes within each cluster known to be associated with the metabolic switch.
Acknowledgements
The authors would like to acknowledge Bogdan I. Florea of Leiden University, Leiden, Netherlands, for running and monitoring the proteome measurements, and the bio-organic synthesis group at Leiden University for providing the opportunity to use their instrumentation. The authors would also like to acknowledge co-workers at SINTEF Industry, Trondheim, Norway: Ingemar Nærdal, Anna Lewin and Kari Hjelen for running the batch fermentations and Anna Nordborg, Janne Beate Øiaas and Tone Haugen for performing offline analyses and the germicidin analytics. The RNA-Seq sequencing was carried out by c.ATG, Tübingen, Germany.
This study was conducted in the frame of ERA-net for Applied Systems Biology (ERA-SysAPP) project SYSTERACT and the project INBioPharm of the Centre for Digital Live Norway (Research Council of Norway grant no. 248885), with additional support of SINTEF internal funding. The authors declare no conflict of interest.
Footnotes
References
- 1.↵
- 2.↵
- 3.↵
- 4.
- 5.
- 6.↵
- 7.↵
- 8.↵
- 9.↵
- 10.↵
- 11.↵
- 12.↵
- 13.↵
- 14.
- 15.↵
- 16.↵
- 17.↵
- 18.↵
- 19.↵
- 20.↵
- 21.
- 22.↵
- 23.↵
- 24.
- 25.↵
- 26.↵
- 27.
- 28.↵
- 29.↵
- 30.↵
- 31.↵
- 32.↵
- 33.↵
- 34.↵
- 35.↵
- 36.
- 37.↵
- 38.↵
- 39.↵
- 40.↵
- 41.↵
- 42.↵
- 43.↵
- 44.↵
- 45.
- 46.
- 47.
- 48.
- 49.↵
- 50.↵
- 51.↵
- 52.↵
- 53.↵
- 54.↵
- 55.↵
- 56.↵
- 57.↵
- 58.↵
- 59.↵
- 60.↵
- 61.↵
- 62.↵
- 63.↵
- 64.↵
- 65.↵
- 66.↵
- 67.
- 68.↵
- 69.↵
- 70.↵
- 71.↵
- 72.↵
- 73.↵
- 74.↵
- 75.↵
- 76.↵
- 77.↵
- 78.↵
- 79.↵
- 80.↵
- 81.↵
- 82.↵
- 83.↵
- 84.↵
- 85.↵
- 86.↵
- 87.↵
- 88.↵
- 89.↵
- 90.↵
- 91.↵
- 92.↵
- 93.↵
- 94.↵
- 95.↵
- 96.↵
- 97.↵
- 98.↵
- 99.↵
- 100.↵
- 101.↵
- 102.↵
- 103.↵
- 104.↵
- 105.↵
- 106.↵
- 107.↵
- 108.↵
- 109.↵
- 110.↵
- 111.↵
- 112.
- 113.↵
- 114.↵
- 115.↵
- 116.↵
- 117.↵
- 118.↵
- 119.↵
- 120.↵
- 121.↵
- 122.↵
- 123.↵
- 124.↵
- 125.↵
- 126.↵
- 127.↵
- 128.↵
- 129.↵


