

Abstract
Graphene oxide (GO) holds great potential for biomedical applications, however fundamental understanding of the way it interacts with biological systems is still lacking even though it is a prerequisite for successful clinical translation. In this study, we exploited intrinsic fluorescent properties of GO to establish the relationship between lateral dimensions of the material, its cellular uptake mechanism and intracellular fate. Label-free GO with distinct lateral dimensions, small (s-GO) and ultra-small (us-GO), was synthesized and thoroughly characterised both in water and in biologically relevant cell culture medium. Interactions of the material with a range of non-phagocytic mammalian cell lines (BEAS-2B, NIH/3T3, HaCaT, 293T) were studied using a combination of complementary analytical techniques (confocal microscopy, flow cytometry and TEM). The uptake mechanism was interrogated using a range of pharmaceutical inhibitors for main endocytic pathways (ethyl-isopropyl amiloride, monodansylcadaverine, chlorpromazine, genistein, cytochalasin D, latrunculin A, dynasore and sodium azide), and validated using negatively charged polystyrene beads with different diameters (0.1 and 1 μm). Regardless of lateral dimension, both types of GO were found to interact with the plasma membrane and to be efficiently taken up by a panel of cell lines in a time- and dose-dependent manner. s-GO was internalised mainly via macropinocytosis while us-GO used mainly clathrin- and caveolae-mediated endocytosis. Lastly, we show that both s-GO and us-GO terminate in lysosomal compartments for up to 48 h. Our results aim to offer significant insight into the mechanism of interaction of GO with non-phagocytic cell lines that can be exploited for the design of biomedically applicable 2D transport systems.
Introduction
Graphene oxide (GO), the oxidized form of graphene, has been one of the most researched 2-dimensional (2D) materials in nanomedicine due to its advantageous intrinsic properties1–3. For example, GO has a large surface-areatovolume ratio allowing high capacity for loading of cargos via both covalent and non-covalent interactions, while the different (carboxyl, epoxy and hydroxyl) functional groups offer chemical routes/anchor sites for further functionalization. Most importantly, GO is considered as an amphiphilic material that contains hydrophobic carbon basal plane and hydrophilic oxygen-rich functional groups. This favours cellular attachment and proliferation, but also provides good dispersibility in aqueous environment4–6. Some of the most promising applications of GO include the development of biosensors, drug delivery platforms, bio-imaging agents and photodynamic/photothermic therapeutic agents6–11.
Even though there is a significant number of publications proposing potential applications of GO in nanomedicine, answers to some of the fundamental questions such as how does GO interacts with the cells and which properties of GO drive its uptake remained elusive. This is relevant since the difference in the uptake mechanism can affect the distribution and intracellular fate of the material, which in return affects its biological activity. Understanding the cellular interactions with GO is fundamental for the design of efficient drug/gene delivery systems using the materials. For instance, in drug delivery, cellular uptake of the drug can be enhanced by exploiting receptor-mediated uptake pathways12. In gene therapy, which commonly targets cell nucleus/cytoplasm, it is important to avoid lysosomal compartments where enzymatic degradation takes place13. The fact that some uptake mechanisms are more prone to degradation than the others, in order to direct the cargos towards desired subcellular compartments, it is crucial to know the uptake mechanism of the cargos. For example, cargos internalised via phagocytosis will fuse directly with the lysosome for degradation, whereas cargos internalised via caveolae-mediated endocytosis will be sent from one endocytic compartment to another, eventually reaching the lysosome, the trans-Golgi network or the other side of the cell via transcytosis14. Moreover, questions concerning the toxicological profile of GO cannot be fully answered without knowing if the material can be taken up by the cells: plasma membrane disruption and/or internalization of the material might be the mechanisms leading to adverse effects on the cellular level.
Previous in-vitro studies focused on understanding the relationship between intrinsic properties of GO and its cellular internalisation. An extensive collection of studies demonstrated that GO can be chemically modified to enhance or reduce its internalization in specific cell lines9, 15–20. Currently, confocal laser scanning microscopy (CLSM) or fluorescence microscopy have been used as primary tools for assessing cellular interactions with GO. However, the attachment of the fluorescent label to GO through covalent or non-covalent interaction is required, and this might alter the intrinsic properties of the material. Furthermore, the inherent differences in the starting material, chemical modifications and experimental conditions used, have made it difficult to draw general conclusions about the interactions of GO with cells. Some research groups have recognized the vital need for investigations using label-free and non-functionalised GO to better understand the fundamental interactions between cells and GO, where analytical technique such as transmission electron microscopy (TEM) or flow cytometry were mainly used 21–28. Although fluorescent labelling of GO is avoided, thus preventing potential misinterpretation of the results due to detachment of the fluorescent marker, TEM is a low-throughput technique while flow cytometry alone does not allow to distinguish between adsorbed and internalized GO. In this regard, a more systematic investigation of how GO interacts with cells, employing a combination of complementary analytical techniques with a thorough characterization of the material is urgently needed.
Size of the material is one of the most important parameters which will determine the way that material interacts with cells29, 30. Previous research showed that GO with different sizes was taken up via different uptake mechanisms31–33. However, owing to differences in physico-chemical properties of the materials and treatment conditions used, it is still not clearly understood to which extent does the size of GO affect the uptake mechanism. Therefore, we hypothesize that GO can be efficiently taken up by a range of non-phagocytic cell lines and different flake sizes will be taken up via different uptake mechanisms. Our aim was to provide a systematic investigation of the dynamic interactions of GO with the cells, focusing on the uptake mechanism and intracellular fate of small GO (s-GO, average lateral size of 477 ± 270.4 nm) and ultra-small GO (us-GO, average lateral size of 124.8 ±69.8 nm) in a panel of cell lines.
Four mammalian, non-phagocytic cell lines were selected in this study: human epithelial lung cell line (BEAS-2B), human epithelial skin cell line (HaCaT), human epithelial embryonic kidney cell line (293T) and mouse fibroblast embryonic cell line (NIH/3T3). BEAS-2B cells were used as the primary cell model as the material can easily come in contact with the lung following its inhalation34. It is also worth noting that a growing body of evidence suggests penetration of inhaled nanoparticles from the lung epithelium into the blood vessel by crossing the air-blood barrier, which has been confirmed to correlate with cardiovascular diseases35. From the health and safety aspect, BEAS-2B is also an ideal model for studying the uptake mechanism of GO. Through this study, we will investigate whether GO is internalized via uptake mechanisms which can lead to the translocation of the material (e.g. caveolae-mediated endocytosis).
Herein, we applied the methodology established in our previous work34, allowing real-time observation of the interactions of label-free GO at a single-cell level. We used thoroughly characterized materials differing only in their lateral dimension, a combination of quantitative and qualitative analytical techniques (CLSM, flow cytometry and TEM) to assess the uptake of GO, pharmaceutical inhibitors and polystyrene microspheres to reveal and validate the uptake mechanism of GO and lastly live-cell time-lapse imaging to question the intracellular fate of GO.
Result and Discussion
Preparation and characterisation of GO
We used GO with two distinct lateral dimensions: s-GO and us-GO, both synthesized following the experimental protocol previously described by Rodrigues et al.4. The two graphene oxide materials were thoroughly characterised using a range of techniques (Table 1).
Physico-chemical characterization of s-GO and us-GO used in this study.
* The lateral dimension range was reported as the smallest and highest flake size measured by AFM and TEM. ELS = electrophoretic light scattering, TGA = thermogravimetric analysis, XPS = X-ray photoelectron spectroscopy, AFM = Atomic force microscopy, TEM = Transmission electron microscopy, A230 = Absorbance at 230 nm, E595 = Emission at 595 nm, CGO = Graphene oxide concentration.
Optical properties of both GO suspensions were evaluated by UV-vis and fluorescence spectroscopy. Both s-GO and us-GO were found to display an intense UV-vis absorbance peak at 230 nm, while an emission band located at 595 nm dominated their fluorescence spectra. The intrinsic fluorescent properties of GO were investigated further using fluorescence spectroscopy: s-GO exhibited a higher intensity of auto-fluorescence than us-GO (Figure S1). This is in agreement with our previous finding that auto-fluorescence of GO positively correlates with lateral dimensions of the flakes, i.e. larger GO displays stronger auto-fluorescence comparing to the smaller GO34.

Spectrofluorometric analysis of the emission spectra of s-GO and us-GO dispersed in water (2 mg/mL) using an excitation wavelength of 525 nm. This result shows that s-GO has a higher intensity of intrinsic fluorescence comparing to us-GO.
Structural characterisation of GO was analysed by Raman spectroscopy, showing the presence of defects in the sp2 backbone (ID/IG = 1.2) due to incorporation of oxygen functional groups during the synthesis. These oxygen species were responsible for the good colloidal stability of the material, as also reflected by the Zeta potential values below −30 mV. Surface chemical characterisation was analysed by X-ray photoelectron spectroscopy (XPS). Elemental analyses show a very low degree of impurities (≤ 1%) after the oxidation treatment and approximately 30% oxygen content, as indicated by carbon to oxygen (C:O) ratios of 2.2 and 2.4 for s-GO and us-GO, respectively. In addition, both s-GO and us-GO present similar percentages of oxygen functional groups obtained from the deconvolution of their C1s XPS spectra.
Finally, the difference in lateral dimensions between s-GO and us-GO was a result of different sonication times applied to the starting GO dispersions. Interestingly, the lateral size distribution measured by AFM and TEM showed slight differences, for example, s-GO (and us-GO) had a size distribution between 20 – 800 nm (20 – 500 nm) when AFM was used, but 0.1 – 1.6 μm (30 – 480 nm) measured by TEM. The differences in lateral size distributions obtained by AFM and TEM were mainly due to a difference in image contrast and resolution between the two techniques. On the one hand, we fixed the AFM scan size to 5 µm in order to have a good view of the small size flake population for both s-GO and us-GO. Larger scan sizes would have led to a poorer view of these flakes, i.e. with the detected signal similar to noise. On the other hand, the poor contrast of the flakes in TEM led to a better overview of the larger size population compared to very small flakes. For this reason, when reporting the lateral size range of our GO, we refer to the interval between the minimum size detected by AFM and the maximum size detected by TEM. TEM and AFM micrographs presented in Figure 1 show thin and differently sized s-GO and us-GO flakes. As indicated in Figure 1 (C and F) 90% of the s-GO flakes had lateral dimension below 875 nm, while in the case of us-GO 90% of the flakes had lateral dimension below 225 nm. In addition, AFM also indicates that the synthesized GO consists of mainly monolayer and bilayer graphene oxide flakes, i.e. 94% of s-GO and 99% us-GO flakes have lateral size below 2 nm (Table 1). In summary, our results demonstrate that the physicochemical properties and the thickness of both materials are preserved throughout the synthesis process, even though the lateral dimensions of the flakes were different.

Physico-chemical characterization of s-GO (A-C) and us-GO (D-F): AFM profile images (A and D), TEM images (B and E) and the lateral size distributions determined from TEM images (C and F).
Characterisation of GO in cell culture medium
Another aspect to take into account when studying interactions of GO with cells is the new identity material obtained in the biological environment. For instance, when GO, or any other nanomaterial, is dispersed in complete cell culture medium (i.e. which contains serum and other supplements), the surface of GO is instantly covered with various serum proteins, electrolytes and biomolecules which alter the surface properties, colloidal stability and the size of the materials, and hence the way it interacts with the cells29, 37–39. Few researchers have attempted to evaluate the impact of serum on cellular interactions with GO. For example, Duan et al. found that GO coated with serum proteins has a lower membrane penetration ability than GO without protein coating24, and in our previous study, we found that the presence of serum can alleviate the toxic response induced by large GO flakes34. Therefore, with consideration to our previous findings and to mimic the biologically relevant environment the material is exposed to, all experiments in this study were performed in a serum contained environment. Even though lung epithelial cell line (BEAS-2B) was chosen, it is still clinically relevant to perform the study in the presence of serum: the epithelial lining fluid, which is a fluid layer covering the alveolar epithelium, contains some of the most abundant proteins usually found in serum and blood plasma (e.g. albumin, immunoglobulin G and transferrin)40–42.
Currently, when it comes to connecting the size of GO with the observed uptake profile, most studies only report the primary size of GO used in the study (i.e. lateral dimensions of bare GO flakes measured by TEM or AFM). Moreover, very frequently it is not specified whether the treatment using GO dispersed in cell culture medium contains serum proteins or not, and does not interrogate whether the colloidal stability of the material is affected17, 22, 25, 31, 43, 44. As already discussed, materials gain a new identity when dispersed in the biological medium, and hence characterisation of the material in the cell culture medium is extremely important. So far, characterisation of the material in the biological dispersion is often done for material with a spherical geometry but much less considered for 2 D material45, 46. Of the limited studies, characterisation of GO in cell culture medium has been performed by incubating the material in cell culture medium, followed by material isolation and characterisation by AFM24, 32.
To date, only a few studies have reported in situ characterisation of GO in liquids, mainly by light scattering techniques37, 47–49. In contrast to TEM and AFM in the dry state, light scattering techniques such as dynamic light scattering (DLS), bring the advantage of a faster and simpler method to evaluate the size of 2D materials dispersed in liquids. Although DLS is based on assumptions for spherical particles, different research groups have shown that the lateral size of 2D materials measured by TEM and AFM were actually scaled reasonably well with measurements by DLS47, 49. Hence, DLS can be used to offer valuable information on the relative changes in the size of the material in liquid over time. Based on such considerations, we evaluated the change of size and surface charge of s-GO and us-GO upon incubation in RPMI cell culture medium supplemented with foetal bovine serum (RPMI w FBS) for 0 min, 4 and 24 h (Figure 2), where the size measurements were done by DLS and Zeta potentials were measured by electrophoretic light scattering (ELS). These time points were selected since interactions of GO with cells were studied after 4 h and 24 h incubation period, and with the extra time point of 0 min, this should give us a better overview of how material changes over time. The changes in the size of the material can reflect if material agglomeration/aggregation happened, and the Zeta potential can give an indication of the surface charge and colloidal stability of GO in the cell culture medium.

Size distribution of s-GO (solid lines) and us-GO (dotted lines) incubated in RPMI with FBS at different time points. The graph illustrates the relative changes in the size of s-GO and us-GO after incubation in complete cell culture medium for a different period of times. Inserted table shows the measured hydrodynamic diameters, polydispersity index and Zeta potentials of the materials (in white for s-GO and in orange for us-GO).
The result of the Zeta potential and size distribution (expressed by intensity) of s-GO and us-GO at different time points are shown in Figure 2. First, the Zeta potential of both materials was found to be similar across all the time points. The Zeta potential changed from around −60 mV in water (Table 1) to −29 mV in RPMI w FBS at 0 min, then gradually increased to a distribution of between −33.4 to −38.7 mV for the 4 and 24 h time points. In general, the higher the absolute Zeta potential, the more stable the material dispersions50. This result indicates that GO dispersion in water is more stable than in cell culture medium, which is in agreement with the findings from the literature; for example, Ehrenberg et al. showed that Zeta potential of all investigated nanoparticles falls into the distribution range of −40 to −20 mV after 2h of incubation in FBS contained solution, irrespective of the initial surface charge (positively or negatively charged nanoparticles)51.
In general, the polydispersity index for s-GO is slightly higher than us-GO, which indicates a broader size distribution for s-GO than us-GO. This is in agreements with findings from both TEM and AFM (Table 1). What is interesting is that for both materials, the average size at 0 min is greater than the size measured at the 4 h time point, and then increases again at the 24 h time point. The increase in the size of material can take place via the irreversible aggregation and/or reversible agglomeration processes; however, DLS does not distinguish between the two processes. A possible explanation for the initial increase in the size of the materials might be due to the instant agglomeration with the increase in ionic strength in the cell culture medium, as also reflected in the reduced Zeta potential at 0 min.
Then the colloidal stability of the materials improved due to coverage of the serum proteins and/or biomolecules, which increases electrostatic/steric repulsion between the materials. Many studies have shown that the presence of serum enhances the colloidal stability of nanomaterial in cell culture medium52, 53. However, the ultimate stability of the material in suspension depends on the net inter-particles repulsion and attraction forces, and the types of interaction which contribute to the net repulsion/attraction forces can be easily altered with different media composition and materials properties39. The increase in the size of GO at the later time point (24 h) are in keeping with the observation that the material sediment in the medium over time. Lastly, it is worth mentioning that overlap of the size-distribution between s-GO and us-GO exists for all time points.
Uptake of GO across a panel of cell lines
Firstly, we wanted to establish whether GO is efficiently taken up by mammalian cells used in this study. BEAS-2B cells were treated with both types of GO and incubated for 24 h. CLSM was used as the primary tool for assessing the uptake and localization of GO in the cells.
Looking at the apical and middle section of the cells in Figure 3, we established the pattern of interactions of the GO with the cells. The internalised GO was easily distinguished from the GO adsorbed on the surface of the cells. The material adsorbed on the surface of the cells appeared as a cloud of signals coming from GO sitting on top of the plasma membrane (Figure 3A). On the other hand, the internalised GO (the red-spotted signal) was found distributed in the cytosol and predominately around the nucleus, as indicated by the circular distribution of the material towards the centre of the cells (Figure 3B). This observation suggests that the material was intracellularly trafficked towards the lysosomes; upon internalisation the newly formed cargo-enclosed vesicles fuse to form the early endosome, which then migrates from the periphery of the cell to a near-nucleus location where the late endosome will fuse with the lysosome for degradation54. The orthogonal projection of the middle section of the cells (Figure 3C) confirmed that the circularly distributed material was found inside the cells. Interactions of s-GO with the plasma membrane and the uptake of the material by BEAS-2B cells was also confirmed by TEM (see Figure S2).

Uptake of 50 µg/mL of s-GO by BEAS-2B cells after 24 h of treatment studied by TEM. (A) and (B) Interactions of s-GO with the plasma membrane and uptake of the material in a vesicle. (C) Cellular protrusion suggesting the uptake of s-GO via micropinocytosis. Red arrows indicate s-GO flakes. TEM was used as a confirmatory technique to confocal microscopy. GO was found in the vicinity or in interaction with the plasma membrane as shown in (A) and (C) or enclosed in a vesicle within the cell (B).
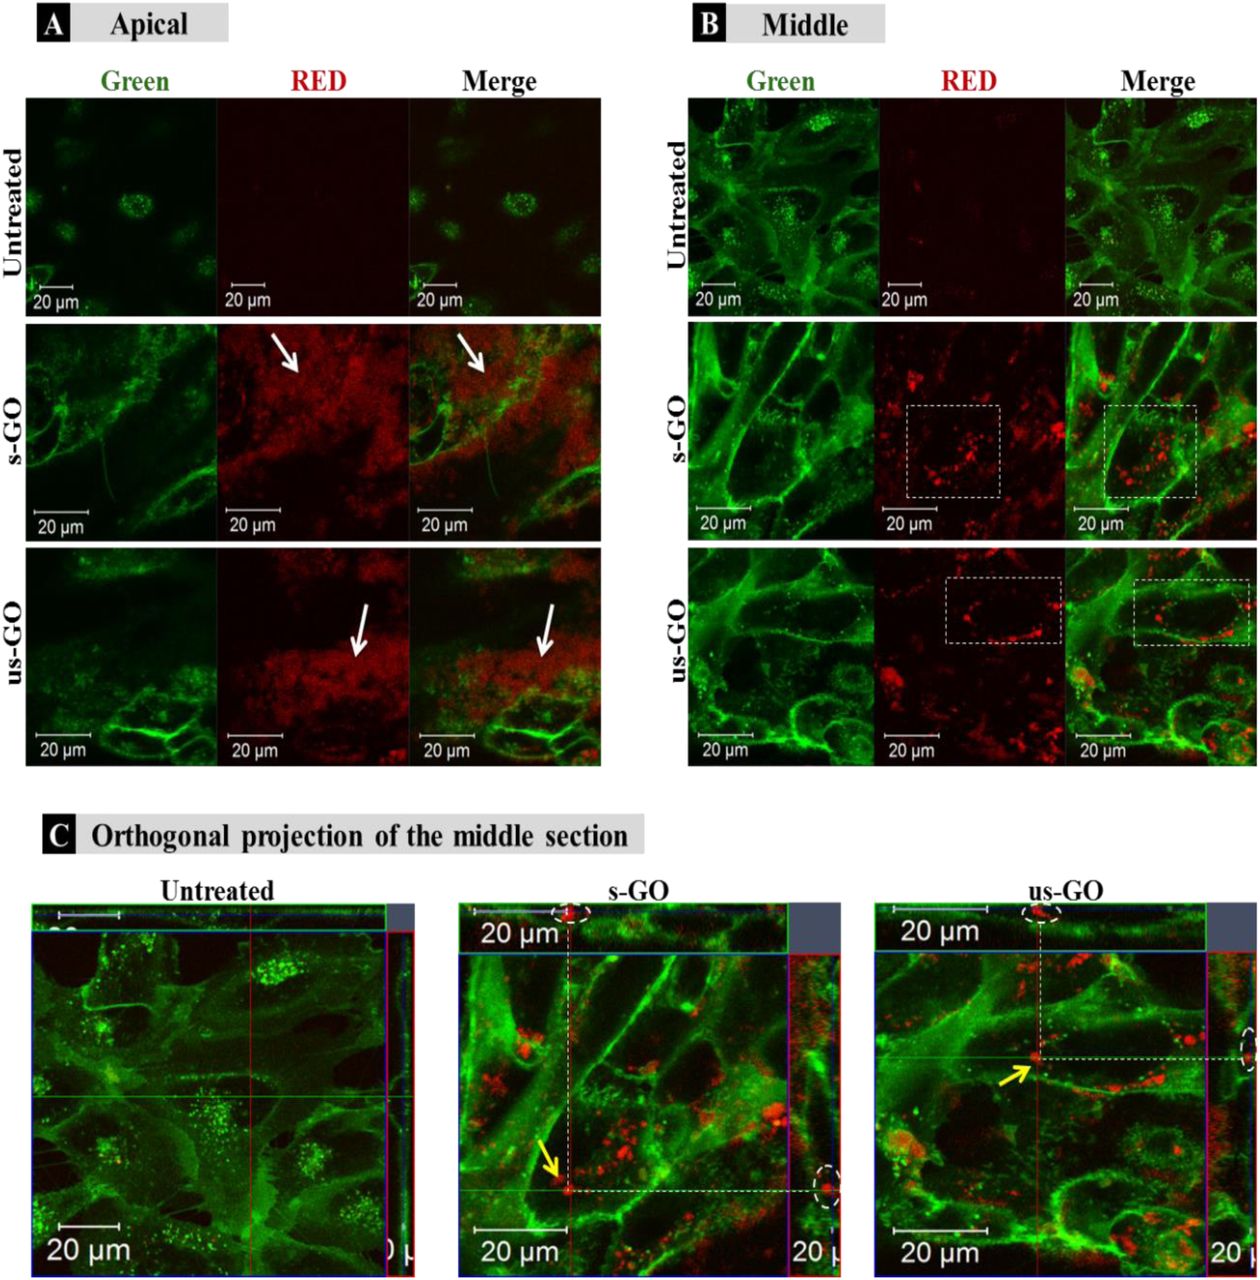
(A) Apical, (B) middle section and (C) orthogonal projection of the middle section of untreated or BEAS-2B cells treated with 50 µg/mL of GO after 24 h of treatment. White arrows in (A) indicate regions of GO interacting with the plasma membrane of the cells, which differs from internalised GO as shown in (B) and (C), indicated by white rectangles and yellow arrows respectively. Green = plasma membrane, Red = GO.
Further analyses using CLSM showed that both s-GO and us-GO were internalised by other non-phagocytic cell lines as well (NIH/3T3, HaCaT and 294T). Interestingly, different cell lines were capable of taking up GO to a different extent (Figure 4). NIH/3T3 - mouse embryonic fibroblasts displayed the highest uptake of GO when compared to HaCaT and 293T, which are human skin and kidney cells, respectively. Biological response to particular materials can vary depending on the origin of the cell line used, and indeed it has been previously reported that the interaction of GO with cells was cell-type specific21, 33. For example, a study reported by Linares et al. showed that cancer cells had the highest capacity to internalise GO, followed by normal and immune cell lines33. However, a more profound understanding of what drives this cell-type specificity towards the GO is still missing. Our future research will investigate further into the factors that drive the cell-type specificity toward the GO.

Uptake profile of 50 µg/mL of s-GO and us-GO in NIH/3T3, HaCaT and 293T cells (middle section of the cells is shown) after 24 h of treatment. Green = plasma membrane, Red = GO.
Our results agree with findings from the literature as several studies report internalisation of GO by the cells32–34. However, controversial experimental results are reported as well. For example, Chang et al. used GO with lateral size ranging from 160 to 780 nm and observed barely any internalisation of GO in human lung carcinoma cells25 using TEM, while Jin et al., also relied on TEM, reporting an utterly opposite result where GO with lateral dimensions around 300 nm was taken up by the same cell line43. Contradictions of the reported findings can occur due to several reasons: such as the batch to batch variation of the GO, the origin of the cell lines and the different treatment conditions of GO, for example, whether treatment was performed in the presence of serum or not. This illustrates the need to include a full characterisation of the materials used, but many of the existing literature on the interactions of GO with cells lack clarity regarding the detailed GO physicochemical properties and experimental conditions used.
Next, we established the time and dose kinetics profile of the uptake of two types of GO by BEAS-2B cells. Split channel images of BEAS-2B cells incubated for 24 h using different concentrations of s-GO and us-GO (25, 50 and 75 µg/mL) are shown in Figure 5 (top panels). We observe that GO was efficiently taken up by BEAS-2B cells regardless of the size or concentration of GO used, as indicated by the outlined circular distribution patterns of the material. If we compare the uptake of GO using different concentrations of the material, it is clear that GO internalisation increases with concentration applied, but no apparent difference in the uptake was observed between the two types of GO.

Interactions of (A) s-GO and (B) us-GO with BEAS-2B cells: (top) dose-dependence of the uptake of GO studied after 24 h of treatment by CLSM, (bottom) dose- and time-dependence interaction of GO studied by flow cytometry. White rectangles indicate the GO. Green = plasma membrane, Red = GO. Flow cytometry data were statistically analysed using analysis of variance (two-way ANOVA) with p < 0.0001 considered significant. *Statistically different from the cells treated with different concentration or time point. n = 3 independent experiments (each condition in each experiment was run in triplicate).
We further investigated interactions of GO with cells using flow cytometry (Figure 5, bottom panels). Density plots from flow cytometry are shown in Figure S3. Both s-GO and us-GO were found to interact with BEAS-2B cells in a dose- and time-dependent manner, corroborating the results obtained using confocal microscopy. The geometric mean fluorescence intensity (Geo MFI) of the cells was significantly lower at 4 h of incubation compared to 24 h, suggesting time dependence of the interaction. In general, the Geo MFI of the cells treated with s-GO was more intense compared to the ones treated with us-GO. The higher intensity measured for s-GO does not necessarily mean that the uptake of s-GO is higher than us-GO as the spectrofluorometric analysis of the materials showed that the s-GO has higher intrinsic fluorescence intensity than us-GO (Figure S1). The lack of standardised measure for the quantification of GO flakes in the initial treatment solution has made it challenging to normalise the measured intensity against the quantity of the GO, and so was to assess the size-dependent uptake efficiency of GO by cells using flow cytometry. However, when combined with the results obtained by confocal microscopy (Figure 5, top panels), we were able to conclude that the difference in the measured Geo MFI signal between s-GO and us-GO by flow cytometry is most likely due to difference in the intensity of the auto-fluorescent signal between the two materials.

FACS density plots of untreated and BEAS2B cells treated with 75 μg/mL of s-GO or us-GO at 4 h and 24 h time points. PE-Cy7-A channel was used to detect the auto-fluorescent signal from the GO. Cellular interaction with GO was assessed by flow cytometry by measuring the auto-fluorescent signal of GO in the PE-Cy7-A channel. It is obvious that the intensity of fluorescence of us-GO is much lower at 4 h compared to 24 h, whereas for s-GO the intensity of fluorescence is only slightly lower at 4 h compared to 24 h.
For s-GO, the dose-dependent behaviour was more significant for the 4 h incubation period but showed no significant difference for the 24 h incubation period. In opposite, the dose-dependent response for us-GO was more significant for the 24 h incubation period than the 4 h incubation period. These results indicate a possible difference in the sedimentation rate or different uptake kinetics for the two types of GO and open up a new question, whether s-GO and us-GO are taken up by the cells via different uptake mechanisms.
Revealing the cellular uptake mechanism of GO sheets
Eight pharmacological inhibitors for three main endocytic pathways, including macropinocytosis, clathrin-mediated endocytosis (CME) and caveolae-mediated endocytosis (CavME), were selected to assess the uptake mechanism of s-GO or us-GO in BEAS-2B cell line. The uptake of GO was assessed by taking advantage of auto-fluorescent properties of GO by flow cytometry and compared against the uptake of GO in control groups with no inhibitors.
Macropinocytosis is involved in the internalisation of large particles, ranging in size between 0.2 and 10 μm, which occurs either in an inducible or constitutive manner 54–56. The former is present in all animal cells, whereas the latter takes place mostly in macrophages and dendritic cells. CME takes up specific cargos with the size of around 200 nm54, 55, 57–59. Upon binding of the cargo to a specific transmembrane receptor, a sequence of events stimulated and eventually the coating protein (clathrin) on the cytosolic side of the plasma membrane self-assembles into a cage that forms a coating layer to the invaginated segment of the plasma membrane containing the cargo. And CavME, which is similar to CME, differed mainly in the main coating protein and occurred at plasma membrane region of high lipid content. CavME commonly recognized to take up cargos of a smaller size (∼50 to 100 nm) 54, 55, 60, 61.
Table 2 summarizes the inhibitors we used, the corresponding affected uptake mechanisms and working concentrations. Series of optimization studies were performed in order to determine the working concentration for each inhibitor for an incubation period of 4 h and 30 min62, 63. The incubation time was selected compromising both the intensity of the signal detected from GO by flow cytometry and toxicity of the inhibitor: the incubation period should be long enough to enable the detection of the GO signal but not too long to induce cell death/stress. As we demonstrated that flow cytometry could be used to detect the signal from GO after 4 h of incubation, this time point was selected. A range of concentrations was tested for each inhibitor (Figure S4), and the working concentration was selected based on the principle of selecting the concentration with the maximum inhibitory effect but minimum cytotoxicity induced by the inherent toxicity of the inhibitors62, 64. The cytotoxicity of the inhibitors was assessed by optical imaging and propidium iodide (PI)/annexin V (AV) staining using flow cytometry as well as by the assessment of actin filament disruption using CLSM (Figure S4 and S5). Disruption to the actin filaments was assessed to reassure the specificity of the inhibitors as they are involved in several uptake pathways.

Cytotoxicity of each inhibitor using three different concentrations was assessed via optical imaging, cell counting by Trypan Blue dye exclusion assay, and propidium iodide (PI)/ annexin V (AV) staining using flow cytometry. The optical images enabled to assess changes in cell morphology and healthiness of the monolayers, while live cell counting and PI/AV bivariate plots quantified cytotoxicity induced by the treatment with inhibitors. PI will stain for early necrotic cells, whereas AV will stain for early aprotic cells, cells which stained by both PI and AV indicate late cell death and cells unstained by both PI/AV are live cells (PI-/AV-). The selected working concentration for each inhibitor is further tested for disruption to actin filaments (Figure S5). Scale bar = 200 μm. (A: Ethyl-isopropyl amiloride, B: Monodansylcadaverine, C: Chlorpromazine, D: Genistein, E: Cytochalasin D, F: Latrunculin A, G: Dynasore and H: Sodium azide)
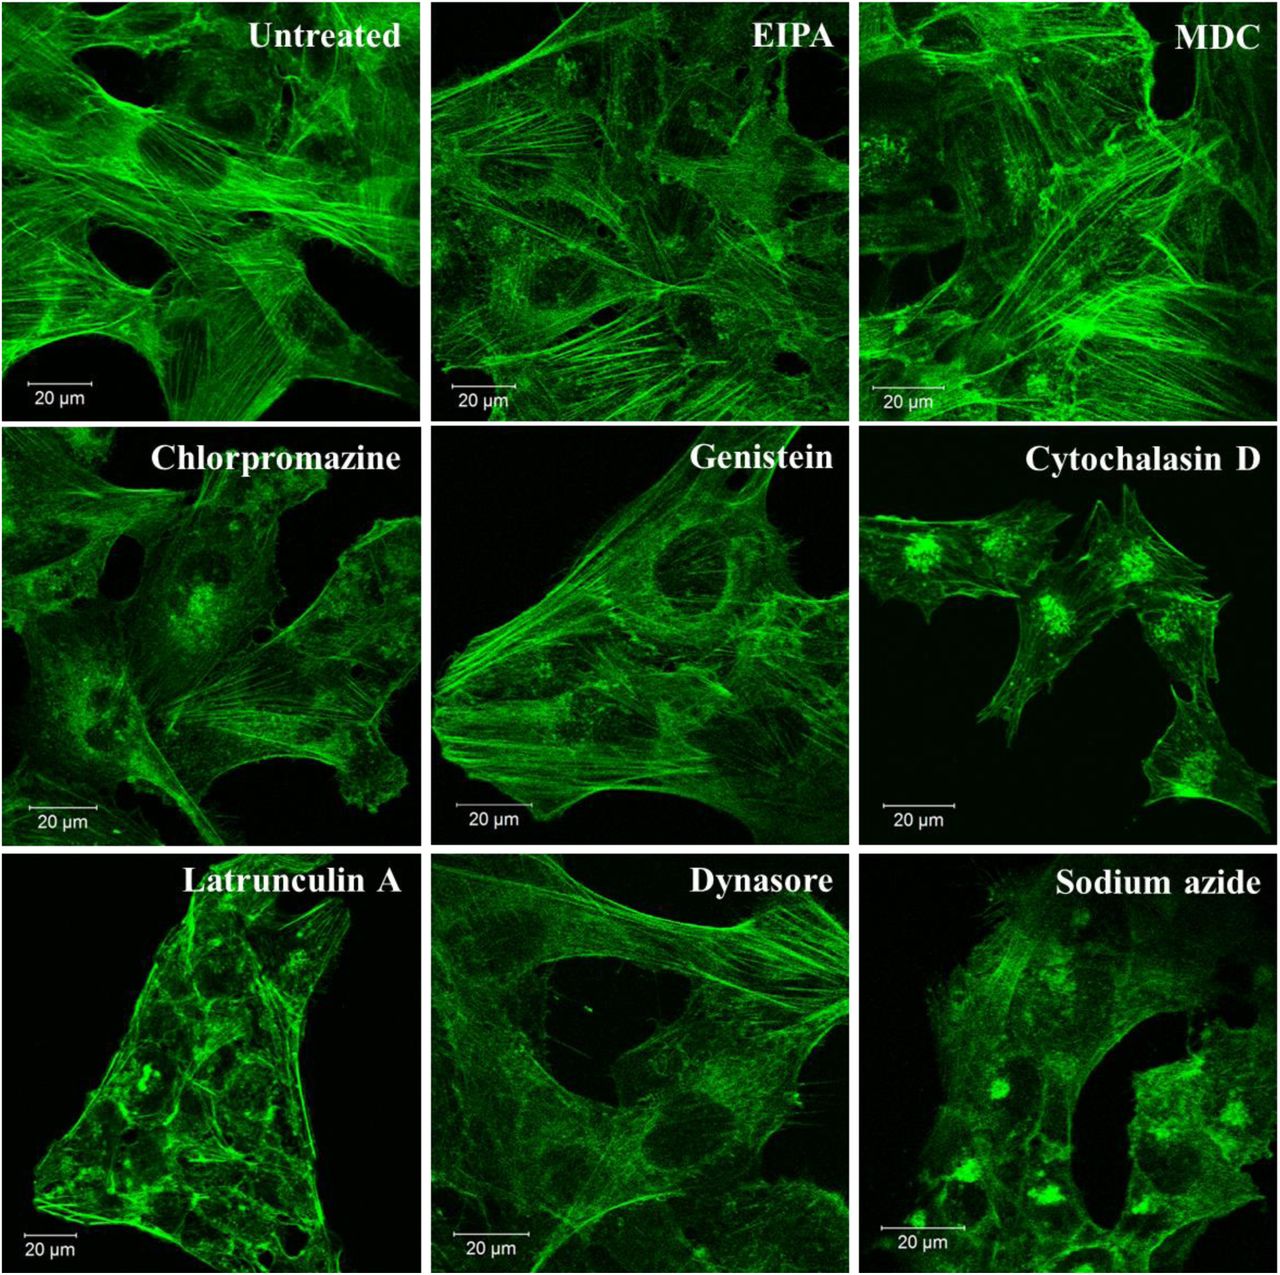
Actin filament staining of BEAS-2B cells with inhibitor at the selected working concentration (Table 2) using confocal microscopy. The result shows that in general the inhibitors caused no disruption of actin filaments, except for Cytochalasin D and Latrunculin A. Green = actin filaments.
List of the inhibitors used in the study.
EIPA = ethyl-isopropyl amiloride, CME = clathrin-mediated endocytosis, CavME = caveolae-mediated endocytosis.
In Figure 6, we summarize the percentage of GO uptake inhibition after the treatment with the different inhibitors, where the uptake of GO with no inhibitors corresponds to no uptake inhibition (0%). It is important to note that both sodium azide and dynasore were used as non-selective inhibitors for all main uptake pathways. Sodium azide affects all energy-dependent pathways by inhibiting the process of mitochondria respiration that is responsible for the production of cellular energy. Whereas, dynasore inhibits the activity of dynamin which is required for the cleavage of endocytic vesicles, and also known to interfere with actin filaments65.

The percentage of uptake inhibition of s-GO (filled) and us-GO (unfilled) in BEAS-2B cells after treatment with inhibitors (E = EIPA, M = Monodansylcadaverine, CP = Chlorpromazine, G = Genistein, CD = Cytochalasin D, L = Latrunculin A, D = Dynasore, N = Sodium azide), assessed by flow cytometry. The data were statistically analysed using analysis of variance (two-way ANOVA) with **** equate to p < 0.0001. n = 3 independent experiments (each condition in each experiment was run in triplicates).
As shown in Figure 6, dynasore has the highest inhibitory effect on the uptake of GO, but surprisingly, sodium azide was found to be not as effective as dynasore, especially for s-GO. For example, 77.95 and 93.97 % of s-GO and us-GO uptake was inhibited using dynasore, but only 54.80 and 86.22 % of s-GO and us-GO were inhibited with sodium azide, respectively. This outcome is contrary to that of Mu et al. (2012) published, who found more than 80% of both large and small GO (with the lateral dimension of 1 μm and 500 nm respectively) uptake is inhibited with sodium azide32.
The significant difference in the uptake inhibition found between the s-GO and us-GO after treatment with sodium azide is rather interesting. A possible explanation is that GO can enter the cells passively, and such process is size-dependent. So far, variety of nanoparticles of different physico-chemical properties (including size, shape, surface charge and functionalization) have previously reported to enters cells via non-endocytic pathways, but still very little is known about the factors which drive the process67–70. To validate if GO enters via non-endocytic pathways, future work should confirm whether the uptake of GO is temperature-dependent. It is known that non-endocytic pathway is temperature independent, whereas endocytic pathway is temperature-dependent66.
From Figure 6 it is apparent that all the inhibitors had an effect on both s-GO and us-GO uptake, but to a different extent. This suggests that all three main pathways are involved in the uptake of both materials, which is not a surprise, considering the broad size distribution of the two materials. Overall, the inhibitors were found to be more effective with us-GO than s-GO. These findings support the literature, where smaller GO flakes are in general taken up more efficiently than bigger GO flakes71. We found that the primary uptake pathway for s-GO is macropinocytosis because ethyl-isopropyl amiloride (EIPA) was most effective at inhibiting the uptake of s-GO (60.01 % of uptake inhibition). However, knowing that macropinocytosis is an actin-dependent process, it was surprising that Cytochalasin D (CytD) and Latrunculin A (LA), which perturb polymerization of the actin filaments (F-actin), were not as effective as expected (36.32 and 41.11 % of inhibition respectively)72, 73. A possible explanation might be the fact that EIPA works by inhibiting the exchange of sodium/proton cation at the surface of the plasma membrane and is, therefore, more efficient than CytD and LA which affects the actin filaments underneath the plasma membrane74, 75.
The inhibitors responsible for CME (monodansylcadaverine and chlorpromazine), were the most efficient with us-GO (with more than 86 % of uptake inhibition for both inhibitors). And genistein, which inhibits the CavME, was effective at inhibiting 80 % of the uptake for us-GO but just over 42 % for s-GO. It is also worth noting that CytD was capable of inhibiting 67.47 % of the uptake for us-GO, but LA only reduced the uptake of us-GO by 10.90 %. This result is consistent to Fujimoto et al. who found that CytD inhibited the uptake of transferrin by 60 – 70 % while LA reduced the uptake by small percentage73. Discrepancies in the effect of CytD and LA were found to be highly dependent on the cell types and the cell adhesion properties73.
Overall, the results on the involvement of different pathways for the two materials seem to follow the rough guideline of endocytosis determined by the size of the material. As illustrated in Figure 2, the size average of s-GO and us-GO incubated in cell culture medium for 4 h was 968.2 nm ± 21.28 nm and 252.9 ± 3.607 nm, respectively. These results agree with literature findings that macropinocytosis is involved in the uptake of large material (0.2 – 10 μm) whereas CME is commonly known to take up materials of around 200 nm54–59. Overlap of the size distributions between s-GO and us-GO explained the reason why multiple uptake pathways were involved for both materials.
Validation of the uptake mechanism
Taking into consideration that there is a growing concern around specificity and efficacy of inhibitors towards one or another endocytic pathway33, 72, 76, we decided to use fluorescently labelled carboxylate-modified polystyrene beads with different sizes (0.1 and 1 μm) to validate the endocytic pathway that we found to be predominantly used by s-GO and us-GO. The beads were selected because they have similar a surface charge (Table S1) and chemical composition as GO (GO also contained carboxylate functional groups). Since the size of the cargo can indicate the endocytic pathway involved, 1 μm beads are expected to be internalised mainly via macropinocytosis while 0.1 μm beads can be internalised via both CME and CavME63, 77, 78. Therefore, we hypothesized that if our findings on endocytic pathways used by GO were true (Figure 6, graph with inhibition of GO uptake %), then, the pre-treatment of s-GO or us-GO should reduce the uptake of 0.1 and/or 1 μm beads by occupying or saturating the corresponding pathway. With the broad size distribution of s-GO, we expected that the uptake of s-GO influences the uptake of both 1 and 0.1 μm beads, whereas the uptake of us-GO affects only the uptake of 0.1 μm beads.
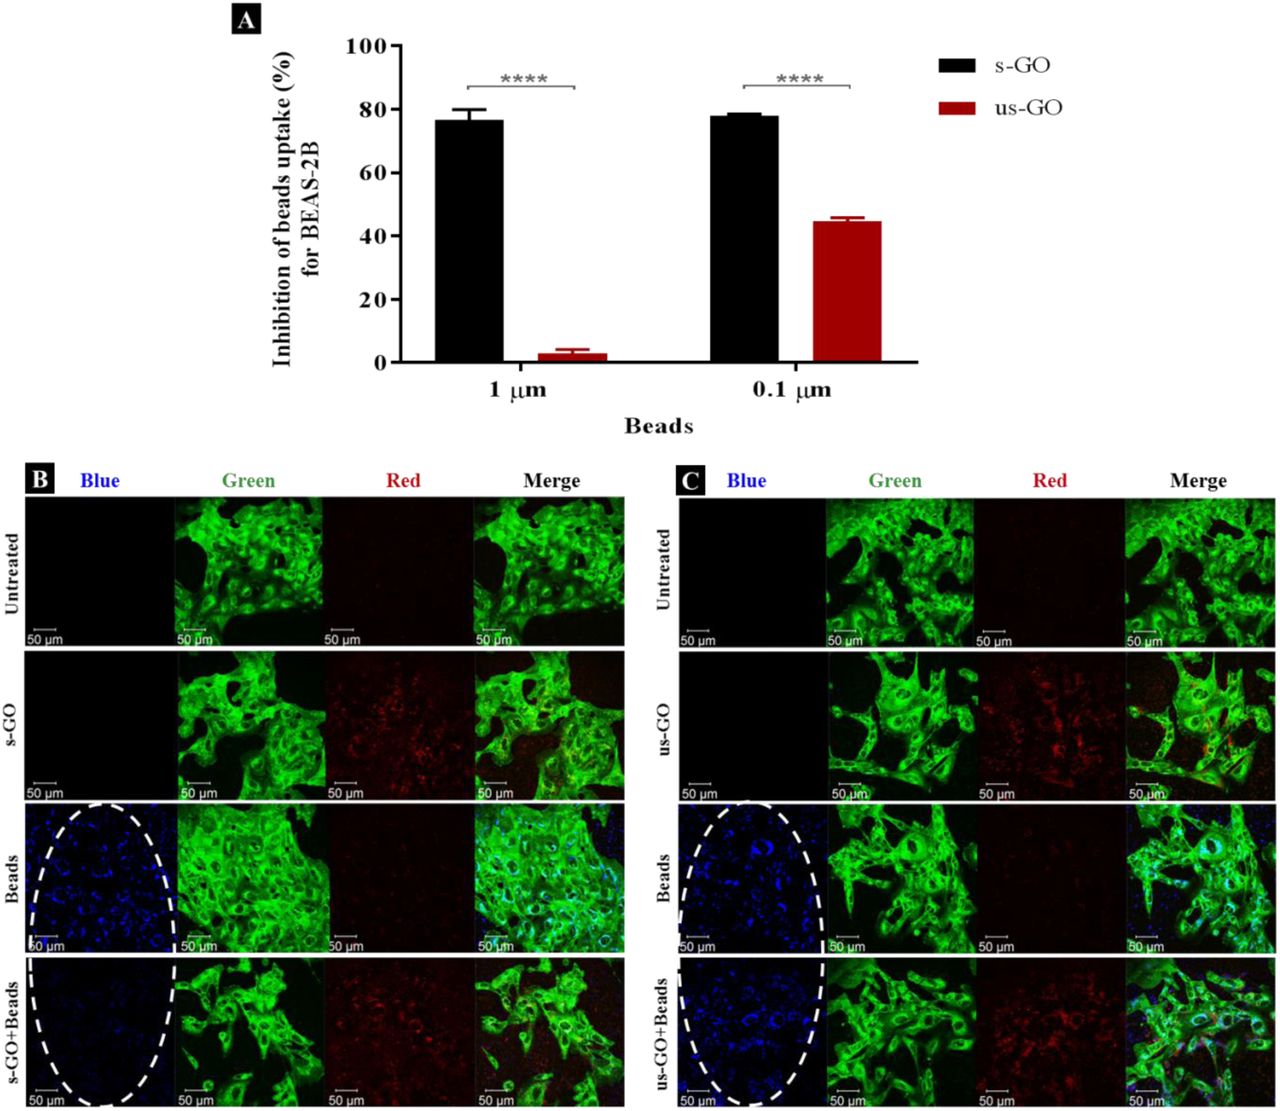
As shown in Figure 7A (and corresponded density plots showed in Figure S6), s-GO was very efficient at reducing the uptake of the beads irrespective of their size, while us-GO was only efficient at reducing the uptake of the 0.1 μm beads. For example, the inhibition of s-GO (us-GO) uptake for 1 and 0.1 μm beads was 76.1% (3.0%) and 77.9% (49.4%), respectively. Looking at the confocal images from Figure 7B-C, the result agrees with the findings from flow cytometry: the uptake of 1 μm beads was significantly reduced with the pre-treatment of s-GO but comparable to the uptake of 1 μm beads for the cells pre-treated with us-GO. Our previous confocal images indicated the association of GO with the plasma membrane, so we wanted to clarify that the inhibition of the uptake of the beads was not due to the attachment of GO to the plasma membrane and therefore shielding the cells from being in contact with the beads.

FACS density plot of untreated BEAS-2B cells, BEAS-2B cells treated with only GO, beads (0.1 or 1 μm beads), or beads (0.1 or 1 μm beads) in the presence of (A) s-GO, acquired using FACSVerse or (B) us-GO, acquired using Fortessa X20 at 50 μg/mL. This figure confirms that the fluorescent signal of the 0.1 and 1 μm beads changes in the presence of s-GO and us-GO, but to a different extent. Fluorescent signal of GO only was comparable to untreated cells.

(A) Percentage inhibition of the uptake of the beads (1 and 0.1 μm) in the presence of s-GO (black) or us-GO (red), assessed by flow cytometry. The data were statistically analysed using analysis of variance (two-way ANOVA) with **** equate to p < 0.0001. n = 2 or 3 independent experiments (each condition run in quintuplicate or duplicate, respectively). (B-C) The uptake of 1 μm beads in the presence of s-GO (B) or us-GO (C), assessed by confocal microscopy. The uptake of the beads was inhibited in the presence of s-GO, but not us-GO, indicated by the white ovals. Green = plasma membrane, Red = GO, Blue = 1 µm beads.
Looking at the apical section of the cells, cells treated with us-GO and 1 μm beads showed an obvious co-localisation of the us-GO and the beads on top of the plasma membrane, however, this was not the case for cells treated with s-GO and beads (Figure S7). Instead, cells treated with the beads and s-GO showed a cloud of s-GO without obvious clustering with the beads. Considering that the co-localisation of us-GO and the beads on top of the cells does not prevent the uptake of the beads, we conclude that the reduction in the uptake of beads was not due to the shielding effect of the GO but rather to the interference of GO with the corresponding uptake pathway.

The apical section of BEAS-2B cells treated with 1 μm beads in the presence/absence of s-GO/us-GO (50 μg/mL). White arrows indicate regions co-localisation between the beads and us-GO on top of the cells (F), which was not observed for cells treated with s-GO + beads (E). (A: untreated cells, B: s-GO treated, C: us-GO treated, D: beads treatment, E: s-GO + beads, F: us-GO + beads) Green = plasma membrane, red = GO, blue = beads.
In summary, our results show that all three major uptake pathways were involved in internalisation of s-GO and us-GO by BEAS-2B cell line, but s-GO preferentially used micropinocytosis, while us-GO used mainly CavME and CME. This was possible due to the broad size distribution of GO flakes: the smallest flakes were internalized mainly via CavME and CME, while the bigger ones entered the cells mainly via macropinocytosis. So far, surprisingly, only a few studies found in the literature focused on understanding GO uptake mechanism by the cells31–33. Our results are in agreement with the literature showing that the uptake of GO occurs via energy-dependent pathways31–33. The discovery of both s-GO and us-GO internalised via macropinocytosis was consistent with Linares et al. who found macropinocytosis to be an uptake mechanism for FITC-PEG-GO (with the lateral dimension of 100 nm) in the human liver cell (HepG2) and human bone cancer cell (Saos-2)33. Both phagocytic cells (C2C12, Raw-264.7) and non-phagocytic cells (HepG2, HeLa, Ca Ski) were found to take up GO through CME; despite the GO used have different physicochemical properties (with the lateral dimension ranged from 100 nm to 1 μm).
Intracellular fate of GO
We interrogated intracellular fate of GO with the use of CellLight™ Lysosomes-GFP. Figure 8 displays snapshots of the images taken at 24 h and 48 h time points during live-cell time-lapse experiment (Video S1-S6). The images show that both s-GO and us-GO end up in the lysosomes, as indicated by localisation of the GO signal (red) enclosed by the signal of the lysosomal marker (green).

Snapshots of time-lapse videos of the BEAS-2B cells treated with s-GO or us-GO for 24 and 48 h. Lysosomal compartments were labelled using CellLight™ Lysosomes-GFP, BacMam 2.0 prior to the treatment with GO. Green = lysosomes, Red = GO.
This result is in agreement with the literature suggesting that internalised GO ends up in the lysosomes9, 32. Some studies show that surface charge of GO can be modified using different chemical moieties in order to influence the intracellular fate of GO16, 18, 80. For example, utilising mouse macrophages, Wang et al. found positively charged polyethyleneimine modified GO (PEI-GO) in both endosomes and cytoplasm, while negatively charged polyethylene glycol-amine modified GO only localized in the endosomes18. Tripathi et al. demonstrated that the positively charged linear PEI-GO end up in the nucleus of cancer and non-cancer cells16. And Jin et al., who also used cancer cells, reported long term retention of the positively charged PEI-GO in the mitochondria, which could be due to the leakage of PEI-GO into the cytoplasm80. Therefore, even though the majority of GO was found in the lysosomes in this study, knowing the limitations of analysing non-labelled materials, we do not rule out the possibility that some individualized flakes might end up in the cytoplasm of the cells.
From Video S1-S6, we could also see a consistent exchange of both materials between the lysosomal vesicles, and with no obvious disruption to the lysosome membrane up to 48 h of treatment. These findings confirm results from our previous study, where we observed no toxicity or lysosomal rupture after treatment with s-GO using cell culture medium supplemented with 10% FBS34. Based on the results of this study, we can extend this statement to us-GO as well.
Conclusion
The aim of this study was to provide a better understanding of fundamental interactions of label-free GO with non-phagocytic mammalian cells (BEAS-2B, NIH/3T3, HaCaT and 293T) by taking advantage of intrinsic fluorescent properties of GO with two distinct lateral dimensions. Using confocal microscopy, flow cytometry and TEM, we show that both types of GO interacted with the plasma membrane and were efficiently taken up by the cells in a time- and dose-dependent manner. Both GO types were internalised via multiple pathways by BEAS-2B cells; however, macropinocytosis was mainly used for the uptake of s-GO, while CME and CavME were mainly used for the uptake of us-GO. The observed difference was connected with the broad size distribution of the two materials, thoroughly characterized both in water and in biologically relevant cell culture medium. Furthermore, validation of the uptake pathway was performed by investigating the interference of both types of GO with the uptake of 0.1 and 1 μm beads. We clearly show that s-GO could reduce the uptake of the beads irrespective of their sizes, while us-GO was only capable of reducing the uptake of 0.1 μm beads. Finally, both types of GO materials were found to end up in the lysosomes for up to 48h. This study provides valuable insight into the way GO can be further exploited both biomedically but also in the studies aiming to establish its safety profile.
Experimental
Production and characterisation of graphene oxide
Aqueous dispersions of s-GO and us-GO were prepared as described in our previous studies4, 36 by a modified Hummer’s method coupled with sonication. We used sterilised glassware and GO suspensions were always handled within fume hoods. In brief, 0.8 g of graphite powder (Sigma Aldrich) were mixed with 0.4 g NaNO3 and 18.4 mL H2SO4 (99%) by a 10 minutes rigorous stirring at low temperature (ice bath), followed by the addition of 2.4 g KMnO4.The mixture was stirred continuously for 30 minutes (water bath) until a green, homogenous and thick paste was formed. Then, a volume of 37.5 mL water for injections was added dropwise to the reaction volume, while carefully monitoring the temperature rise. The mixture was then stirred for 30 minutes at 98 °C (oil bath). Lastly, the reaction was stopped by the addition of 12.5 mL of H2O2 and the mixture was left to settle for 1 hour. Subsequently, the dispersion was subjected to a series of washes with water for injections (8800xg, 20 minutes), in order to neutralise the pH, remove the impurities and separate the GO from the graphitic residues. Upon the last two washing steps, GO was separated by vortexing and then solubilised in with warm water for injection (50 °C) from the orange gel layer, which formed at the top of the graphite oxide. Any graphitic residues still present in the dispersion were removed by an additional centrifugation step (8800xg, 20 minutes), at 24 hours post-reaction. The size reduction to small and ultra-small flakes was carried outby sonication (80 W, 45 kHz) for 5 minutes and 4 hours, respectively. The purification was done by centrifugation at 13000 rpm for 5 minutes in the case of s-GO and 1 hour in the case of us-GO.
UV-visible spectroscopy (UV-vis)
Spectra of GO dilutions in Milli-Q water with concentrations ranging from 2.5 to 20 μg/mL were acquired using a Cary 50 Bio UV-vis spectrophotometer (Varian Inc., Agilent Technologies, UK). Measurements were performed at room temperature in a quartz cuvette (1 mL volume, 1 cm path length). Milli-Q water was used as a blank.
Fluorescence spectroscopy
Different concentrations of GO dispersions (25–200 μg/mL) were measured with a Cary Eclipse fluorescence spectrophotometer (Varian Inc., Agilent Technologies, UK). Spectra were acquired at room temperature, with λexc set to 525 nm. Milli-Q water was used as a blank.
Raman spectroscopy
Measurements were recorded by a DXR micro-Raman spectrometer (Thermo Fisher Scientific, UK) equipped with a 633 nm laser set to 0.4 mW. Calibration was done on a polystyrene standard, the chosen objective was 50x, and the pinhole was set to 50 µm. Spectra were then recorded between 500 and 4000 cm-1 with a resolution of 2.5 cm-1. All spectra were processed by background subtraction and normalisation by the G band intensity using OriginPro 8.5.1 software.
Zeta Potential measurements
The Zeta potential values of GO suspensions in Milli-Q water were measured with a ZetaSizer Nano ZS instrument (Malvern, UK). All measurements were performed at 25 °C using disposable folded capillary zeta cells. The results are reported as the average ± standard deviation of three measurements per sample.
Thermogravimetric analysis (TGA)
The oxidation degree of GO materials was extracted from the degradation patterns measured with a TGA 4000 thermogravimetric analyser (PerkinElmer Ltd, UK). All measurements were done on 2 mg lyophilised material, in a Nitrogen atmosphere (20 mL/min) and at temperatures ranging from 25 to 995 °C (10 °C/min). The material residues remained at 995 °C were burned by switching the purge gas to Oxygen, for 15 minutes.
X-ray photoelectron spectroscopy (XPS)
XPS measurements of lyophilised GO samples were analysed using a Thermo Theta Probe XPS spectrometer with a monochromatic Al K-α source of 1486.68 eV. The spectra were acquired with PE of 40 kV, 0.1 eV step size and an average of 20 scans. Spectra post-processing was done with CasaXPS software (Casa Software Ltd, UK). A Shirley background subtraction was applied to all spectra and Gaussian–Lorentzian (70:30) functions were used for fitting the functional groups, except for the asymmetric C–C and C=C peak, which was fitted using an asymmetric Lorentzian function. The full width half maximum (FWHM) value was constrained between 0.5 and 2 eV for all peaks, except for the π–π*. The following constrain regions were set for the binding energies: 284-285.5 for C-C/C=C, 285.5-286.5 for C-O, 286.8-287.8 for C=O, 288.6-290 for COOH and >290 for π-π*.
Transmission electron microscopy (TEM)
TEM analyses were performed on an FEI Tecnai 12 BioTwin equipment (FEI, Eindhoven, NL) with the electron beam set to 100 kV. The samples were prepared on 300-mesh carbon-coated copper grids, at room temperature and in a clean environment. A volume of 20 µL of GO dispersion was drop-casted on the grid, and the excess was removed after 1 minute with filter paper, leaving a thin layer of suspension to fully dry. Eventually, a small drop was casted and left to dry at the edge of the grid. Images were captured with an AMT digital camera (Gatan, UK). The raw data were further processed using ImageJ.
Atomic force microscopy (AFM)
A multimode atomic force microscope (Bruker, UK) was used in tapping mode, using Otespa-R3 probes (Bruker, UK). Samples were prepared on poly-L-lysine 0.01% (Sigma Aldrich P4707) coated mica substrates, by drop-casting a volume of 20 µL of 100 µg/mL GO dilution in Milli-Q water for 1 minute, followed by a washing step with 1 mL Milli-Q water and drying overnight in a drying cabinet (37°C). Scanning parameters were set as follows: 1 Hz scanning rate, 250 mV amplitude set-point, 512 lines per scan, an integral gain of 1 and a proportional gain of 5. Images were processed with the Bruker Nanoscope Analysis software-Version 1.4.
Characterisation of GO in cell culture medium
GO (50 μg/mL) was incubated in RPMI-1640 cell culture medium (R8758, Sigma-Aldrich, Merck Sigma, UK), supplemented with 10% FBS (F9665, Sigma-Aldrich, Merck Sigma, UK), 1000 units Penicillin, and 1 mg/mL Streptomycin (Sigma-Aldrich, Merck Sigma, UK) for a series of time points (0 min, 4 h and 24 h). At indicated time point, GO was centrifuged (30 min, 13 000 rpm), suspended in Milli-Q water (1 mL), re-centrifuged (30 min, 13 000 rpm), and then re-suspended in Milli-Q water (1 mL) for Zeta-potential and size analysis using ZetaSizer Nano ZS instrument (Malvern, UK).
Cell culture
Human epithelial bronchial immortalized cells (BEAS-2B, CRL-9609, ATCC, LGC standards, UK) were maintained in RPMI-1640 cell culture medium, mouse fibroblast embryonic immortalized cells (NIH/3T3, CRL-1658, ATCC, LGC standards, UK), human epithelial keratinocyte immortalized cells (HaCaT, PCS-200-011, ATCC, LGC standards, UK) and human epithelial embryonic kidney immortalized cells (293T, CRL-2316, ATCC, LGC standards, UK) were maintained in DMEM cell culture medium (D6429, Sigma-Aldrich, Merck Sigma, UK), all supplemented with 10% FBS, 1000 units Penicillin, and 1 mg/mL Streptomycin at 37 °C in a humidified 5% CO2 incubator. Cells were split at 80% confluence with 0.05% Trypsin-EDTA (Sigma-Aldrich, Merck Sigma, UK), and 10% FBS was used to stop the activity of Trypsin-EDTA.
Cell culture treatments
Depending on the experiment cells were seeded in either Cellview™ dishes (for all confocal microscopy related experiments) or in 12-well plates (for all flow cytometry related experiments). Cells were treated at 60-80% confluence unless stated otherwise. Cells were always seeded in the cell-type specific growth medium up to 24 h before treatments/pre-treatments, and in RPMI-1640 cell culture medium for all treatments/pre-treatments, all supplemented with 10% FBS, 1000 units Penicillin, and 1 mg/mL Streptomycin at 37 °C in a humidified 5% CO2 incubator.
Confocal microscopy
Uptake of GO
Cells were treated with s-GO or us-GO (25, 50 and 75 µg/mL, 0.5 mL/well) for 24 h. After 24 h of treatment, supernatants were removed and replaced by CellMask™ green plasma membrane stain (C37608, Thermo Fisher Scientific, UK) prepared in the control medium (dilution 1:2500). Cells were then examined using Zeiss 780 CLSM using the 40X objective. Images were then processed using Zeiss microscope software ZEN. Excitation/emission wavelength: CellMask™ green = 488/520, GO = 594/620-690 nm.
Uptake of 1μm beads in the presence or absence of GO
BEAS-2B cells were pre-treated at ∼30-40% confluence with either complete RPMI-1640 cell culture medium (0.5 mL/well) or s-GO/us-GO (50 µg/mL, 0.5 mL/well) and incubated for 4 h. After pre-treatments, 1 µm beads (1.5 µL/mL, 0.5 mL/well, F8814, Thermo Scientific, UK) or complete RPMI-1640 cell culture medium (0.5 mL/well) containing CellMask™ green plasma membrane stain (dilution 1:2500) were added to the cells and incubated for another 24 h. Cells were then examined using Zeiss 710 CLSM (40X objective, imaging mode) and processed using Zeiss microscope software ZEN. Excitation/emission wavelength: CellMask™ green = 488/520, 1 µm beads = 365/415.
Subcellular localization of GO
BEAS-2B cells were incubated with CellLight™ Lysosomes-GFP, BacMam 2.0 at 40% confluence (20 µl of CellLight™ Lysosomes-GFP was diluted in 0.5 ml of complete cell culture medium/well; C10596, Thermo Fischer, UK) for 16 h (overnight). After incubation, cells were washed once with PBS (with Ca2+/Mg2+) and treated with 50 µg/mL of s-GO or us-GO for 24h. After the treatment cells were imaged using Zeiss 780 live-cell time lapse confocal microscope for the interval of 20 min. Excitation/emission wavelength for CellLight™ Lysosomes-GFP = 488/520.
Treatments with pharmacological inhibitors
BEAS-2B cells were pre-treated at ∼80-90% confluence with EIPA (100 µM, 1 mL/well, A3085, Sigma-Aldrich, Merck Sigma, UK), monodansylcadavarine (55 μM, 1 mL/well, D4008, Sigma-Aldrich, Merck Sigma, UK), chlorpromazine (20 µM, 1 mL/well, C8138, Sigma-Aldrich, Merck Sigma, UK), genistein (350 μM, 1 mL/well, G6649, Sigma-Aldrich, Merck Sigma, UK), cytochalasin D (0.5 µM, 1 mL/well, C8273, Sigma-Aldrich, Merck Sigma, UK), latrunculin A (100 nM, 1 mL/well, L5163, Sigma-Aldrich, Merck Sigma, UK), sodium azide (100 mM, 1 mL/well, 26626-22-8, Sigma-Aldrich, Merck Sigma, UK) or dynasore (300 µM, 1 mL/well, D7693, Sigma-Aldrich, Merck Sigma, UK) for 30 min. After pre-treatment, supernatants were removed and cells were treated with s-GO (50 µg/mL, 1 mL/well) or us-GO (50 µg/mL, 1 mL/well) prepared in the corresponding pre-treatment solution containing inhibitor and incubated for 4 h. Cells were then detached with 0.05% Trypsin-EDTA (300 µL/well, 10 min,), neutralised with 10% FBS (30 µL/well), collected in 1.5 mL tube, stored in ice and analysed by FACSVerse flow cytometry using the PE-Cy7-A channel (bandpass: 488 780/60). Excitation/emission wavelength: GO = 594/620-690.
Staining of actin filaments
BEAS-2B cells were treated with the EIPA (100 µM, 0.5 mL/well), monodansylcadavarine (55 μM, 0.5 mL/well), chlorpromazine (20 µM, 0.5 mL/well), genistein (350 μM, 0.5 mL/well), cytochalasin D (0.5 µM, 0.5 mL/well), latrunculin A (100 nM, 0.5 mL/well), sodium azide (100 mM, 0.5 mL/well) or dynasore (300 µM, 0.5 mL/well) for 4 h and 30 min. After treatment, cells were washed two times with pre-warmed PBS (0.5 mL/well, D8662, Sigma-Aldrich, Merck Sigma, UK), fixed with formaldehyde (3.7%, 0.5 ml/well, 10 min; 28908 Thermo Fisher Scientific, UK). After fixation cells were permeabilized with Triton-X (0.1 % in PBS, 0.5 mL/well, 5 mins) and washed two times with PBS (0.5 mL/well)before staining with Alexa Fluor™ 488 Phalloidin (A12379, Thermo Fischer, UK) prepared in PBS (in a dilution of 1:1500) for 20 min. Cells were washed two times with PBS (0.5 mL/well), following by the addition of ProLong™ Gold Antifade Mountant (P36930, Thermo Fisher Scientific, UK) and covered with a coverslip. Cells were then observed using Zeiss 780 CLSM using the 40X objective. Images were processed using Zeiss microscope software ZEN. Excitation/emission wavelength: Phalloidin = 495/518.
Flow cytometry
Cellular interactions with GO
BEAS-2B cells were treated with s-GO or us-GO (25, 50 and 75 µg/mL, 1mL/well) for 4 h or 24 h. Cells were then detached with 0.05% Trypsin-EDTA (300 µL/well, 10 min), neutralised with 10% FBS (30 µL/well), collected in 1.5 mL tube, stored in ice and analysed by FACSVerse flow cytometry using the PE-Cy7-A channel (band pass: 488 780/60). Excitation/emission band pass: GO = 594/620-690.
Cellular interactions with the beads in the presence or absence of GO
BEAS-2B cells were pre-treated with either complete RPMI-1640 cell culture medium (1 mL/well) or s-GO/us-GO (50 µg/mL, 1 mL/well) at ∼30-40% confluence for 4 h. After pre-treatments, 0.1 μm beads (1.5 μL/mL, 1 mL/well, F8803, Thermo Scientific, UK), 1 μm beads (1.5 μL/mL, 1 mL/well, F8823, Thermo Scientific, UK) or complete RPMI-1640 cell culture medium (1 mL/well) were added to the cells and incubated for another 24 h. Cells were then detached with 0.05% Trypsin-EDTA (300 µL/well, 10 min), neutralised with 10% FBS (30 µL/well), collected in 1.5 mL tube, stored in ice and analysed by FACSVerse flow cytometry (bandpass: 488 530/30) or Fortessa X20 (bandpass: 488 529/24) using the FITC channel. Trypan Blue (0.2 % solution) was added to each sample just before analysis. Excitation/emission wavelengths: 0.1 µm beads = 505/515, 1 µm beads = 505/515.
PI/AV assay
BEAS-2B cells were treated at ∼80% confluence with EIPA (100 µM, 1 mL/well,), monodansylcadavarine(55 μM, 1 mL/well,), chlorpromazine (20 µM, 1 mL/well, C8138), genistein (350 μM, 1 mL/well), cytochalasin D (0.5 µM, 1 mL/well), latrunculin A (100 nM, 1 mL/well), sodium azide (100 mM, 1 mL/well) or dynasore (300 µM, 1 mL/well) for 4 h and 30 min. Cells were then detached with 0.05% Trypsin-EDTA (300 µL/well, 10 min), neutralised with 10% FBS (30 µL/well) and collected in 1.5 mL tube. Cells were centrifuged (1500 rpm, 5 min) and re-suspended in diluted Annexin-binding buffer (1X, 200 μL/tube, V13246, Thermo Fisher Scientific, UK). Cells were labelled with Annexin V (1 μL/tube, A13201, Thermo Fisher Scientific, UK) for 20 min. Samples were stored on ice and analysed by FACSVerse flow cytometry using the FITC-A (bandpass: 488 530/30)and PE-A (bandpass: 488 574/26) channel, Propidium Iodide (1 μL/tube, P4864-10ML, Sigma-Aldrich, Merck Sigma, UK) was added to the cells just before analysis of the samples. Excitation/emission wavelength: Annexin V = 495/519, Propidium Iodide = 493/636.
TEM
BEAS-2B cells were grown on a sterilized Aclar placed in a 12-well plate and treated with 50 µg/mL of s-GO when they reached 70% confluence. After 24 h of treatment, cells were fixed at room temperature using 4% glutaraldehyde/4% paraformaldehyde prepared in 0.2 M HEPES buffer for at least 2 h, washed three times using ddH2O, then incubated for 2 h in ferrocyanide reduced osmium. After dehydration in increasing concentrations of ethanol (from 30% up to 100%) and then two times in acetone (100%, 30 min) the samples were immersed in an increasing concentration of TAAB 812 resin in acetone. Ultrathin sections of 80 nm, obtained with a diamond knife using a Leica U6 ultramicrotome, were mounted on the grids and before being examined with an FEI TECNAI transmission electron microscope.
Statistical analysis
All experiments were repeated at least two times with duplicates, triplicates or quintuplicate for each condition, and the results were expressed as mean ± standard deviation. Flow cytometry data were analysed using GraphPad Prism (version 7) with analysis of (two-way ANOVA) with p < 0.0001 considered as significant.
Summary of the sizes and Zeta potentials of the materials (in RPMI w FBS) used in the study. Materials were prepared in RPMI w FBS and measured within 1 hour of sample preparations. The result indicated the 0.1 and 1 μm beads had a similar surface charge to the GO we produced.
FITC-labelled = fluorescein isothiocyanale-labelled.
Acknowledgements
Authors would like to acknowledge the funding from Graphene Flagship WP4 project (FP7-ICT-2013-FET-F-604391) and from Horizon 2020 research and innovation programme under the grant agreement no. 785219 (Graphene Flagship Core2). Both Y.C. and L.E.C would like to acknowledge the studentship from the Engineering and Physical Sciences Research Council (EPSRC) Centre for Doctoral Training programme (Graphene NOWNANO CDT; EP/L01548X/1). The authors acknowledge the staff of the Faculty of Biology Medicine and Health EM Facility, for their expertise and assistance, and the Wellcome Trust for equipment grant support to the EM Facility. The University of Manchester Bioimaging and Single Cell Genomics Facility microscopes used in this study were purchased with grants from the Biotechnology and Biological Sciences Research Council (BBSRC), Wellcome Trust, and the University of Manchester Strategic Fund. The authors also wish to thank Dr. N. Hodson from the Bio-AFM Facility for assistance and advice regarding the AFM instrumentation. The authors acknowledge the Manchester Collaborative Centre for Inflammation Research (MCCIR) as the funding source for the FACSVerse and Fortessa X20 instrument. Authors also acknowledge EPSRC Harwell XPS facility based at Cardiff University for the provision of X-ray photoelectron spectra.
References


