

ABSTRACT
Fetal Alcohol Spectrum Disorders (FASD) describes the full range of defects that result from prenatal alcohol exposure. The clinical diagnosis of Fetal Alcohol Syndrome (FAS) is the most severe outcome, characterized by facial dysmorphism and neurological deficits. Gene-ethanol interactions underlie susceptibility to FASD but we lack a clear understanding of the genetic risk factors. Here, we leverage the genetic tractability of zebrafish to address this problem. We first show that vangl2, a member of the Wnt/planar cell polarity (Wnt/PCP) pathway that mediates convergent extension movements, strongly interacts with ethanol during late blastula and early gastrula stages. Embryos mutant or heterozygous for vangl2 are sensitized to ethanol-induced midfacial hypoplasia. However, we have no understanding of the potential mechanism of this sensitization. We performed single-embryo RNA-Seq during early embryonic stages, to assess individual variation to the transcriptional response to ethanol and determine the mechanism of the vangl2-ethanol interaction. Transcriptional changes due to ethanol are indicative of increased oxidative stress and ion transport as well as reduced DNA replication and cell division. To identify the pathway(s) that are disrupted by ethanol we used these global changes in gene expression to identify small molecules, often pathway inhibitors, that mimic the effects of ethanol via the Library of Integrated Network-based Cellular Signatures (LINCS L1000) dataset. This dataset predicted that the Sonic Hedgehog (Shh) pathway inhibitor, cyclopamine, would mimic the effects of ethanol, despite ethanol not altering the expression levels of direct targets of Shh signaling. Indeed, we found that ethanol and cyclopamine strongly interact to disrupt midfacial development. Collectively, these results suggest that the midfacial defects in ethanol-exposed vangl2 mutants are due to an indirect interaction between ethanol and the Shh pathway. Vangl2 functions as part of a signaling pathway that regulates coordinated cell movements during midfacial development. Consistent with an indirect model, a critical source of Shh signaling that separates the developing eye field into bilateral eyes, allowing the expansion of the midface, becomes mispositioned in ethanol-exposed vangl2 mutants.
INTRODUCTION
Prenatal alcohol exposure (PAE) is the most preventable cause of birth defects, yet the prevalence of fetal alcohol spectrum disorders (FASD) in the US is as high as 2-5% (May et al., 2009). Fetal alcohol syndrome (FAS) is the most severe outcome following PAE and is characterized by midfacial hypoplasia, as well as growth and neural deficits (Jones and Smith, 1973). While PAE is required for the development of FASD, the teratogenic effects of ethanol are modulated by genetics (McCarthy et al., 2016). Genetics play a significant role as evidenced by human twin studies. Monozygotic twins were 100% concordant for FAS, whereas dizygotic twins were only 63% concordant (Eberhart and Parnell, 2016; Streissguth and Dehaene, 1993). Furthermore, animal models of FAS show strain-specific differences after controlling for environmental variables such as dose and timing (Downing et al., 2009; Loucks and Carvan, 2004). Despite this, the genetic factors that protect or predispose an individual to FASD are poorly understood. Moreover, we still lack a basic understanding of the mechanism of ethanol teratogenesis. Zebrafish are well suited to address this problem due to their genetic tractability and ease of embryological manipulation (Lovely et al., 2016).
In a screen to identify genetic modifiers of ethanol teratogenicity, vang-like 2 (vangl2), a member of the non-canonical Wnt/PCP pathway, emerged as an ethanol sensitive locus (Swartz et al., 2014). In zebrafish, mutations in the vangl2 locus disrupt convergent extension movements during gastrulation, resulting in a shortened, broadened, body axis (Solnica-Krezel et al., 1996). These mutants infrequently present with synophthalmia, fusion of the bilateral eyes, but the phenotypic expressivity of this trait varies with factors such as temperature and genetic background (Marlow et al., 1998). In the screen, all untreated vangl2 mutants displayed proper separation of the eyes and craniofacial skeletal elements were intact (Swartz et al., 2014). Upon exposure to a subteratogenic dose of ethanol, vangl2 mutants were fully penetrant for synophthalmia and displayed profound defects to the midfacial skeleton (Swartz et al., 2014). Ethanol-treated vangl2 heterozygotes were largely indistinguishable from their wild-type siblings, with the exception of a single synophthalmic ethanol-treated heterozygote, providing evidence for latent haploinsufficiency. Together, these data suggest a synergistic interaction between a mutation in vangl2 and ethanol.
We know vangl2 plays a critical role in mediating convergent extension movements as evidenced by their body axis defect, however because the early effects of ethanol exposure remain poorly defined, the precise mechanism of the vangl2-ethanol interaction remain elusive. To better understand how ethanol interacts with a mutation in vangl2 to alter phenotypic outcomes, we took an unbiased approach to assess the transcriptional response to ethanol. we performed single embryo RNA-sequencing (RNA-seq) on control (untreated) and ethanol-treated wild-type embryos in a time-course spanning gastrulation and early segmentation stages in zebrafish.
Bioinformatic and functional analyses indicated that midfacial defects in ethanol-exposed vangl2 mutants was due to an indirect interaction between ethanol and the Shh pathway. While there was no alteration in the level of expression of direct Shh targets, a critical source of Shh signaling that separates the developing eye field into bilateral eyes becomes mispositioned in ethanol-exposed vangl2 mutants, providing a plausible mechanism for the observed vangl2-ethanol interaction.
RESULTS
Early embryogenesis is the sensitive time window for vangl2 mutants
The vangl2m209 allele (formerly known as trim209) was identified as a splice site mutation containing an intronic insertion that results in a frameshift, terminating in a premature stop codon (Jessen et al., 2002). Using PCR analysis of genomic DNA from fin clips, we identified the splice acceptor mutation that alters the invariant 3’ consensus sequence, AG, of intron 7, to TG. Zebrafish homozygous for vangl2m209 are phenotypically indistinguishable from vangl2 null alleles, suggesting vangl2m209 to be an amorph (Jessen et al., 2002; Marlow et al., 1998).
To determine the critical time window of sensitivity for the vangl2 mutants, we first initiated ethanol treatment at various stages comprising late blastula to early gastrula for 24 hours. The inner lens-to-lens width was used as a measure of cyclopia and ethanol-induced teratogenesis. In control conditions, homozygotes exhibited midline defects ranging in severity from synophthalmia (incomplete separation of the eyes) to cyclopia (complete fusion of the eyes) across all time points, but these malformations were fully penetrant for cyclopia (100% fused; n=5/5) when ethanol was applied at shield stage (6 hours post fertilization, hpf) at the onset of gastrulation (Figure 1A, B). Heterozygotes showed increased sensitivities when ethanol was applied at high stage (3.3 hpf) (22% fused; n=4/18), a time when treating wild-type embryos with higher concentrations of ethanol causes similar defects (Figure 1B) (Blader and Strahle, 1998). Thus, heterozygotes and homozygotes were equally sensitive at early stages of development but subsequently diverged in their sensitivity. This may be due to a compensatory genetic mechanism in vangl2 heterozygotes because zygotic gene expression initiates after high stage (4 hpf) in zebrafish.

vangl2 mutants are sensitive to ethanol during early embryogenesis. (A) Treatment of vangl2 embryos with 1% ethanol at four different stages comprising late blastula to early gastrula [3.3, 4, 4.5, and 6 hours post fertilization (hpf)] for 24 hours. Homozygous mutants showed a significant decrease in the inner lens-to-lens width when treated from 6 to 30 hpf. (B) Heterozygous mutants were most sensitive to ethanol when exposed from 3.3 to 27.3 hpf (n=4/18 cyclopic). Homozygous mutants were most sensitive when exposed from 6 to 30 hpf (n=5/5 cyclopic).
The effect of ethanol on the early zebrafish transcriptome is subtle relative to developmental time
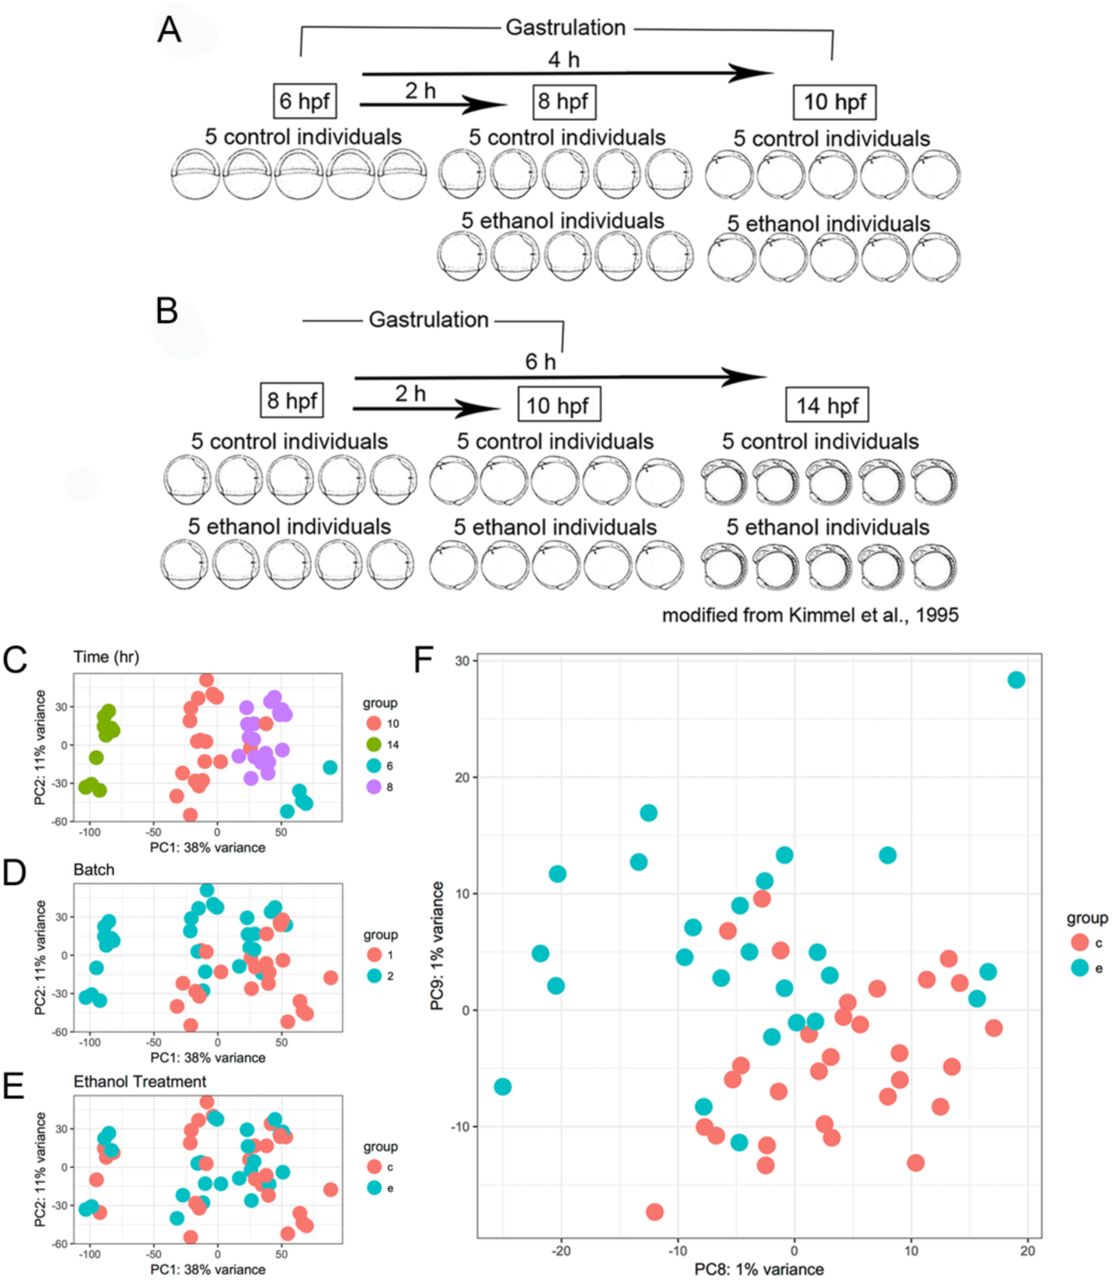
To determine if ethanol caused transcriptional changes that could underlie the interaction with vangl2, we designed two RNA-Seq experiments that largely overlapped in design. Embryos were exposed to a subteratogenic dose of 1% ethanol in embryo media (171 mM), which equilibrates to approximately 50 mM tissue concentration (Lovely et al., 2014). For the first experiment, embryos were treated at the onset of gastrulation (6 hpf) and collected at mid-gastrulation (8 hpf) and the end of gastrulation (10 hpf) (Figure 2A). Each sample consisted of an individual zebrafish embryo with five replicates per timepoint and treatment. A second experiment was performed to increase power (Figure 2B). Embryos were similarly exposed, but an eight-hour exposure window was included (6-14 hpf), when the eye fields have completely separated. The 6 hpf control samples were omitted since they lacked ethanol-treated samples for comparison. The data from both experiments were combined for subsequent analyses, controlling for batch effects.

(A) Schematic representation of the RNA-seq experimental design. Wild-type AB embryos were exposed to a subteratogenic dose of 1% ethanol in the embryo media at shield stage (6 hpf). Embryos were subsequently collected at 8 and 10 hpf for experiment 1 and (B) 8, 10, and 14 hpf, for experiment 2. Each sample consisted of a single zebrafish embryo with 5 control and 5 ethanol-treated samples per timepoint with the exception of the 6 hpf timepoint, which only had 5 control samples. (C-F) Principal components analysis (PCA) of top 25,000 most variable genes. The percentage of variance explained is given on each axis label. (C) PC1 and PC2 color coded by developmental timepoint. (D) PC1 and PC2 color coded by RNA-seq experiment (batch). (E) PC1 and PC2 color coded by ethanol treatment group. (F) PC8 and PC9 showing separation of ethanol treated and control samples.
To assess the effect of time, batch (i.e. experiment 1 and 2), and ethanol, on the early zebrafish transcriptome, we performed principal component analysis (PCA). Individuals from each timepoint clustered tightly along PC1, which accounted for 38% of the transcriptional variation observed across the datasets. This strong effect of time on the zebrafish transcriptome is in agreement with previous studies (Farrell et al., 2018). Clustering of samples by time, regardless of ethanol treatment suggested that control and ethanol-treated samples were accurately staged, indicating that ethanol did not appear to delay developmentally regulated transcriptome patterns. There was greater discrimination of 14 hpf samples relative to earlier timepoints (6, 8, and 10 hpf), which is consistent with greater distinction of this timepoint in terms of developmental time and morphology (Figure 2C). PC2 largely captured batch effects between experiment 1 and 2 (Figure 2D).
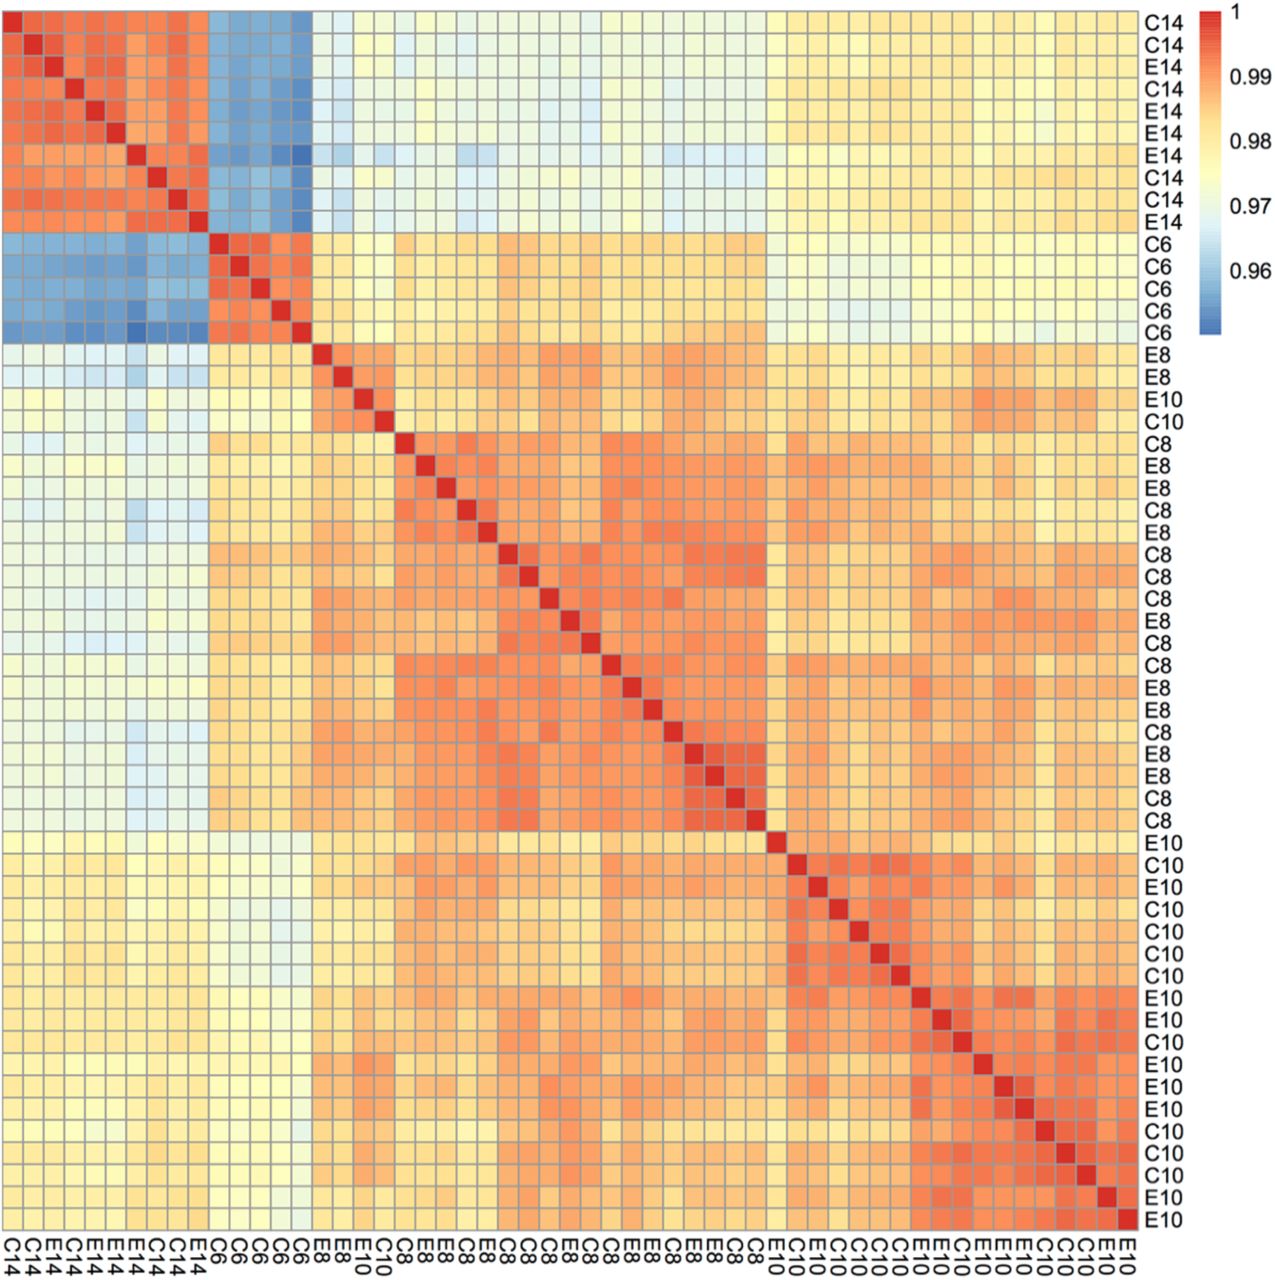
The majority of variation between samples did not appear to be due to treatment, with control and ethanol-treated samples randomly interspersed along PC1 and PC2 (Figure 2E). Separation by treatment was observed along PC8 and PC9, which accounts for 2% of the variation in the data (Fig. 2F). Hierarchical clustering of samples based on correlation, further corroborated this finding. The 6 and 14 hpf samples showed the greatest dissimilarity, whereas the 8 and 10 hpf samples showed the greatest similarity, irrespective of treatment (Figure 3). In summary, the transcriptional effect of exposure to a subteratogenic dose of ethanol on the early zebrafish transcriptome was subtle, while time provided the strongest transcriptional fingerprint.

Heatmap showing overall correlation of gene expression among samples. Samples were hierarchically clustered based on similarity. Treatment [control or ethanol treated (C or E)] and developmental age [hours post fertilization (6, 10, 8, or 14)] are indicated in the row and column labels.
Ethanol has effects on transcription that are largely distinct between different developmental timepoints
Although developmental age was a stronger source of transcriptional variation, we still detected substantial variation in gene expression following subteratogenic ethanol exposure. There were 1,414 differentially expressed genes (DEGs), with a false-discovery rate (FDR) less than 0.1 (Figure 4A; Benjamini–Hochberg procedure). There were more upregulated than downregulated DEGs among ethanol-treated individuals across timepoints (Figure 4A, 2.5A) and these DEGs were distinct between developmental timepoints (Figure 4B). The 14 hpf samples were most distinct (Figure 5D), with considerably lower variation due to ethanol treatment and fewer DEGs compared to the 8 and 10 hpf samples (Fig. 5B,C). One explanation for the decreased effect of ethanol is that in contrast to the other timepoints, the 14 hpf samples were exclusively in experiment 2, with only half the number of samples. An alternative explanation is that cells become more restricted in their potency through developmental time and thus become more dissimilar in their transcriptional profiles, which allows for little overlap. In summary, while some genes are generally affected by ethanol across several critical periods, ethanol largely elicits unique responses at distinct developmental stages spanning early embryogenesis.

(A) Volcano plot showing differential expression due to ethanol treatment across all samples. Significant genes (FDR < 0.1)* are indicated in red. Genes that were significant at all time points (overlap) are indicated in blue. (B) Venn-diagram showing overlap of significant genes between the three individual timepoints. (C) Table of genes that were significant for each timepoint individually (D) KEGG pathway schematic illustrating differential expression due to ethanol treatment in the Wnt/planar cell polarity (Wnt/PCP) pathway. Color coding indicates log2 fold differences due to ethanol treatment across all samples, red indicates upregulation due to ethanol, blue indicates downregulation due to ethanol. Only pathway members with significant changes were color coded. In the event that multiple genes from the dataset were annotated with the same pathway member, the log2 fold difference for the gene with the greatest absolute value for the difference was used.

Volcano plot showing variation in the transcriptional response to ethanol treatment across developmental timepoints. Significant genes (FDR < 0.1) are indicated in red. For each subset, the names of the topmost significantly dysregulated genes are noted near gene’s data point (A) All timepoints combined together (B) 8 hpf only (C) 10 hpf only (D) 14 hpf only.
Ethanol does not affect the Wnt/PCP pathway at the transcriptional level
Transcription of Wnt/PCP pathway members was largely unaffected by ethanol exposure. No Wnt/PCP pathway members were among the 15 shared DEGs across all timepoints (Figure 4C). KEGG pathway enrichment analysis further confirmed that ethanol had little effect on the Wnt/PCP pathway at the level of transcription (Figure 4D). Only two Wnt/PCP pathway members were moderately affected: ethanol exposure moderately decreased expression of the cofactor, glypican 4 (gpc4), (log2 foldc= -0.237; p-value = 0.036) across all timepoints (Marlow et al., 1998; Topczewski et al., 2001) and upregulated expression of rac3a (log2 fold = 0.737; p-value = 8.89E-06), a member of the Rho family of small GTPases (White et al., 2018).
Transcriptional changes due to ethanol suggest increased oxidative stress and ion transport and reduced DNA replication and cell division following ethanol exposure
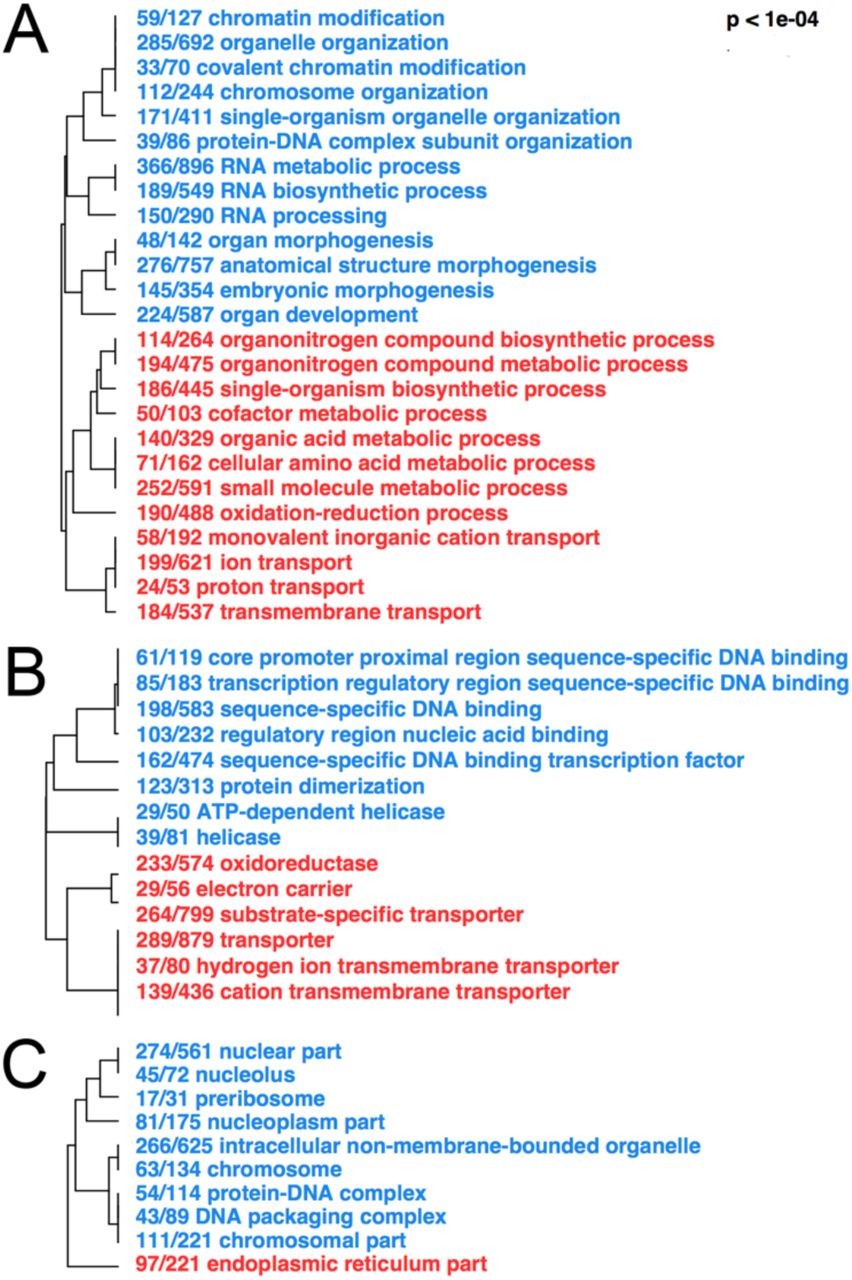
To summarize the functions of ethanol-responsive genes, we tested for enrichment of Gene Ontology (GO) terms for genes up- and downregulated due to ethanol treatment. This was done separately for GO terms describing molecular function (Figure 6), biological processes (Figure 6B), and cellular components (Figure 6C). Transcriptional changes due to ethanol suggested increased oxidative stress and reduced DNA replication and cell division (Figure 6A-C). Highly enriched GO terms indicative of oxidative stress include oxidoreductase, oxidation-reduction process, ion transport, and endoplasmic reticulum (Figure 6A-C). GO terms indicative of cell division and DNA replication include helicase, ATP-dependent helicase, ATP-dependent DNA helicase, chromatin modification, chromosome organization, DNA packaging complex, and nucleolus (Figure 6A-C). The metabolism of alcohol to acetate involves the production of damaging reactive oxygen species, which contribute to increased oxidative stress (G. I. Henderson, 1995). The results from our GO analysis results support that ethanol exposure generates oxidative stress.

Red GO terms are enriched for genes upregulated by ethanol. Blue GO terms are enriched for genes downregulated by ethanol. (A) Molecular Function (B) Biological Process (C) Cellular Component.
Modules of co-regulated genes related to ethanol exposure
To determine if ethanol disrupted networks of genes that could explain the vangl2-ethanol interaction, we next performed Weighted Gene Co-expression Network Analysis (WGCNA) (Langfelder and Horvath, 2008). This unsupervised network analysis identifies groups of genes, termed modules, based on correlated expression patterns across the samples. Modules are summarized by the first principal component for the expression estimates of the included genes, termed the module eigengene, which can be correlated with sample traits to identify biological significance. The cluster dendrogram generated in this analysis illustrates the presence of highly distinct and clustered modules (Figure 7A). Merging of similar modules produced eleven total modules (Figure 7B). The module eigengenes were correlated with treatment, time, and batch (i.e. experiment 1 vs. 2). As a negative control, we also included a randomized set of ethanol treatment factors. Consistent with our PCA results, nearly all modules showed a strong correlation with time, but two modules (mediumpurple4 and darkolivegreen4) also significantly correlated with ethanol treatment (Figure 7B-E). The purple and green modules positively and negatively correlated with ethanol treatment, respectively (Figure 7E). A significant differentially expressed gene from the purple (Figure 8A) and green module (Figure 8B) were selected for independent validation on independent biological replicate samples derived from the same wild-type zebrafish line using quantitative real-time RT-PCR (qRT-PCR). These results indicate that our RNA-seq faithfully represents transcript levels. The purple module revealed GO enrichment of transmembrane transporters, which included slc16a9a (Figure 8F). The green module revealed GO enrichment for genes encoding zinc finger (ZnF) proteins, which included znf1015 (Figure 8F).

(A) Dendrogram illustrating the hierarchical clustering of the genes and with their corresponding modules colors. The top layer of colors indicates the Dynamic Tree Cutoff, including all assigned modules, before merging by module similarity. The bottom layer indicates the module colors after merging. These merged modules were used for further analysis. (B) Heatmap of module-trait correlations. The eigengene for each module was correlated with ethanol treatment (ethanol), hours post fertilization (age), experimental batch (seqjob), and as a negative control, a randomly shuffled version of the ethanol treatments (rand.eth). Intensity of the color in each cell indicates the strength of correlation between the module (row labels) and the sample trait (column labels). Two modules, (mediumpurple4 and darkolivegreen4) significantly correlated with ethanol treatment (p < 0.05). (C-D) Scatterplots of correlation with ethanol treatment against module membership. Each datapoint is a gene assigned to the indicated module. Ethanol correlation is the Pearson correlation between the gene’s expression level and ethanol treatment. Module membership is the correlation between the genes expression level and the module eigengene and describes how well the gene matches the overall patterns of the module. (E) Boxplot of log2 fold differences due to ethanol for the two significant modules. (F) Gene ontology enrichment tree for Molecular Function for the mediumpurple4 module. (G) Gene ontology enrichment tree for Molecular Function for the darkolivegreen4 module.
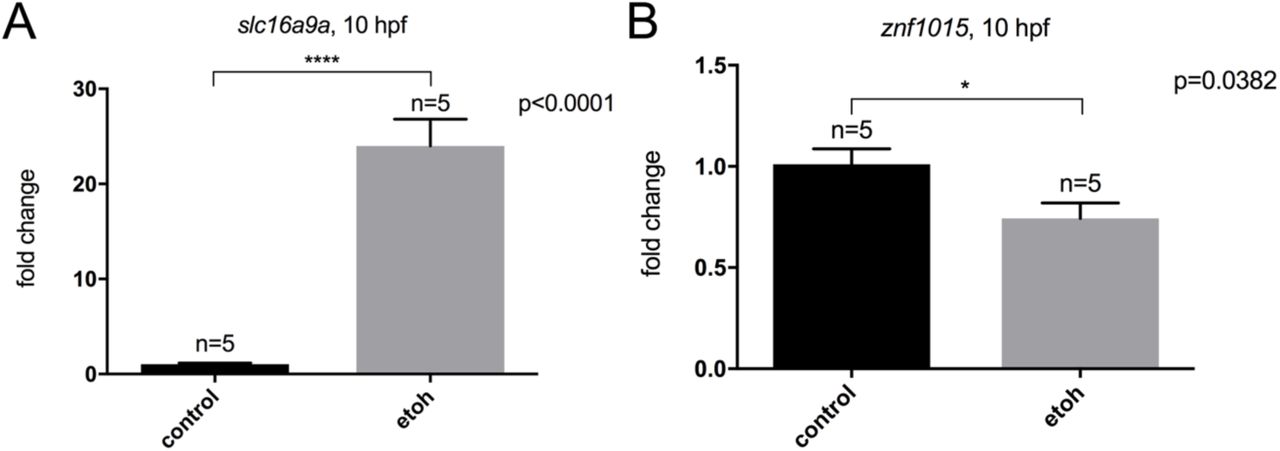
Changes in gene expression from the RNA-seq were validated using wild-type embryos at 10 hpf. (A) slc16a9a was selected from the mediumpurple4 module and (B) znf1015 was selected from the darkolivegreen4 module. Fold change indicates the degree of change between untreated control and ethanol-treated stage-matched embryos. lsm12b (like-Sm protein 12 homolog b) was used as a normalization control gene.
Previous work has shown that ethanol delays development in a dose-dependent manner at concentrations equal to or greater than 1.5% ethanol (Loucks and Ahlgren, 2009). For the experiments herein, ethanol-treated samples were morphologically stage-matched to control samples to exclude differences due to developmental age or delay. To confirm that the ethanol samples were indeed age-matched to the control samples at the transcriptional level, we compared expression patterns of developmentally regulated genes between the ethanol and control samples from each timepoint. For developmentally regulated genes, we used the gene with the highest module membership (i.e. the hub gene) from each of the WGCNA modules that was associated with time (p < 0.05) (Figure 9). Consistent with the results from the PCA (Figure 2C), expression levels for each gene were similar in control and ethanol-treated samples across age. Despite increased expression of slc16a9a in the mediumpurple4 module in ethanol-treated samples, directionality remained consistent with control samples (Figure 9A). Similarly, we observed a modest decrease in expression of the hub gene (ENSDARG00000101103) for the darkolivegreen4 module in ethanol-treated samples (Figure 9F). Together, these data indicate samples were accurately age-matched and the observed changes were biologically relevant.

(A-F) Development-related WGCNA modules were identified as those with significant relationship to hours post fertilization (Pearson correlation; p<0.05). The hub gene for each of these modules was identified as the gene assigned to that module with the highest module membership (defined as the correlation of the gene’s expression level with the module eigengene). Normalized expression levels for the hub genes were plotted against hours post fertilization. The relationship between expression and time is largely consistent between the ethanol treated (E, teal) and control (C, pink) samples. Even for the two modules associated with ethanol treatment (mediumpurple4 and darkolivegreen4), the slopes of the lines are very similar, indicating subteratogenic ethanol exposure did not cause significant developmental delay.
Cyclopamine is predicted to mimic the effects of ethanol
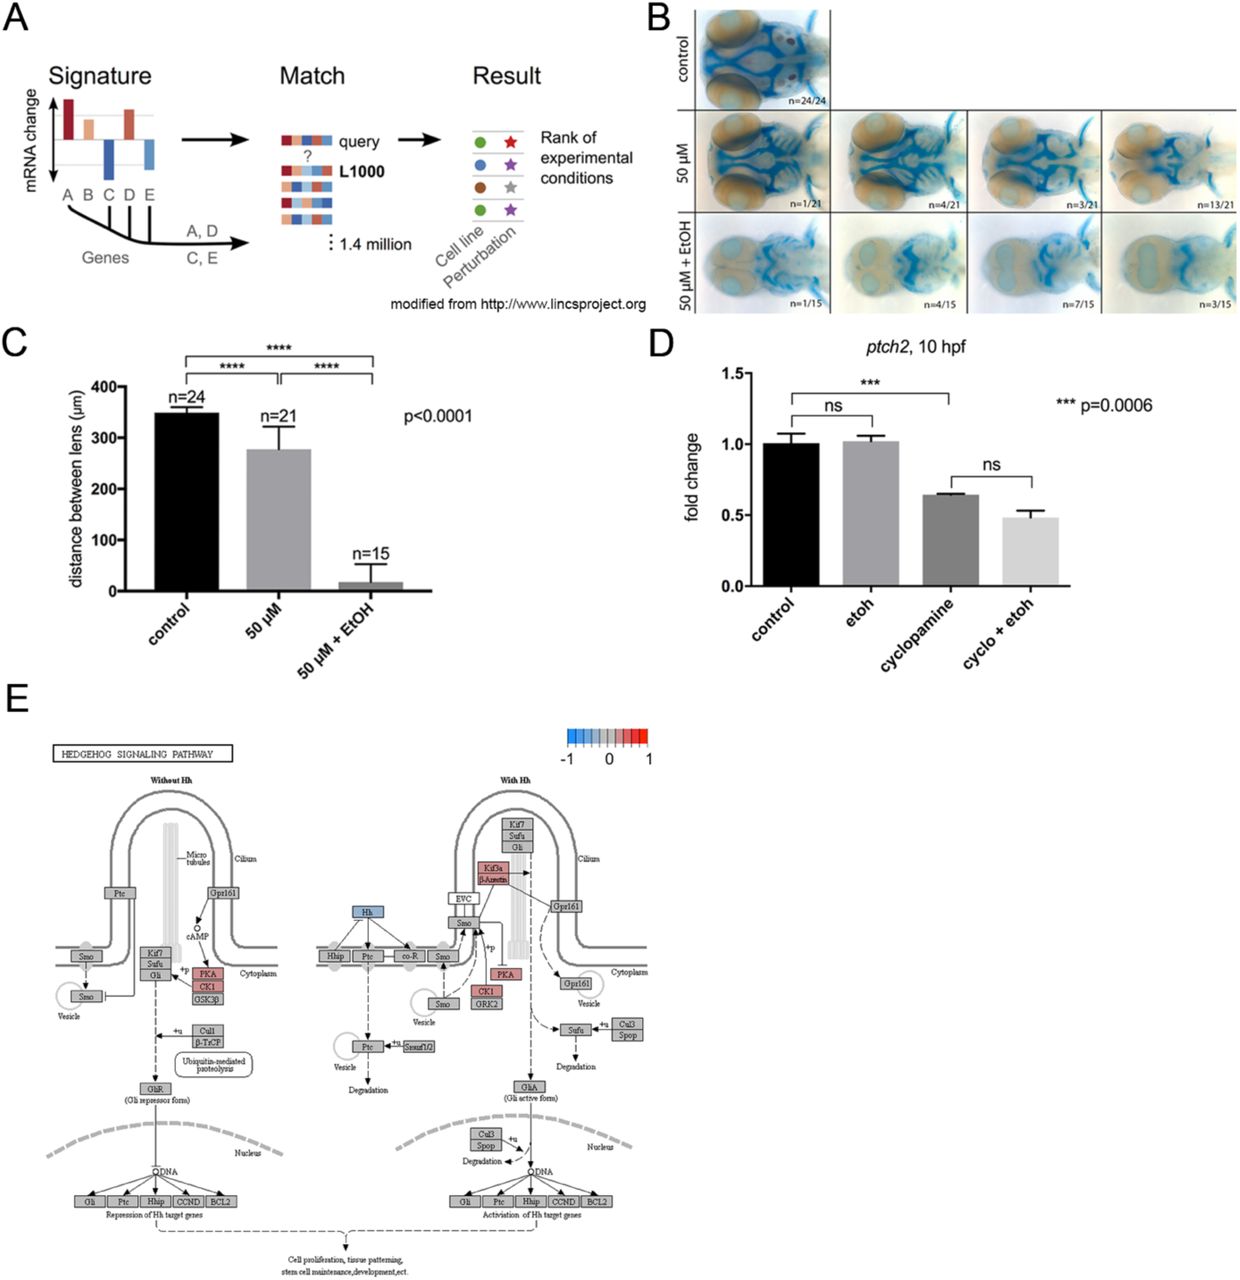
One challenge in RNA-seq analyses is inferring the mechanism underlying a diseased or environmentally-perturbed state from a large set of differentially expressed genes. Individual functional analyses of significant gene-ethanol interactions are time consuming and thus inefficient. To circumvent this problem, we adopted a bioinformatics approach, utilizing the Library of Integrated Network-Based Cellular Signatures (LINCS L1000) toolkit (Subramanian et al., 2017). This publicly available dataset is an extension of the Connectivity Map (CMap), a resource of transcriptomic microarray data of four human cancer cell lines perturbed by 164 small drug molecules (Lamb et al., 2006). CMap was created as a tool to uncover associations between disease states and drugs that might go unnoticed from traditional high-throughput sequencing analyses. The NIH-funded LINCS project greatly expanded on CMap by the hybridization-based L1000 assay, which directly measured changes to gene expression for 978 landmark genes by various small molecules to infer changes for an additional 11,350 genes (Subramanian et al., 2017). We queried the top 100 and 150 up- and down-regulated genes induced by ethanol exposure against the LINCS L1000 dataset using the clue.io platform (https://clue.io) (Figure 10A). The query generated a list of small molecules predicted to have a positive or negative correlation to the input signature (i.e. small molecules predicted to either mimic or antagonize the transcriptional effects of ethanol). We were particularly interested in those chemicals with positive correlation to ethanol as they would give insight into the mechanism of ethanol teratogenicity and highlight potential co-factors that exacerbate ethanol teratogenicity.
Interestingly, cyclopamine, a hallmark Shh pathway inhibitor that inhibits the core Shh pathway protein Smootehend (Smo), was predicted to positively correlate with the ethanol signature. The Shh pathway is critical for midfacial development and mice deficient in Sonic Hedgehog (Shh) exhibit severe brain and face malformations, including holoprosencephaly and a single medial eye (cyclopia) (Chiang et al., 1996). In zebrafish, reduction of shh or null mutations in smo similarly results in severe loss of craniofacial midline structures (i.e. the anterior neurocranium) (Eberhart et al., 2006). Animal models have demonstrated ethanol is an environmental risk factor for holoprosencephaly, resulting in a characteristic set of midfacial defects, a hypomorphic forebrain, and in severe cases, cyclopia (Blader and Strahle, 1998; Cohen and Sulik, 1992; Hong and Krauss, 2017; Kietzman et al., 2014; Sulik et al., 1981). Thus, attenuation of the Shh pathway could mechanistically explain the vangl2-ethanol interaction.
Ethanol indirectly attenuates Shh signaling
To investigate the interaction of cyclopamine and ethanol, we first exposed wild-type zebrafish embryos to cyclopamine (50 μM) at shield stage (6 hpf) for 24 hours, mimicking the ethanol exposure window for the vangl2 mutants. Embryos were fixed at 4 dpf and the cartilage and bone were stained with Alcian blue and Alizarin red, respectively. We observed a range of midfacial defects with the most severe phenotype being a complete loss of the anterior neurocranium and reduced spacing between the eyes (Figure 10B). Since cyclopamine was predicted to mimic the effects of ethanol, we next combined this low dose of cyclopamine with the subteratogenic dose of ethanol. Strikingly, all embryos presented with synophthalmia or cyclopia and significant reductions and defects of the cartilages of the neuro- and viscerocranium (Figure 10B). To quantify this combinatorial effect, we measured the distance between the lenses and observed a significant reduction in co-exposed embryos relative to those exposed to either ethanol or cyclopamine alone (p<0.0001), suggesting a strong synergistic interaction (Figure 10C).

(A) Schematic representation of the LINCS L1000 query. Gene expression signatures, such as the top differentially expressed genes (DEGs) for a diseased or experimental state, can be queried against LINCS L1000. The query generates a rank-ordered list of experimental conditions, including small molecule compounds, that have similar or opposite signatures to the input signature. (B) Alcian blue and Alizarin red whole mount staining of untreated (control), cyclopamine-treated (50 μM), and ethanol- and cyclopamine-treated (1% ethanol plus 50 μM cyclopamine) wild-type embryos from 6 hpf to 4 dpf. Panels represent the spectrum of phenotypes observed for the treatment groups. Embryos were fixed at 4 dpf. Dorsal view, anterior to the left. (C) Quantification of the effect of ethanol and cyclopamine on the eye field. Inner lens-to-lens width was used as a morphometric measure of cyclopia. Both cyclopamine alone and cyclopamine and ethanol, were significantly different from controls (p<0.0001). (D) qRT-PCR of ptch2 in 10 hpf wild-type embryos. slc25a5 (solute carrier family 25) was used as a normalization control. (E) KEGG pathway schematic illustrating differential expression due to ethanol treatment in the sonic hedgehog (Shh) signaling pathway. Color coding indicates log2 fold differences due to ethanol treatment across all samples; red indicates upregulation due to ethanol, blue indicates downregulation due to ethanol. In the event that multiple genes from the dataset were annotated with the same pathway member, the log2 fold difference for the gene with the greatest absolute value for the difference was used.
In chick, ethanol exposure during somitogenesis has been proposed to suppress Shh signaling and induce apoptosis in cranial neural crest cells that make up the craniofacial skeleton (Ahlgren et al., 2002). However, work in zebrafish shows only a modest increase in cell death within the eye field at a much higher dose of 2% ethanol (Santos-Ledo et al., 2013). To ensure that cells in the eye field are not simply undergoing apoptosis, we performed a TUNEL cell death assay in ethanol-treated vangl2 mutants at 11 hpf, prior to optic vesicle evagination. As expected, we failed to detect an increase in apoptotic cells within the eye field in vangl2 mutants or their siblings (Figure 11). Thus, Shh-mediated pro-survival signals do not appear to be significantly disrupted by ethanol.

The number of positive cells in the eye field (indicated by dashed circle) was not higher in homozygous or ethanol-treated mutants. ant = anterior; nc = notochord
To test for a direct effect of ethanol on Shh signaling, we quantified the relative expression of ptch2, a canonical read-out of Shh pathway activity, at bud stage (10 hpf). Subteratogenic doses of ethanol had no effect on the expression levels of ptch2, consistent with RNA-seq results (Figure 10D). While cyclopamine significantly reduced Shh signaling (p = 0.0006), ethanol did not further reduce ptch2 levels significantly (p = 0.1115) (Figure 10D). KEGG analysis from the RNA-seq confirmed that ethanol does not affect the Shh pathway as a whole, nor does it reduce the levels of Shh target genes (i.e. gli, ptch) (Figure 10E). Thus, at normally subteratogenic doses, ethanol does not appear to directly attenuate Shh signaling.
Ethanol disrupts convergent extension
The ethanol-induced vangl2 mutant phenotype closely mirrors those in compound mutants between vangl2 and other Wnt/PCP pathway members (Heisenberg et al., 2000; Marlow et al., 1998). These double mutants display a further reduction in convergent extension, as evidenced by a shorter and broader body axis (Marlow et al., 1998). Based on these data, we hypothesized that ethanol disrupts convergent extension, which would mislocalize the Shh signal and result in eye defects.
We performed in situ hybridization on untreated and ethanol-treated vangl2 embryos to examine convergent extension and to test the hypothesis that the Shh expression domain is mislocalized in ethanol-exposed vangl2 mutants. We analyzed expression of shh in the axial mesoderm and paired box 2a (pax2a) in the midbrain-hindbrain boundary at bud stage (10 hpf) (Krauss et al., 1991). Ethanol was initiated at high stage (3.3 hpf), when vangl2 heterozygotes and homozygotes are equally sensitive to the effects of ethanol. We observed a gene and ethanol-dose dependent reduction in the length of the shh expression domain (extension) and an increase in the width of the pax2a expression domain (convergence) (Figure 12A).
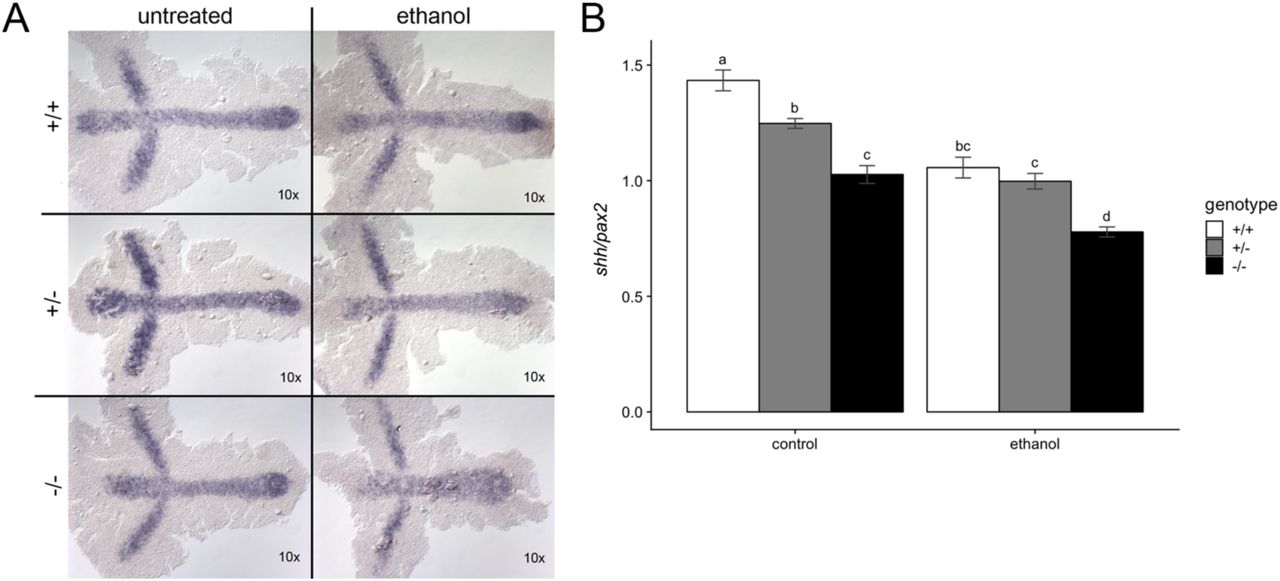
(A) vangl2 embryos were treated with 1% ethanol from 3.3 to 10 hpf. Embryos were subsequently harvested at 10 hpf for in situ hybridization with shha (midline) and pax2a (midbrain-hindbrain boundary) probes. Dorsal views, anterior to the left. (B) Quantification for the normalized shh/pax2a expression domains were calculated using the AxiovisionLE software. Two-way ANOVA followed by Tukey’s post-hoc test was used to analyze the results. Differences were observed between control genotypes and ethanol-treated homozygous mutants. Anterior to the left.
To quantify the effect of ethanol on convergent extension, we plotted the normalized expression values of shh/pax2 (Figure 12B). Post-hoc analyses (Tukey’s) revealed significant differences between untreated embryos across vangl2 genotypes, indicating that vangl2 gene dosage affects convergent extension (Figure 12B). Similarly, we found significant differences between ethanol-treated mutants and their heterozygous (p = 0.017) and wild-type siblings (p = 0.017). This observation confirms that loss of vangl2m209 results in reduced convergent extension movements, as evidenced by their short body axis. This phenotype was exacerbated with ethanol treatment, resulting in reduced convergent extension for vangl2 heterozygotes and homozygotes, compared to their untreated counterparts. While there was a trend, we did not observe a difference in convergent extension between ethanol-treated vangl2 heterozygotes and their wild-type siblings in their shh/pax2 ratio. However, synophthalmia occurred in ethanol-treated heterozygotes but not wild-type embryos, demonstrating that the nonsignificant reduction in convergent extension in the heterozygotes can have a phenotypic consequence.
Previous work in Wnt/PCP mutants suggests an indirect relationship between convergent extension defects and cyclopia (Marlow et al., 1998). For instance, a shorter expression domain for shh was noted for zebrafish homozygous for gpc4m119 relative to vangl2m209, despite the fact that vangl2 mutants had higher incidences of cyclopia (Marlow et al., 1998). The cyclopia phenotype was correlated with reduced anterior movement of the axial mesoderm expressing shh (Marlow et al., 1998). Thus, quantifying the distance between dlx3, which labels the neural plate border, and the anterior tip of shh, may be better suited to capture the effect in heterozygotes.
Ethanol alters six3 and rx3 expression in the eye field
Transcription factors involved in the specification of the eye field have also been implicated in the mechanism of eye field separation. The expression of three of these transcription factors, six3, rx3, and rx1, are altered by ethanol exposure (Santos-Ledo et al., 2013). We examined the effect of ethanol on six3a and rx3 in ethanol-treated vangl2 mutants at the initiation of optic vesicle evagination. In situ hybridization of six3a in 11 hpf embryos shows a heart-shaped expression pattern in the prospective forebrain. The caudal indentation marks the splitting of the eye field into bilateral domains (Fig. 2.13A). This expression pattern becomes more diffuse with loss of vangl2. In untreated homozygous mutants, we observed a shortening along the anterior-posterior (AP) axis and a broadening along the mediolateral axis at 11 hpf, consistent with the convergent extension defect. This expression pattern was further exacerbated in ethanol-treated mutants with complete loss of the caudal indentation. We observed a similar effect of genotype and ethanol on rx3 expression at mid-evagination (12 hpf) (Figure 13B). At this stage, rx3 is localized to the prospective forebrain and retina (Mathers et al., 1997). Ethanol-treated vangl2 homozygous mutants exhibit a compressed expression domain, clearly displaying a reduction in convergent extension. Our expression analyses suggest the eye field is specified but mis-localized and fails to separate into bilateral domains, likely due to defects in mesodermal migration.

Expression pattern of transcription factors that specify the eye field stained using whole mount in situ hybridization with (A) six3a at 11 hpf and (B) rx3 at 12 hpf. Dorsal views, anterior to the left.

Mutation in gpc4 exacerbates cyclopia in a dose-dependent manner. (A) Normalized read counts indicating expression of gpc4 across different subsets of the dataset. (B) qRT-PCR of gpc4 in 10 hpf wild-type embryos. actb1 (actin, beta 1), lsm12b (like-Sm protein 12 homolog b), and slc25a5 (solute carrier family 25) were used for normalization. (C) Alcian blue and Alizarin red whole- and flat-mount staining of untreated and ethanol-treated (1% ethanol) gpc4 homozygous mutants from 6 hpf to 4 dpf. Embryos were fixed at 4 dpf. Dorsal view, anterior to the left. (D) Functional analyses of vangl2;gpc4 double mutants. Enhanced cyclopia was observed in ethanol-treated vangl2;gpc4 double mutants with loss of at least one copy of either gene.
Mutation in gpc4 enhances cyclopia in a dose-dependent manner
Our data support a model in which ethanol interacts with vangl2 via a combinatorial disruption of convergent extension. One possibility is that ethanol disrupts the transcription of Wnt/PCP pathway members. The expression of gpc4 was modestly reduced in ethanol-treated embryos across the RNA-seq dataset (Fig. 2.4D). We plotted the normalized read counts across each time point from the RNA-seq experiment to further investigate the dynamics of the potential alteration in gpc4 levels. Ethanol exposure consistently downregulated gpc4 at 8 and 10 hpf, but the magnitude of the downregulation was relatively modest (Figure 14A). To statistically compare ethanol-treated and control embryos, expression of gpc4 at 10 hpf was investigated using qRT-PCR. This result demonstrated that gpc4 was not significantly affected by ethanol exposure (Figure 14B). Thus, direct transcriptional alteration to the Wnt/PCP pathway is unlikely to explain the ethanol-induced phenotypes in vangl2 mutants and heterozygotes.
If ethanol disrupts convergent extension, which leads to interactions with vangl2, then further genetic disruption to convergent extension should exacerbate the ethanol-vangl2 phenotype. Previous work in zebrafish has shown a functional interaction between vangl2 and gpc4, where vangl2;gpc4 double mutants were invariably cyclopic (Marlow et al., 1998). We conducted additional functional analyses to further examine the relationship between these two genes in the context of ethanol exposure (Figure 14D). Consistent with Marlow et al., double mutants were fully penetrant for cyclopia with or without ethanol. While ethanol did appear to alter the facial morphology of gpc4 mutants (Figure 14C), it did not cause cyclopia. However, embryos carrying 3 mutant alleles (either vangl2-/-;gpc4+/- or vangl2+/-;gpc4-/-) were greatly sensitized to ethanol-induced cyclopia. Collectively these data indicate that ethanol alters Wnt/PCP activity post-transcriptionally and that, in sensitized genotypes, this mispositions a source of Shh that is essential for separation of the eye field into bilateral primordia.
DISCUSSION
Despite its prevalence, the mechanism of ethanol-induced teratogenesis remains uncertain. Here we analyzed gene expression in the context of ethanol teratogenesis in wild-type embryos to shed light upon this mechanism. Subteratogenic doses of ethanol did not elicit physical malformations in a wild-type background but did in certain sensitized backgrounds (Swartz et al., 2014). The subteratogenic dose used here mimics an acute (binge-like) alcohol exposure roughly equivalent to a blood alcohol concentration of 0.19% in humans. Our data demonstrates that the effect of this dose of ethanol on the early transcriptome is mild; but nonetheless caused detectable transcriptional responses using a single embryo assay. Our study is unique from other transcriptome profiling studies, which often use a higher dose of ethanol to induce craniofacial and neurological malformations, resulting in large-scale cellular and transcriptional changes (Berres et al., 2017; Green et al., 2007). Phenotypic dysmorphology results in a wild-type background with high enough concentrations of ethanol (Blader and Strahle, 1998; Joya et al., 2014), which can easily alter gene expression, but which also cause widespread changes in cellular composition, which obfuscate pathogenic gene expression changes. By using a subteratogenic dose, we identified dominant modifiers of ethanol teratogenicity that co-vary with treatment across individuals.
WGCNA analysis identified two modules (mediumpurple4 and darkolivegreen4) of genes that are coordinately altered by ethanol exposure. The vast majority of genes that negatively correlate with ethanol exposure (membership in darkolivegreen4) encode zinc finger proteins (ZnF) located on chromosome 4. Ethanol has similarly been shown to downregulate Zinc finger protein, subfamily 1A, 4 in mouse fetuses exposed to ethanol during early development (Da Lee et al., 2004). However, the functional significance of these changes in ZnF proteins remains unknown and they often have diverse binding affinities and functions. The long arm of zebrafish chromosome 4 (Chr4q) is typically heterochromatic (condensed) and lacking in protein-coding genes (Howe et al., 2013). However, it is not late replicating until the end of gastrulation or bud stage (10 hpf) (Siefert et al., 2017). Previous work in zebrafish has found ZnF proteins on chromosome 4 to undergo robust expression from the initiation of zygotic transcription until mid-gastrula stage (White et al., 2017). Since many chromosome 4 genes are downregulated across ethanol-treated individuals during gastrulation, ethanol may interfere with replication timing, blocking the early-to-late replication switch, or chromatin remodeling. Based on these findings, the differentially expressed genes may follow disrupted expression of ZnF proteins due to chromatin remodeling.
As Vangl2 is a core member of the Wnt/PCP pathway, and the vangl2m209 mutant phenotype indicates dysfunction of this pathway, a simple explanation for ethanol-sensitivity in these mutants is that ethanol itself dysregulates the Wnt/PCP pathway. However, RNA-seq results indicated that at the transcriptional level, this is not the case. Although ethanol treatment induced differential expression of hundreds of genes with functional enrichment for oxidative stress and reduced cell division, these transcripts showed no overlap with the Wnt/PCP pathway. Transcriptional patterns did however resemble those induced by cyclopamine, a drug known to cause teratogenic phenotypes resulting from high or subteratogenic levels of ethanol exposure in wild-type and vangl2 mutants, respectively. Hence, although Wnt/PCP is not transcriptionally dysregulated by ethanol, differential expression was linked with both cellular stress and teratogenesis. To explain these results, we propose that ethanol leads to midfacial defects and cyclopia, not by dysregulating Wnt/PCP directly, but indirectly through inhibition of convergent extension and mislocalization of important developmental regulators like shha. In support of this hypothesis, we demonstrate that ethanol does indeed disrupt convergent extension and shha localization, with greater disruption observed in vangl2 mutants.
MATERIALS AND METHODS
Zebrafish (Danio rerio) Care and Use
Zebrafish were cared for using standard IACUC-approved protocols at the University of Texas at Austin. The wild-type AB strain was used for RNA-seq analysis. The chemically-induced vangl2m209 allele, originally described as trim209 (Jessen et al., 2002), was obtained from the Zebrafish International Resource Center (ZIRC) as reported (Swartz et al., 2014). The gpc4fr6 line was provided by Dr. Lila Solnica-Krezel. Adult fish were maintained on a 14h/10h light-dark cycle at 28.5°C. Embryos were collected and staged according to morphology and somite number (Kimmel et al., 1995). AB, vangl2m209, and gpc4fr6 embryos were treated with 1% ethanol or 50 μM cyclopamine in ethanol diluted in embryo media. For cyclopamine experiments, ethanol (vehicle) concentration in media was controlled for between treatment groups.
Sample collection and RNA extraction
Single embryos were manually dechorionated and collected in a 1.75 mL microcentrifuge tube with 500 mL of TRIzol reagent (Life Technologies, 15596-026). Embryos were homogenized with a motorized pestle (VWR, 47747-370) and stored at -80°C until RNA extraction. Total RNA was processed according to the TRIzol RNA isolation protocol. Samples were re-suspended with 50 μL of nuclease-free water and subsequently purified using the RNA Clean & Concentrator kit (Zymo, R1018). The concentration of each sample was determined using a Nanodrop spectrophotometer. The quality of total RNA was analyzed with the Agilent BioAnalyzer to ensure that the RNA Integrity Number (RIN) was ≥ 8. Samples were submitted to the Genomic Sequencing and Analysis Facility (GSAF) at the University of Texas at Austin. The GSAF performed standard RNA-Seq library preparations with poly-A mRNA capture.
RNA-seq data processing
Sequencing on the NextSeq 500 platform produced an average of 40.8 million ± 1.4 million (SE) raw paired end reads per sample. Adapter trimming was performed using Cutadapt with a minimum length of 25 bp (Martin, 2011). Following adapter trimming, we retained an average of 40.0 ± 1.3 million (SE) reads per sample. Genome Reference Consortium Zebrafish Build 10 (GRCz10) for D. rerio was downloaded from Ensembl (Aken et al., 2017). Trimmed reads were mapped to the reference using STAR (Dobin et al., 2013). Mean mapping efficiency was 78.2% ± 0.8% (SE). Following mapping PCR duplicates were removed using Picard (https://broadinstitute.github.io/picard/). Duplication rate was estimated at 85% ± 0.8% (SE). Sorting and conversion between SAM and BAM files was performed using samtools (Li et al., 2009). Reads mapping to annotated genes were counted with HTseq version 0.6.1p1 using the intersection nonempty mode (Anders et al., 2015). The final number of reads mapped to annotated genes was on average 3.9 ± 0.2 million reads per sample. Detailed instructions and example commands for implementing the data processing steps described above are available on Github (https://github.com/grovesdixon/Drerio_early_ethanol_RNAseq).
Differential expression analysis
Normalization and statistical analysis of read counts was performed using DESeq2 (Love et al., 2014). Factors included in the differential expression models were ethanol treatment (control, treated), developmental timepoint (8 hpf, 10 hpf, and 14 hpf), and sequencing batch (experiment 1 or experiment 2). Because none of the 6 hpf samples were treated with ethanol, these samples were not included. We tested for differential expression associated with ethanol treatment using likelihood ratio tests—comparing the model including all three factors to a reduced model that did not include ethanol treatment. To further examine stage-specific ethanol effects we split the samples by developmental timepoint and tested for ethanol effects within each group.
GO enrichment analysis
Enrichment of Gene Ontology (GO) terms for ethanol responsiveness was tested using two-tailed Mann-Whitney U-tests (Dixon et al., 2015) followed by Benjamini-Hochberg procedure for false discovery correction (Benjamini and Hochberg, 1995). The results were plotted as a dendrogram tracing hierarchical relationships between significant GO terms. The direction of enrichment (for upregulation or downregulation) was indicated by text color and significance of enrichment by font type. An advantage of this approach is that it does not require an arbitrary cutoff to provide counts of “significant” and “non-significant” genes as in typical enrichment tests.
Weighted Gene Correlation Network Analysis (WGCNA)
Gene expression data were further analyzed with Weighted Gene Correlation Network Analysis (WGCNA) (Langfelder and Horvath, 2008). For input into the analysis we used variance stabilized counts generated using the rlog function in DESeq2 (Love et al., 2014). Genes that were not sequenced across sufficient samples (4320 in total) were removed using the goodSamplesGenes function in the WGCNA package. Because there were no ethanol treated samples for the six hour timepoint, the five samples from this timepoint were removed before further analysis. To ensure sufficient expression for correlation detection, genes were further filtered based on a base mean expression cutoff of 5. We controlled for batch effects using the ComBat function from the R package sva (Leek and Storey, 2005). We selected a soft threshold of 15, where the scale free topology model fit surpassed 0.8. WGCNA was run with a minimum module size of 10. Following network analysis, we tested for GO enrichment within modules using Fisher’s exact tests.
Quantitative Real-Time RT-PCR (qRT-PCR)
To validate our RNA-seq data, we selected two genes to test using qRT-PCR. Total RNA was reverse transcribed using SuperScript™ First-Strand Synthesis System for RT-PCR (Invitrogen) with oligo-d(T) primers. qRT-PCR was performed with Power Sybr Green PCR Master Mix (Thermo Fisher Scientific, 4367659) on the Applied Biosystems ViiA™ 7 Real-Time PCR System. QuantStudio Real-Time PCR Software was used for data analysis using the 2-ΔΔCt method. The endogenous control lsm12b was selected based on its stable expression profiles across treatment and stage groups in the RNA-seq datasets.
Cartilage and Bone Staining and Measurements
Embryos were fixed at 4 days post fertilization (dpf) and stained with Alcian blue for cartilage and Alizarin red for mineralized bone (Walker and Kimmel, 2007). Whole-mounts of vangl2m209 embryos were captured using a Zeiss Axio Imager A1 microscope. To assess the degree of cyclopia, the distance between the medial edges of the lenses was measured using the AxiovisionLE software.
In Situ Hybridization
Antisense digoxygenin-labeled riboprobes for shha, pax2, dlx3, six3a (gift from Dr. Steve Wilson), and rx3 (gift from Dr. Steve Wilson) were used. Whole-mount in situ hybridization was performed as described {Miller:2000tt}. Images were captured using the Zeiss Axio Imager A1 and expression domains were measured using the AxiovisionLE software. An ANOVA and post-hoc Tukey’s test were used for statistical analyses.
TUNEL Staining
Whole-mount TUNEL staining was modified from (Lovely et al., 2016). Samples were fixed overnight in 4% paraformaldehyde in PBS (PFA) at 4°C. Samples were dehydrated in methanol and subsequently rehydrated in phosphate-buffered saline containing 0.5% Triton X-100 (PBTx). Samples were permeabilized with 25 ug/mL proteinase K (1mg/ml) in PBT for 30 min. After two, 5 min washes with PBTx, samples were fixed with 4% PFA for 20 min at room temperature. Residual PFA was removed with four, 5 min washes of PBTx. Samples were incubated with 50 μl of 1:10 Enzyme:TUNEL reagent (TdT and fluorescein-dUTP) (Roche, Cat No. 11684795910) at 37°C for 3 h in the dark. The reaction was stopped with two, 5 min washes of PBTx. Confocal images were captured with a Zeiss LSM 710.
ACKNOWLEDGEMENTS
We thank Dr. Steve Wilson for his kind contributions of the six3a and rx3 riboprobes. We also thank Dr. Lila Solnica-Krezel for providing the gpc4fr6 line. We are grateful to Angie Martinez for maintenance and care of all zebrafish lines.
Bibliography


