

Abstract
Although the biomass of chum salmon (Oncorhynchus keta) in the North Pacific is at a historical maximum, the number of individuals returning to Japan, the location of the world’s largest chum salmon hatchery program, has declined substantially over 25 years. To search for potential causes of this decline, we synthesized catch/release, sea surface temperature (SST), and published genetic data, namely, microsatellites, single nucleotide polymorphisms collected for efficient stock identification, lactate dehydrogenase (LDH) isozymes, and mitochondrial DNA (mtDNA) from 624 locations in the distribution range (n = 78,525). SST in the summer, when juveniles inhabit Japanese coasts, was found to be negatively correlated with adult return rates 2-5 years later (r = −0.69). Integration of neighbor-joining phylogenetic trees with genetic diversity data indicated that chum salmon originated in western Alaska and expanded its distribution southward, while analysis of microsatellite data suggested the introgression of neutral genomic loci from Japanese salmon into Russian and Alaskan populations. Hatchery operations have altered allele frequencies of nine diversifying genes related to reproduction, immune system function, DNA damage repair, growth and energy metabolism in Japanese populations. Thermally adapted LDH-A1*100 alleles, predominantly expressed in skeletal muscle, have often been replaced by ancestral alleles, while the ancestral mtDNA-B3 haplotype is significantly rarer in Japanese chum salmon. This genetic replacement should result in lower metabolic efficiencies in skeletal muscle and mitochondria at higher temperatures, thereby leading to the lower athletic performance and survival of juveniles in a warming climate.
1 INTRODUCTION
Pacific salmon has the longest history of artificial propagation, which started in the middle of the eighteenth century, and management of these species constitutes the world’s largest set of hatchery enhancement programs (reviewed by Naish et al., 2007). Hatchery release of chum salmon (Oncorhynchus keta) comprises the world’s largest marine stock enhancement and sea-ranching program (Amoroso, Tillotson, & Hilborn, 2017; Kitada, 2018). Canada, South Korea (hearafter, Korea), Russia, the United States and Japan currently operate Pacific salmon hatcheries in the North Pacific. According to North Pacific Anadromous Fish Commission statistics (NPAFC, 2020), the total number of chum salmon released into the North Pacific during six decades (1952–2019) was 137 billion, which included 90 billion juveniles (66%) released by Japan. Currently, ∼60% of chum salmon are of hatchery origin (Ruggerone & Irvine, 2018). The biomass of chum salmon is at a historical maximum in the North Pacific, whereas the proportion in Japan has steeply decreased (Supporting Information Figure S1).
Japan runs the world’s largest chum salmon hatchery release program (Supporting Information Supplemental Note). At present, 262 salmon hatcheries operate in Japan. Releases of chum salmon juveniles from Japan have increased remarkably since the 1970s—to ∼1.5 billion in 2018 (Supporting Information Figure S2). Supported by natural shifts in marine productivity, the number of chum salmon returning to Japan sharply increased after the 1970s (Beamish, Mahnken, & Neville, 1997). Nevertheless, the mean body weight of chum salmon returning to Japan during this time significantly decreased, thus suggesting intra- and inter-species density-dependent effects in the North Pacific (Ishida, Ito, Kaeriyama, McKinnell, & Nagasawa, 1993; Kaeriyama, 1998; Kitada, 2018). Despite continuous hatchery releases, the number of returning chum salmon steeply decreased after 1996, the year when the recorded catch reached a historical maximum of 81 million fish (Supporting Information Figure S2). The 1992 closure of high-sea salmon fisheries (Morita et al., 2006), which harvested a mixed stock of North American and Asian chum salmon populations (e.g., Beacham et al., 2009; Myers, Klovach, Gritsenko, Urawa, & Royer, 2007; Seeb et al., 2011; Urawa et al., 2009; Wilmot et al., 1998), might have been expected to increase the homing of mature fish to their natal rivers. A marked increase after the closure of the high-sea salmon fisheries was only observed in Russia, however, which suggests that the Sea of Okhotsk, an indispensable common feeding ground for juvenile chum salmon originating in Russia and Japan (Beamish, 2017; Mayama & Ishida, 2003), has been a favorable environment. This outcome further suggests that Japanese chum salmon may lose out to Russian chum salmon in the competition among juveniles for food in the Sea of Okhotsk. An increased abundance of hatchery fish may cause genetic changes and reduce the resilience of salmon populations to changes in their habitat induced by a warming climate (Beamish, 2017).
Salmonids are genetically the most well-studied non-model organisms (Waples, Naish, & Primmer, 2020). The genetic effects of hatchery-reared animals on wild populations are a major concern (e.g., Gharrett & Smoker, 1993; Laikre, Schwartz, Waples, & Ryman, 2010; Waples, 1991, 1999; Waples & Drake, 2004). Evidence exists that hatchery-reared salmonids breeding in the wild have been responsible for reduced survival rates (Reisenbichler & McIntyre, 1977; Reisenbichler & Rubin, 1999) and reproductive success (Araki, Cooper, & Blouin, 2007, 2009; Christie, Ford, & Blouin, 2014; Fleming et al., 2000; McGinnity et al., 2003). Genetic adaptation to hatchery environments is also known to occur (Christie, Marine, French, & Blouin, 2012; Christie, Marine, Fox, French, & Blouin, 2016; Le Luyer et al., 2017). Hatchery environments can favor certain genotypes associated with domestication when genes from farmed fish are substantially introgressed into hatchery broodstock (Hagen et al., 2019). In addition, artificial selection in hatcheries may drive maladaptation to climate change and act in a direction opposite to that of natural selection (Tillotson, Barnett, Bhuthimethee, Koehler, & Quinn, 2019). Enhanced growth of salmon juveniles due to the warming climate has enabled earlier migration to the ocean from freshwater, which can increase competition between wild and hatchery-released salmon (Cline, Ohlberger, & Schindler, 2019). Almost all chum salmon returning to Japan are hatchery-released fish—or possibly wild-born hatchery descendants (i.e., no real wild fish may exist)—and the significant decline in Japanese chum salmon populations may be due to a fitness decline in populations induced by genetic effects of long-term hatchery releases over 130 years (Kitada, 2020). Neverthless, no empirical study has examined mechanisms of fitness decline in hatchery fish in detail (Araki, Berejikian, Ford, & Blouin, 2008), and the causes of the rapid decline in the catches of Japanese chum salmon populations are unknown.
To search for mechanisms responsible for the catch decline in an evolutionary context, we synthesized catch/release and SST statistics and published genetic data sets of adult chum salmon collected from the species’ distribution range. We inferred the evolutionary history and selection of chum salmon by comparing the diversity and gene flow of neutral microsatellite markers and putatively adaptive SNPs among local populations on western and eastern sides of the North Pacific. We performed a meta-analysis of combined SNPs, isozymes and mtDNA allele/haplotype frequencies, which allowed us to look for a correlation between significant geographical clines in allele frequencies and changes in the distribution range. By examining allele frequencies with reference to latitude, we were able to identify genes significantly differentiating Japanese populations from those of other areas. Our analyses addressed the crucial question of why the biomass of Japanese chum salmon, which have the highest genetic diversity in the North Pacific, has been declining in the context of the evolutionary history of this species.
2 CHUM SALMON BIOMASS IN THE NORTH PACIFIC
2.1 Changes in catch in the North Pacific and Japan
To begin, we reviewed changes in regional catch statistics in the North Pacific. Chum salmon catch and release data were retrieved from NPAFC statistics (NPAFC, 2020). All analyses in this study were performed using R statistical software (https://www.r-project.org/). As revealed by changes in regional catches in the North Pacific, the number of hatchery-originated Japanese chum salmon, which occupied the bulk of the highest-ever recorded catch, 117 million fish in 1996, had drastically shrunk by 2019 (Figure 1; Supporting Information Table S1). In contrast, the total catch was relatively stable in Alaska, with some regional variation, while slight decreases were observed in southeastern Alaska (SEA), British Columbia (BC) and Washington (WA).
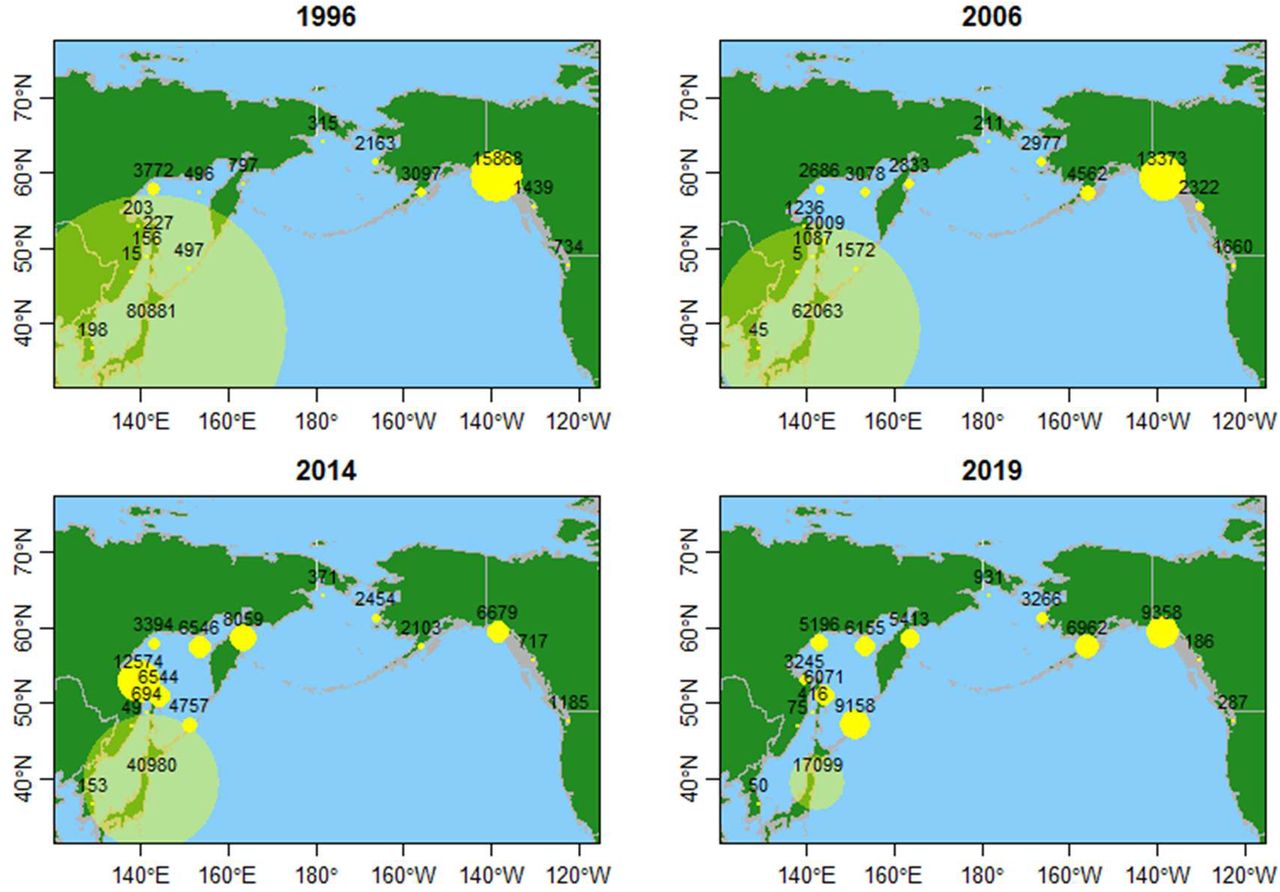
Changes in the chum salmon catch in the North Pacific over recent decades. Numbers (in thousands) are shown for 1996—the year of historical maxima in the North Pacific (117 million fish) and Japan (81 million fish)—and 2006, 2014 and 2019. Circle sizes are proportional to the number of salmon. Data are from the North Pacific Anadromous Fish Commission (www.npafc.org, accessed January 2020; NPAFC, 2020) and given in Supporting Information Table S1.
We analyzed trends in catches in Russian areas and Japan and Korea (1971–2019) (Supporting Information Figure S3). A Mann-Kendall trend test using the ‘MannKendall’ function in R confirmed that Russian catch trends after 1996, with the exception of southwestern Sakhalin, were all significantly positive, with remarkable increases in the catch identified in the following locations: eastern Kamchatka (τ = 0.68, p = 0.00004), Kuriles (τ = 0.73, p = 0.00000), western Kamchatka (τ = 0.73, p = 0.00000), Continental Coast (τ = 0.40, p = 0.00634), Sakhalin Coast (τ = 0.71, p = 0.00000), Amur River Basin (τ = 0.74, p = 0.00000), Primorye (τ = 0.61, p = 0.00004) and southwestern Sakhalin (τ = 0.25, p = 0.09650). Despite having the highest number of released fish, Japan was the only country in Asia exhibiting a significant decrease (τ = −0.65, p = 0.00001). Korea also experienced a decreased catch, but this decrease was insignificant (τ = −0.02, p = 0.90130). Chum salmon catches have significantly increased in all areas of Russia since 1996, while the catch has been decreasing in southwestern Sakhalin since around 2010. In 2019, substantial drops were observed on the Continental Coast, the Amur River Basin and Primorye. Korean catches have remained very small. Overall, long-term increasing trends were found in all areas of Russia since 1996, with a substantial drop observed only in Japan despite continuous releases of huge numbers of juveniles.
Next, we organized the number of released and returning chum salmon by area in Japan. The largest numbers of returning chum salmon were caught in the Sea of Okhotsk and on the Pacific coast of northern Japan, the latter affected by the cold-water Oyashio current. The catch in Iwate Prefecture was particularly notable in 1996, when the total catch in Japan was at a historical maximum of 81 million (Figure 2a; Supporting Information Table S2). In contrast, very small catches were obtained on the coast of the Sea of Japan, which is affected by the warm-water Tsushima current, and on the southern Pacific coast. In 2006, populations on the Pacific coast of Honshu rapidly decreased, whereas decreases on the Pacific coast of Hokkaido were insubstantial. Substantial declines occurred in all areas in 2014, particularly on the Pacific coast, with further shrinkage in 2019 even though the number of released chum salmon had been stable for two decades throughout Japan (Supporting Information Figure S4). In contrast, the Russian catch on Iturup Island markedly increased and reached a historical maximum of 8.3 million in 2019, which was equivalent to 55% of the total catch in Hokkaido (Figure 2a).

Changes in the number of chum salmon returning to Japan and sea surface temperatures (SSTs). (a) Numbers (in thousands) are shown for 1996 (the historical maximum catch year), 2006, 2014 and 2019 (including the catch on Iturup Island, Russia). Circle sizes are proportional to the number of salmon. Green dots show salmon hatcheries. Data are given in Supporting Information Table S2. (B) Mean SST anomalies in summer 2 to 5 years before return in Hokkaido and northern Honshu vs. the number of adult fish returning to Japan (Table 1). The dashed line shows the estimated regression line. Data are given in Supporting Information Table S3.
2.2 Correlation between SST and chum salmon catch on Japanese coasts
We updated our previous analysis of catch/release and SST (Kitada, 2018) with new data (2017– 2019) and extended our seasonal analysis using data summarized for spring (April– June), summer (July–September), autumn (October–December) and winter (January– March). SST data for four areas—Kushiro-Oki (Hokkaido Pacific coast), Hokkaido Sea of Japan coasts, Sanriku-Oki (Honshu Pacific coast) and Honshu Sea of Japan coasts—were retrieved from the Japan Meteorological Agency (http://www.data.jma.go.jp; accessed July, 2020). We averaged SSTs over the four areas for each season. The linear regression between the number of chum salmon returning to Japan and SST anomalies (Supporting Information Table S3) was examined using the R ‘lm’ function.
Linear regression of chum salmon catches on sea surface temperature (SST) anomalies (1996–2019)
Mean SST in spring (April–June) and summer (July–September) was negatively correlated with catch but not correlated in autumn (October–December) or winter (January–March) (Table 1). Almost all fish returning to Japan were 3 to 6 years old (Miyakoshi, Nagata, Kitada, & Kaeriyama, 2013); therefore, average SST values 2 to 5 years before the return year might be a reasonable explanatory variable corresponding to chum salmon juvenile stages. The average summer SST 2 to 5 years before return was significantly negatively correlated with catch (r = −0.69, t = −4.5, df = 22, p = 0.0002) and had the highest coefficient of determination (R2 = 0.48, F = 20.2, df = (1, 22), p = 0.0002), thus demonstrating that 48% of the variation in decreasing catch was explained by the summer SST (Table 1; Figure 2b). The results of our regression analysis suggest that warming SSTs reduced juvenile survival rates during summer in coastal waters, whereas SSTs in autumn and winter had no effect on survival rates of homing adults. Homing chum salmon frequently descended into deep water (>100 m) off the Sanriku coast, Honshu, from early October to December, which suggests that this behavior avoided high SSTs and helped minimize metabolic energy costs (Tanaka, Takagi, & Naito, 2000).
3 POPULATION STRUCTURE AND GENETIC DIVERSITY
3.1 Data sets
International sampling of chum salmon has been conducted cooperatively across its distribution range to establish baseline genotype data for effective genetic stock identification in high sea fisheries (e.g., Beacham, Candy, Le, & Wetklo, 2009; Seeb, Crane, & Gates, 1995; Seeb & Crane, 1999; Urawa, Azumaya, Crane, & Seeb, 2005; Urawa et al., 2009; Wilmot et al., 1994). Population structure has also been extensively studied using various markers, such as isozymes (Kijima & Fujio, 1979; Okazaki, 1982; Wilmot et al., 1994; Seeb, Crane, & Gates, 1995; Sato & Urawa, 2015; Seeb & Crane, 1999; Winans, Aebersold, Urawa, & Varnavskaya, 1994) and mitochondrial DNA (mtDNA) (Garvin, Saitoh, Churikov, Brykov, & Gharrett, 2010; Park, Brainard, Dightman, & Winans, 1993; Sato et al., 2004; Yoon al., 2008). Minisatellite (Taylor, Beacham, & Kaeriyama, 1994) and microsatellite markers (Beacham, Sato, Urawa, Le, & Wetklo, 2008; Beacham, Candy, Le, & Wetklo, 2009; Beacham et al., 2009; Olsen et al., 2008) and SNPs (Garvin et al., 2013; Sato, Templin, Seeb, Seeb, & Urawa, 2014; Seeb et al., 2011; Small et al., 2015) were also used. We screened the published literature and found several publicly available genetic data sets covering the distribution range of the species, including Japan. These data, which comprised microsatellites (Beacham et al., 2009), SNP genotypes (Seeb et al., 2011), isozyme allele frequencies (Seeb, Crane, & Gates, 1995) and mtDNA haplotype counts (Sato et al., 2004), were subsequently analyzed in this study.
The dynamics of neutral genetic markers are mainly controlled by genetic drift and migration. Neutral loci across the genome can be similarly affected by the evolutionary history of population expansion, whereas loci under selection often behave differently during adaptation to local environments (Luikart, England, Tallmon, Jordan, & Taberlet, 2003; Waples & Gaggiotti, 2006). Microsatellites can be used as neutral markers. The SNPs analyzed in the present study, which were originally chosen by Seeb et al. (2011) to improve the resolution of genetic stock identification (Smith, Elfstrom, Seeb, & Seeb, 2005; Elfstrom, Smith, & Seeb, 2007), are located on positively selected genes identified by scanning the genomes of humans and chimpanzees (Nielsen et al. 2005). The functions of these genes include immune responses and olfactory and chemosensory perceptions. We compared the population genetic structures of the two types of genetic markers, namely, microsatellites (Beacham et al., 2009) and SNPs (Seeb et al., 2011), to better understand the evolutionary history, environmental adaptation, and genetic effects of hatchery releases.
3.2 Methods
To infer the population structure of chum salmon, we used the bias-corrected GST moment estimator to compute pairwise FST (Nei & Chesser, 1983). Our previous coalescent simulations found that Nei and Chesser’s bias-corrected GST moment estimator performs the best among FST estimators when estimating pairwise FST values (Kitada, Nakamichi, & Kishino, 2017). Our previous simulations mimicking population colonization from a single ancestral population also demonstrated that Nei and Chesser’s GST estimator correctly traces population expansion history based on genetic diversity (Kitada, Nakamichi, & Kishino, 2020). After converting the SNP genotype data to Genepop format (Rousset, 2008), we computed genome-wide pairwise FST values (averaged over loci) using the ‘pop_pairwiseFST’ function in the R package FinePop2_ver.0.4 on CRAN.
Genetic variation is a critical measure for understanding population history (Prado-Martinez et al., 2013). To infer the evolutionary history of chum salmon, we used the expected heterozygosity (He) of a population as a measure. Because newly derived populations have had fewer opportunities for mutations to appear, they have smaller heterozygosity values compared with established populations. We computed the mean He of each population. For SNPs, He was computed using the ‘read.GENEPOP’ function in FinePop2_ver.0.4. A neighbor-joining (NJ) tree (Saitou & Nei, 1987) based on the pairwise FST distance matrix was inferred using the ‘nj’ function in the R package ‘ape’. Multi-dimensional scaling (MDS) was applied to the pairwise FST distance matrices using the ‘cmdscale’ function in R. We integrated He and pairwise FST values onto an unrooted NJ tree using a color gradient for population i rendered as rgb (1 − He0,i, 0, He0,i), where He0,i = (He,i − minHe)/(maxHe − minHe). This conversion represents the standardized magnitude of an He value at the sampling point, with colors ranging from blue to red (for the smallest and largest He values, respectively). For the data sets used in our analyses, we recorded approximate longitudes and latitudes of sampling sites based on the names of rivers and/or areas and maps from the original studies using Google Maps. Sampling locations with pairwise FST values smaller than a given threshold were connected by lines to visualize the gene flow between populations. For the analysis, R code was applied from Kitada, Nakamichi and Kishino (2020).
3.3 Evolutionary history of chum salmon and Japanese populations
Microsatellite allele frequencies of chum salmon were retrieved from the website of the Molecular Genetics Lab, Fisheries and Oceans Canada (https://www.pac.dfo-mpo.gc.ca/science/facilities-installations/pbs-sbp/mgl-lgm/data-donnees/index-eng.html, accessed on August 1st, 2020), whose data consisted of allele frequencies at 14 loci from 381 localities throughout the distribution range (n = 51,355) (Beacham et al., 2009). The data set comprised baseline allele frequencies throughout the Pacific Rim obtained from Canada, Korea, Russia, the United States and Japan (Supporting Information Table S4; see Beacham et al., 2009 for detailed sampling locations).
Calculated pairwise FST values based on these microsatellite data were 0.0185 ± 0.0103 (SD). In the unrooted NJ tree generated from this data set, four large regional population groupings were evident: (i) Japan/Korea/Southern Russia (Sakhalin, Amur and Primorye), (ii) Russia/Western Alaska/Yukon (Canada), and (iii) SEA/Northern BC and Alaskan Peninsula, and (iv) Southern BC/WA (Figure 3a). These results were generally in agreement with groupings based on minisatellite loci (Taylor, Beacham, & Kaeriyama, 1994) as well as the results of the original study (Beacham, Candy, Le, & Wetklo, 2009) based on chord distances (Cavalli-Sforza & Edwards, 1967). Interestingly, Japanese and Korean populations were tightly clustered together but closely related to Russian ones, thus demonstrating the within-population genetic similarity of Japanese/Korean populations and their genetic similarity to Russian populations. Integration of the unrooted NJ tree with genetic diversity values revealed that Japanese populations had the highest He (Figure 3b; Supporting Information Table S4). He was slightly lower in Russia and western Alaska; it was even lower in SEA/BC/WA and extremely low on Kodiak Island and in the Canadian Yukon. Chum salmon in the Sturgeon River on Kodiak Island were the most isolated and had the lowest He; this result is in agreement with previous research implying that this population is genetically isolated and that an insufficient number of generations has likely passed since the beginning of gene flow to adjacent populations (Petrou et al., 2014; Seeb, & Crane, 1999). The low genetic diversity observed at the edges of the NJ tree indicate that these groups have shallow population histories.

Population structure and genetic diversity of chum salmon based on microsatellite markers. (a) Unrooted NJ tree based on pairwise FST values estimated from 14 microsatellite loci of 381 populations (n = 51,355) (Beacham et al., 2009). (b) Unrooted NJ tree based on pairwise FST values overlaid with He values. The color of each population reflects the magnitude of He values. (c) Visualization of genetic diversity and population connectivity. Populations connected by yellow lines are those with pairwise FST < 0.01. Detailed sampling locations and He values are given in Supporting Information Table S4.
Focusing on the subtree of North American populations, we found that He was highest on the western Alaskan coast (Norton Sound North/Kuskokwim Bay/Northeast Bristol Bay) (Supporting Information Figure S5). As demonstrated by the fossil record and molecular data, Atlantic and Pacific salmon had diverged by the early Miocene after the opening of access to Arctic drainages (∼20 million years ago [mya]), and the three most closely related species—pink, chum and sockeye salmon—can be distinguished in the fossil record by 6 mya (McPhail, 1997; Montgomery, 2000; Waples, Pess, & Beechie, 2008). Active geologic history of northwestern North America in the Miocene might drive speciation of Pacific salmon (Montgomery, 2000; Waples, Pess, & Beechie, 2008). Our result was consistent with these results, suggesting that chum salmon originated in western Alaska and then expanded to the Yukon (Canada), the Chukchi Sea in the Arctic Ocean, the Alaskan Peninsula, SEA, BC and WA.
Three clusters were identified in the Asian subtree, namely, Japan/Korea, southern Russia (Sakhalin/Amur/Primorye) and northern Russia (Magadan/Northern Sea of Okhotsk/Kamchatka/Northeast Russia) (Supporting Information Figure S6a). The clear south-to-north He geographical cline suggests the introgression of Japanese chum salmon into Russian populations at neutral loci (Supporting Information Figure S6b). Using the criterion of pairwise FST < 0.01 (4Nm > 99, see Waples & Gaggiotti, 2006), we identified substantial gene flow between American and Asian populations. In addition, Japanese populations were found to be connected to Russian and Korean populations (shown as yellow lines in Figure 3c), implying a history of population expansion. When we used a slightly larger pairwise FST criterion, FST < 0.012 (4Nm > 82), Japanese populations were directly connected to western Alaskan ones (Supporting Information Figure S7). These results suggest that introgression of Japanese chum salmon into Russian and Alaskan populations has occurred. Genetic stock identification studies have determined that Japanese chum salmon represent 70% of mature chum salmon in the central Bering Sea (Urawa, Azumaya, Crane, & Seeb, 2009), with corresponding percentages of 23%– 40% in the eastern Bering Sea (Wilmot et al., 1998), 66% in the North Pacific and 37% in the Central Gulf of Araska (Beacham et al., 2009). Mature chum salmon originating from Hokkaido account for 86% of the mature population on the east coast of Kamchatka in August but only 13% in the southwestern Bering Sea (Seeb et al., 2011). According to estimates based on fin/operculum clipping marking studies, the straying rate of hatchery-reared Japanese chum salmon is ∼50% in Hokkaido (Kitada, 2020), a level consistent with the results of an otolith thermal-marking study of chum salmon in Alaska that found that 51% of fish were hatchery-origin strays (McConnell et al., 2018). The substantial level of mixing in the North Pacific and high straying rate of Japanese hatchery-reared chum salmon might cause introgression from Japan into Russian and American populations (see Supplemental discussion).
Increased genetic diversity, as assessed from microsatellites and SNPs, has been observed in stocked populations of lake trout (Valiquette, Perrier, Thibault, & Bernatchez, 2014; Ferchaud, Laporte, Perrier, & Bernatchez, 2018) and Atlantic salmon (Ozerov et al., 2016). According to the authors of those studies, one possible cause for the observed increase in genetic diversity is the fact that released seeds were produced from non-native broodstock. Transplantation from non-natal rivers has been found to influence the genetic characteristics of some Japanese river populations (Beacham, Candy, Le, & Wetklo, 2009). Huge numbers of chum salmon juveniles were transplanted into the Chitose River from all areas of Hokkaido during the 1960s and 1980s, and massive numbers of juveniles were then transferred from the Chitose Hatchery to almost all hatcheries in Japan (Kaeriyama and Qin, 2014). The Chitose Hatchery, established in 1888, is the oldest national hatchery in Japan (Kobayashi, 1980). We produced a statistical summary and found that 1.24 billion eggs were transplanted from hatcheries in Hokkaido to rivers in Honshu over 60 years between 1928 and 1985; the highest intensity was in the 1980s, when the Chitose Hatchery was a major source of transplantation (Supporting Information Table S5 and Figure S8). In 1985, when the first Korean chum salmon hatchery was constructed, 100,000 eggs were transferred to Korea from the Chitose Hatchery. This transplantation of eggs is a possible reason why Japanese chum salmon populations have the highest microsatellite genetic diversity.
A large population size, as seen in Japanese chum salmon (Figure 1), would increase the chance of mutations at neutral sites in the genome. The estimated size of the salmon genome is ∼3 × 10⁹ bp (Davidson et al., 2010). Mutation rates of genes may be lower in colder environments (Balloux, Handley, Jombart, Liu, & Manica, 2009; Koyano & Kishino, 2010), and a lower incubation temperature has been found to lead to a lower mutation rate in Atlantic salmon (Salmo salar) (Edvardsen, Leininger, Kleppe, Skaftnesmo, & Wargelius, 2014). The higher incubation temperature of Japanese chum salmon hatcheries (∼8°C) compared with natural streams (1.1–2.8°C) (Ando et al., 2014) could increase the mutation rate of neutral sites. In addition, the very high egg-to-release survival rate (∼90%) in Japanese hatcheries (Supporting Information Supplemental Note) might relax natural selection (Araki, Berejikian, Ford, & Blouin, 2008) and contribute to maintain mutations. A large number of parent fish have been used since the mid-1970s in Hokkaido (Kitada, 2014; Supporting Information Supplemental Note), which should also contribute to maintain the genetic diversity of populations (Kitada, 2018).
3.4 Environmental adaptation and hatchery-derived selection
SNP genotypes retrieved from the Dryad data repository included 58 SNPs from 114 samples throughout the whole distribution range (Supporting Information Table S6; Figure S9) (Seeb et al, 2011). We excluded five loci analyzed in the original study, namely, Oke_U401-220, Oke_GHII-2943, Oke_IL8r-272, Oke_U507-87 and a mtDNA-combined locus, thus leaving 53 SNPs in our analysis (n = 10,458). These SNPs are located on rapidly evolving genes (Elfstrom, Smith, & Seeb, 2007; Seeb et al., 2011).
Pairwise FST values based on SNP allele frequencies were 0.0531 ± 0.0362, which is 2.9-fold higher than values calculated from microsatellite markers (0.0185 ± 0.0103). Four large regional population groupings were evident in the unrooted NJ tree: (i) Japan/Korea, (ii) Russia, (iii) Alaska and (iv) the Alaskan Peninsula, SEA, BC and WA (Figure 4a). These results are generally in agreement with the findings of the original study (Seeb et al., 2009) that were based on pairwise FST values of θ (Weir & Cockerham, 1984). Consistent with microsatellite-based inferences, the SNP data indicate that the Sturgeon River population became isolated on Kodiak Island. The northernmost Russian population, in Anadyr, diverged from the Alaskan population and expanded to Kamchatka and Amur. Populations in Susitna, Alaska, were isolated and remained closely related to the population in Anadyr. Japanese populations branched off from Anadyr separately from those of Kamchatka and Amur, which are phylogenetically more closely related to Alaskan populations. Japanese populations further differentiated from the Anadyr population.

Population structure and genetic diversity of chum salmon based on SNP genotypes. (a) Unrooted NJ tree based on pairwise FST estimated from 53 loci of 114 populations (n = 10,458) (Seeb et al., 2011). (b) Unrooted NJ tree based on pairwise FST values overlaid with He values. The color of each population reflects the magnitude of He values. Arrows show inferred directions of population expansion. (c) Visualization of genetic diversity and population connectivity. Populations connected by yellow lines are those with pairwise FST < 0.01. Detailed sampling locations and He values are given in Supporting Information Table S6.
As inferred from the integrated NJ tree, the highest levels of He were found in Stuyahok, Mulchatna and Nushagak rivers in coastal western Alaska and the Meshik River in Bristol Bay South, while the lowest He values were observed in WA, Korea and Japan (Figure 4b; Supporting Information Table S6). Ascertainment bias might contribute to the high levels of allelic richness in Alaska; however, its effects were expected to be minimal within Alaskan samples, and tests comparing levels of diversity in the samples were deemed appropriate (Seeb et al., 2011). Analysis of the population structure inferred from SNPs suggested that chum salmon originated in coastal western Alaska/Bristol Bay South, a conclusion consistent with the microsatellite data. The species then expanded to Russia, the Chukchi Sea, Yukon/Kuskokwim, the Alaskan Peninsula, SEA/BC and WA and adapted to local environments. Using the same criterion used with microsatellite markers, namely, pairwise FST < 0.01 (4Nm > 99), we detected substantial gene flow within American populations but very little between Russian populations (Figure 4c). Japanese and Korean populations appeared to be isolated. When we used a slightly large FST criterion, pairwise FST < 0.02 (4Nm > 49), Russian populations were found to be connected with western Alaskan ones (Supporting Information Figure S10), which supports the hypothesis that chum salmon originated in western Alaska and expanded within Alaska and thence to SEA/WA and Asia. Many Japanese populations were found to be connected with the Namdae River, Korea, thus implying a history of translocation.
To summarize all of the above-mentioned results, we compared population structures and He obtained using neutral and adaptive markers. The MDS plot based on microsatellite loci uncovered gene flow between American populations and revealed the nested population structure of Japanese/Korean and southern Russian samples (Sakhalin, Amur and Primorye) as well as Japanese/Korean ones located close to northern Russian samples (Figure 5a). This result implies the occurrence of gene flow from Japan to Russia. He values were the highest in Japanese/Korean samples, followed by samples from Megadan (North Sea of Okhotsk) and East Kamchatka, Russia, suggesting introgression of Japanese chum salmon into these areas (Supporting Information Figure S11a). MDS of the SNP data (after Seeb et al., 2009) uncovered a pattern in the American and Russian populations similar to that revealed by microsatellites, whereas Japanese/Korean populations were isolated from Russia (Figure 5b). In contrast to population structure based on microsatellites, no introgression of Japanese/Korean alleles into Russian populations was suggested by the population structure of SNPs located on rapidly evolving genes. Instead, the two groups were separated from the others, namely, from the Alaskan group and the group constituting the Alaskan Peninsula, SEA, BC and WA. Because the genes harboring the analyzed SNPs were crucial to environmental adaptation, introgression of alleles from Japanese/Korean populations was not likely to have been successful. He values were the highest in Alaska with a clear latitudinal cline, implying the history of environmental adaptation (Supporting Information Figure S11b). Genetic effects due to hatchery-derived selection in Japanese/Korean populations were thus probably detected in our analyses.

MDS analysis of the population structure of chum salmon in the distribution range based on pairwise FST values inferred from (a) 14 microsatellite loci of 381 populations (n = 51,355) (Beacham et al., 2009) and (b) 53 loci of 114 populations (n = 10,458) (Seeb et al., 2011). Arrows show inferred directions of population expansion.
4 DETECTION OF GENES UNDERGOING HATCHERY-DERIVED SELECTION
4.1 Data sets
To explore genes affected by hatchery-derived selection and environmental adaptation, we performed a meta-analysis of combined SNPs, isozymes and mtDNA allele/haplotype frequencies. In addition to the SNPs analyzed above, we focused on LDH, an isozyme marker potentially useful for understanding physiological thermal adaptation and the evolutionary consequences of artificial selection in salmonids and marine fish populations (Chen, Farrell, Matala, & Narum, 2018; Nielsen, Hemmer-Hansen, Larsen, & Bekkevold, 2009). LDH-A and LDH-B genes are predominantly expressed in various fish species in skeletal muscle and the heart (Powers, Lauerman, Crawford, & DiMichele, 1991; Somero, 2004, 2010), respectively. The loci have two codominant alleles, and their allele frequencies exhibit clear latitudinal clinal variation (Karabanov & Kodukhova, 2018; Merritt, 1972; Powers, Lauerman, Crawford, & DiMichele, 1991; Somero, 2004, 2010). For comparative purposes, we used tripeptide aminopeptidase (PEPB), as this digestive enzyme of fish (Govoni, Boehlert, & Watanabe, 1986) may experience selection pressure in hatcheries. We also focused on haplotype frequencies of the mtDNA D-loop region because recent studies have inferred that this region functions in cold-temperature adaptation and energy metabolism (Nishimura et al., 2012), dNTP metabolism (Nicholls & Minczuk, 2014) and oxygen consumption (Kong et al., 2020).
We organized available allele frequencies of LDH-A, LDH-B and PEPB-1 isozymes in the Pacific Rim, namely, those collected in Japan (Kijima & Fujio, 1979; Okazaki, 1982), Japan and Russia (Winans, Aebersold, Urawa, & Varnavskaya, 1994), and Alaska, the Alaskan Peninsula, SEA/BC and WA (Seeb, Crane, & Gates, 1995). To avoid problems associated with standardization of electrophoretic bands obtained in different laboratories, we used the data from the two latter studies (Winans, Aebersold, Urawa, & Varnavskaya, 1994; Seeb, Crane, & Gates, 1995) because they used the same protocol (Aebersold, Winans, Teel, Milner, & Utter, 1987) and followed the genetic nomenclature of the American Fisheries Society (Shaklee, Allendorf, Morizot, & Whitt, 1990). These data were also used in another study (Seeb & Crane, 1999) that confirmed the presence of equal allele frequencies in the same rivers in Japan and Russia. All Japanese samples were caught in weirs in hatchery-enhanced rivers and hatcheries and were therefore hatchery-reared fish and/or hatchery descendants. In contrast, Russian samples were collected from natural streams; these fish were assumed to be wild because most Russian chum salmon were naturally maintained (Winans, Aebersold, Urawa, & Varnavskaya, 1994). Samples collected from three hatcheries were excluded from the North American samples (Seeb, Crane, & Gates, 1995). We obtained allele frequencies of the three isozyme loci in 81 chum salmon populations in the distribution range (n = 14,550) (Supporting Information Table S7 and Figure S12). Four alleles were found at the LDH-A1 locus, two of which were very minor and found in only seven populations. The LDH-B2 locus also had four alleles, but two were very minor and found in only three populations. The PEPB-1 locus had five alleles. We used the most common alleles—LDH-A1*100, LDH-B2*100 and PEPB-1*-100—in our meta-analysis of allele frequencies.
We also used published haplotype counts of the mtDNA D-loop region collected from 48 chum salmon populations in the distribution range (n = 2,162) (Sato et al, 2004). Haplotype frequencies of the mtDNA D-loop region were computed from the 48 chum salmon populations (Supporting Information Figure S13a). Among 30 haplotypes, the major ones were A1, B3, B13 and C1, with the B3 haplotype characterizing Alaska and Russia, B13 characterizing SEA/BC and WA, and C1 and A1 characterizing Asian populations (Supporting Information Table S8 and Figure S13b). All populations except for two Japanese populations possessed the B3 haplotype, and its frequency was fixed at 1.0 in Alaska. In humans, populations living in colder climates have a lower mtDNA diversity, and this genetic differentiation is correlated with temperature (Balloux, Handley, Jombart, Liu, & Manica, 2009). In a meta-genome sample, the lowest mtDNA 16S rRNA diversity was found from Antarctica (Koyano & Kishino, 2010). These findings coincide with observations that Japanese chum salmon, followed by Russian and American populations, have the highest haplotype diversity (Sato et al., 2004). When we computed haplotype diversity (Nei & Tajima, 1981) based on the 30 haplotype counts of the mtDNA D-loop region (Sato et al., 2004), it was lowest in Alaska and negatively correlated with latitude (r = −0.68) (Supporting Information Figure S14). These results indicate that the chum salmon mtDNA D-loop region may be thermal adaptive; they also suggest that the B3 haplotype was the ancestral, cold-adapted haplotype, with the other haplotypes derived by thermal adaptation.
4.2 Meta-analysis
We classified the allele/haplotype frequencies of the 53 SNPs, the mtDNA D-loop region and the three isozyme loci into six geographical groups (Japan/Korea, Russia, Alaska, Alaskan Peninsula, SEA/BC and WA) (Supporting Information Table S9). We used the minor alleles as the first alleles of all SNPs. Distributions of allele/haplotype frequencies in the six geographical groups exhibited different patterns (Supporting Information Figure S15). To detect significant geographical variations in allele frequencies in the distribution range, we conducted a principal component analysis (PCA) using the ‘prcomp’ function in R. Because the PCA identified differences between Japan/Korea and the other areas as a primary component (PC1), we performed a two-sample t-test of allele frequencies between Japanese/Korean and Russian/American samples for each marker using the ‘t.test’ function. The p-values were corrected for multiple comparisons by the method of Benjamini and Hochberg (1995) (BH) using the ‘p.adjust’ function in R. The second component (PC2) corresponded to a latitudinal cline among Russian/American samples. We therefore tested the significance of the correlation between allele/haplotype frequencies and latitudes within Russian/American samples using the ‘cor.test’ function for each marker. The p-values were again corrected by the BH method. We also added allele frequencies to sampling locations using the R package ‘sf’. We superimposed 95% confidence ellipses of allele/haplotype-frequency scatter plots on latitudes using the R package ‘ellipse’. We researched the functions of all 57 analyzed gene markers using the GeneCards database system (https://www.genecards.org/) and published literature. This information is summarized along with PC1, PC2 and PC3 eigenvectors in Supporting Information Table S10. Table S10 also includes adjusted p-values (−log10q) obtained from the latitudinal correlation analysis of allele frequencies within Russian and American samples and the two-sample t-testing of allele frequencies between Japanese/Korean and Russian/American samples.
4.3 Genes exhibiting latitudinal clines
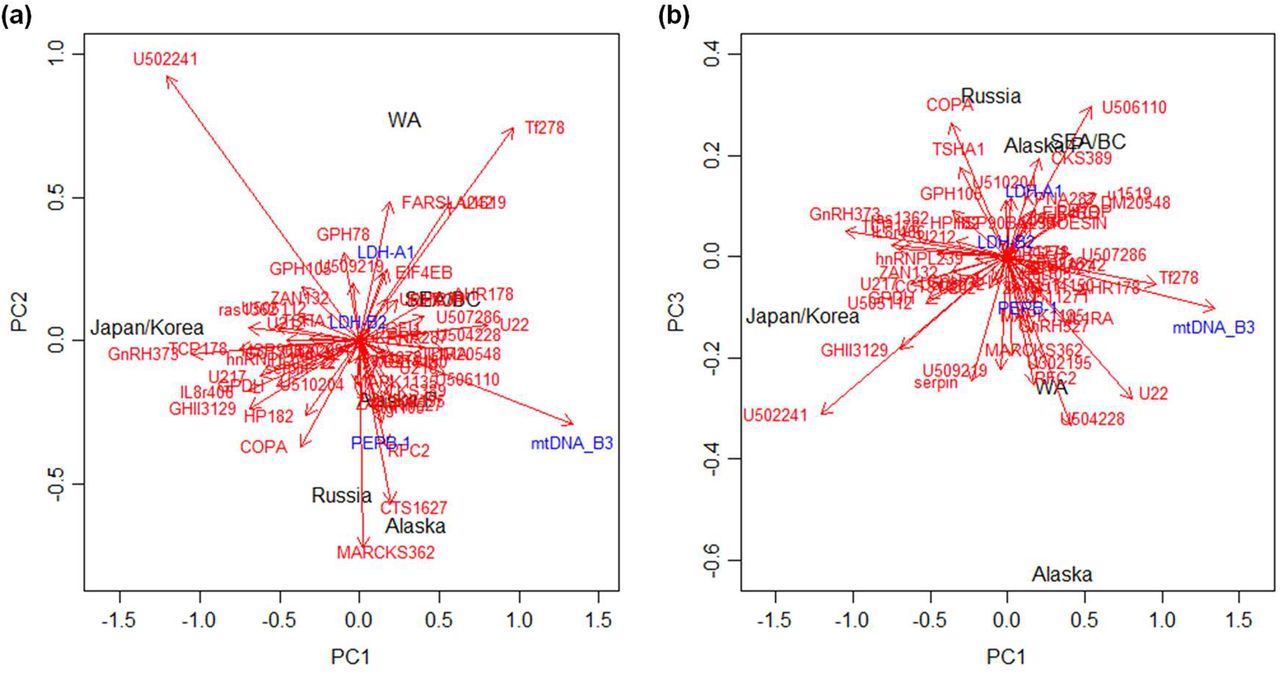
In the PCA, PC1 characterized the distinctiveness of Japanese/Korean populations, while PC2 located American and Russian populations in a latitudinal cline (Figure 6a). In contrast, PC3 highlighted the difference between Alaska and Russia (Figure 6b). PC1, PC2 and PC3 collectively accounted for 88% of the variance, explaining respectively 47%, 27% and 14%. PC1 comprised 13 SNPs (|eigen vector| > 0.15) that were highly differentiated in Japanese/Korean populations: Oke_U502-241*, Oke_GnRH-373, Oke_TCP1-78, Oke_IL8r-406, Oke_ras1-249, Oke_GHII-3129, Oke_u217-172, Oke_U505-112, Oke_DM20-548, Oke_U506-110*, Oke_u200-385 (U22), Oke_u1-519, Oke_Tf-278* and mtDNA_B3 (Figure 6a; Supporting Information Figure S16 and Table S10). In this list, locus names followed by an asterisk indicate five outlier SNPs identified as potential candidates for selection in the original study, while U and u designate unknown SNPs (Seeb et al., 2011). PC2 was formed by nine SNPs (|eigen vector| > 0.15) that were highly correlated with latitude: Oke_MARCKS-362, Oke_PP2A-635 (CTS1627), Oke_copa-211*, Oke_RFC2-618*, Oke_GPH-78, Oke_u1-519, Oke_FARSLA-242, Oke_Tf-278* and Oke_U502-241*. Although isozyme loci PEPB-1 and LDH-A1 had slightly smaller loadings for PC2 (−0.144 and 0.124, respectively), the correlation with latitude in American and Russian samples was highly significant. Finally, seven SNPs, namely, Oke_U504-228, Oke_U502-241*, Oke_u200-385 (U22), Oke_RFC2-618*, Oke_serpin-140, Oke_copa-211* and Oke_U506-110*, had large loadings for PC3 (|eigen vector| > 0.24) (Figure 6b).

Principal component analysis biplots of SNP/isozyme allele and mtDNA haplotype frequencies. (a) PC1 vs. PC2; (b) PC1 vs. PC3. Cumulative proportions are as follows: 47% for PC1, 74% for PC2 and 88% for PC3. The analysis was based on 53 SNPs in 114 samples (n = 10,458), three isozyme loci in 81 chum salmon populations (n = 14,550), and mtDNA D-loop region haplotypes collected from 48 chum salmon populations (n = 2,162) throughout the whole distribution range. Data are given in Supporting Information Tables S6–S9.
Consistent with our interpretation of the biplot, the allele frequencies of the top eight genes constituting PC1 (excluding unknown SNPs) in the Japanese/Korean populations were significantly different from those of populations in Russia and North America (Figure 7). Except for Oke_IL8r-406 and Oke_DM20-548, their clinal variation with latitude was also significant within Russia and North America. More precisely, six of the eight genes (mtDNA_B3, Oke_GnRH-37, Oke_TCP1-78, Oke_IL8r-406, Oke_ras1-249 and Oke_DM20-548) differentiated the Japanese/Korean populations, while Oke_GHII-3129 distinguished Japan/Korea and Alaska from the others. Oke_Tf-278* strongly distinguished Japanese/Korean and WA populations. The allele frequencies of the top eight genes contributing to PC2 generally displayed a clear clinal pattern in Russia, Alaska and the western coast of North America, although this clinal variation was insignificant in the case of Oke_GPH78 and Oke_HP-182 (Supporting Information Figure S17). Oke_PP2A-635 (CTS1627), Oke_RFC2-618* and LDH-A1 allele frequencies were fixed at or near 0 or 1.0 in southern areas (SEA/BC, WA and Japan/Korea), whereas those of LDH-A1 in Japan/Korea were similar to those of Russia and Alaska. In regards to the top two genes constituting PC3, the allele frequency of Oke_copa-211* was high in Russia and that of Oke_serpin-140 was high in Alaska and Japan (Supporting Information Figure S18). Geographical distributions of allele frequencies of the other 39 loci varied among the different markers (Supporting Information Figure S19). With respect to the five outlier SNPs found in the original study (Seeb et al, 2011), Oke_U502-241* was much more frequent in WA and Japan/Korea, while the frequency of Oke_U506-110* was higher on the Alaskan Peninsula and in SEA/BC, with the highest value, 0.92, observed in the Sturgeon River.
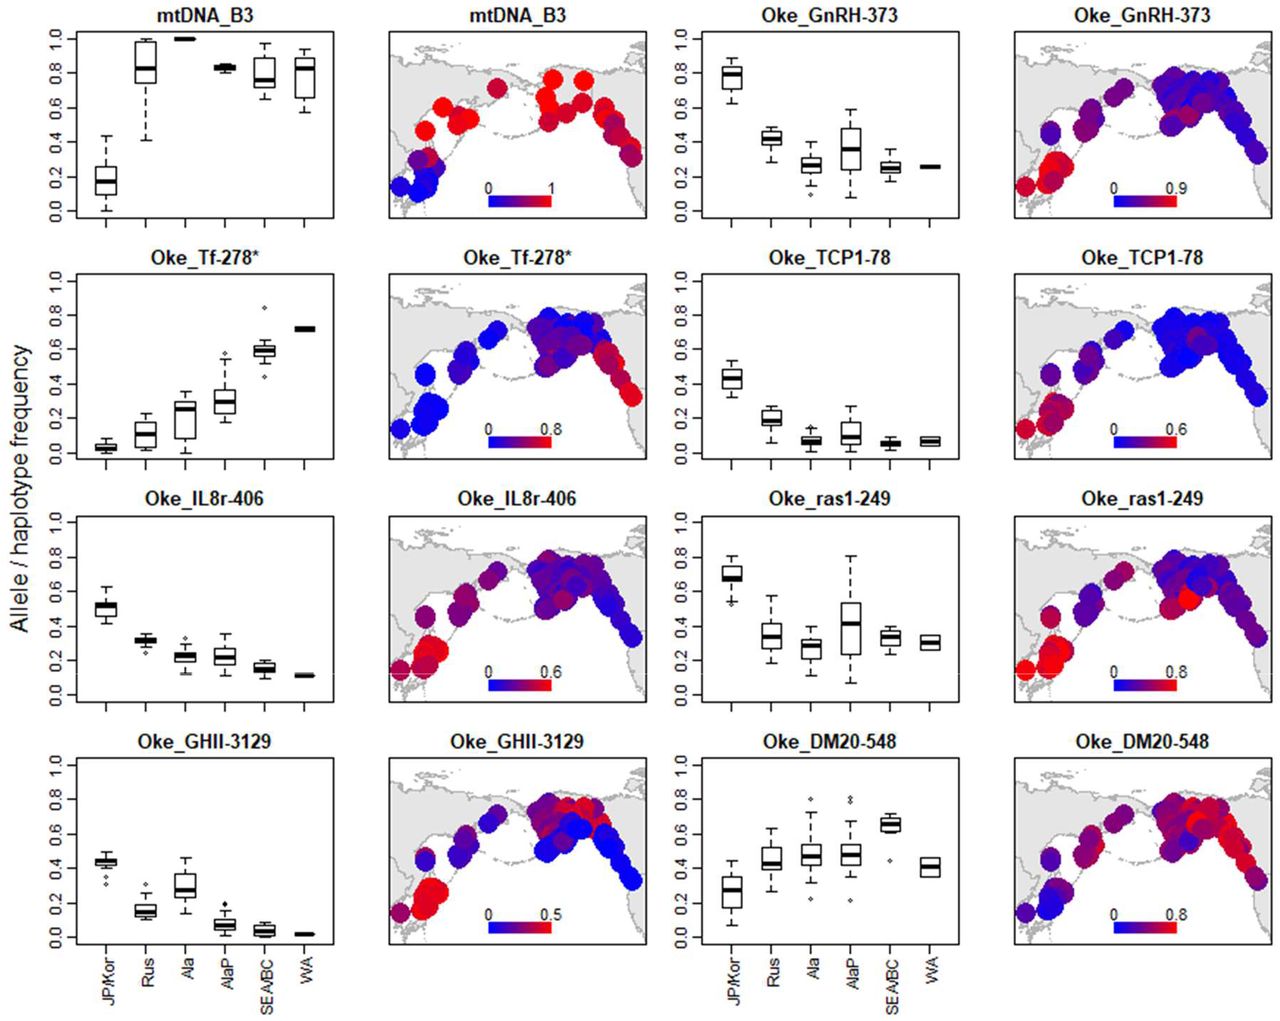
Geographical distribution of the top eight genes contributing to PC1 that differentiate Japanese and Korean chum salmon populations from other populations in the distribution range. Unknown SNPs were excluded. The plots are ordered according to the absolute eigenvectors of PC1, as shown in Supporting Information Figure S14 and Table S10.
By inspecting allele frequencies with reference to latitude, we identified nine genes (seven SNPs, mtDNA_B3 and LDH-A1) that differentiated Japanese/Korean populations from those of other areas (Figure 8). With respect to mtDNA_B3, Oke_GnRH-373, Oke_TCP1-78, Oke_IL8r-406 and Oke_ras1-249 latitudinal clines, Japan/Korea were isolated. In contrast, allele frequencies of Oke_Tf-278*, Oke_GHII-3129, Oke_serpin-140 and LDH-A1 in Japan/Korea became similar to those of Alaskan samples. All Japanese samples, which were collected from hatchery-enhanced rivers, were hatchery-reared fish and/or possibly hatchery descendants (Kitada, 2020), and the contribution of natural spawning was not substantial (Iida, Yoshino, & Katayama, 2018; Kitada, 2014; Miyakoshi et al., 2012; Morita, Takahashi,, Ohkuma, & Nagasawa, 2013). The altered allele frequencies could therefore have been caused by hatchery rearing repeated for more than 26 generations (assuming a generation time of 5 years for 130 years). The key functions of the nine genes were divided into five biological process categories—reproduction, immune system response, DNA damage repair, growth and energy metabolism—and analyzed (Table S10).

Nine genes characterizing the distinctiveness of Japanese/Korean chum salmon. The dotted circles show 95% confidence ellipses for the latitudinal cline exhibited by American and Russian samples. Colors of points in the panels correspond to the sampling locations indicated in Supporting Information Figures S9, S11 and S12. Gene functions and q-values for statistical tests are given in Table S10.
The SNPs in the data set used in the present study (Seeb et al., 2011) were previously characterized as rapidly evolving SNPs (e.g., located in genes related to immune response and olfactory and chemosensory perception; Nielsen et al. 2005). Determining the relative importance of selection on these specific loci would require a genome-wide analysis to be conducted (Waples, Naish, & Creig, 2020). A discussion of possible factors in hatcheries that have altered the allele frequencies of these SNPs might be useful in future analyses (Supporting Information Supplemental Discussion). Although presently undetected, selective pressure on DNA damage repair may be serious enough to cause unexpected deleterious genetic effects. Below, we focus on the thermal-adaptive mtDNA-B3 and LDH genes, which are related to energy metabolism, and discuss possible mechanisms for the catch decline in Japanese chum salmon.
5 HATCHERY-DERIVED SELECTION ON FITNESS TRAITS
Japanese/Korean populations had significantly smaller frequencies of the mtDNA D-loop B3 haplotype. The distribution of this haplotype followed a latitudinal gradient (Figure 8; Supporting Information Figures S13b), suggesting derivation of the B3 haplotype as an adaptation to warmer environments. The water temperature (∼8°C) widely used for egg hatching and fry rearing in Japanese chum salmon hatcheries is in fact generally much higher than that of natural streams in winter; for example, the temperature of the tributary of the Ishikari River, Hokkaido, is 1.1–2.8°C (Ando et al., 2014). The high egg-to-release survival rate (∼90%) in hatcheries could relax natural selection, particularly in winter. Given that the mtDNA D-loop region may have functions in dNTP metabolism (Nicholls & Minczuk, 2014), cold temperature adaptation and energy metabolism (Nishimura, Motoi, Niri, Hoshi, Kondo, & Watanuki, 2012) and oxygen consumption (Kong et al., 2020), relaxed selection pressures in hatcheries on this region might affect energy metabolism and oxygen consumption of chum salmon. In rearing experiments involving embryos and alevin of brook trout (Salvelinus fontinalis), a cold-adapted species, fry acclimated to 9°C were found to have a higher Michaelis–Menten constant of pyruvate  (lower substrate affinity = lower catalytic efficiency) than those acclimated at 5°C (Cook, Wilson, & Burness, 2018). Japan chum salmon reared at a higher water temperature than that of the natural environment might have a higher
  , resulting in lower mitochondrial metabolic efficiency and oxygen consumption compared with native individuals that lived there in the past.
LDH-A1*100 allele frequencies of chum salmon were distributed along a south-to-north gradient in Russian and American samples. Despite the observed significant latitudinal cline, the frequency in Japan was similar to that of Alaskan samples (Figure 8). LDH-A1*100 allele frequencies were higher in warmer areas and lower in colder environments (Supporting Information Figure S17). Exceptionally, LDH-A1*100 allele frequencies in Japan were significantly lower than in most American samples from SEA/BC and WA (Figure 8). Japan is located south of the other sampling locations, and a high LDH-A1*100 allele frequency, close to 1.0—the value for SEA/BC and WA—was therefore expected. In fathead minnow (Pimephales promelas), a temperate freshwater fish, the LDH-A locus has two codominant alleles: LDH-Aa and LDH-Ab (Merritt, 1972). A north–south cline in LDA-A allele frequencies is seen in fathead minnow, with higher frequencies of the southern-adaptive allele LDH-Aa and the northern-adaptive allele LDH-Ab in the south and north, respectively. At or above 25°C, the homozygote of the southern-adaptive LDH-A of fathead minnow, LDH-Aaa, has been found to have a significantly lower  (higher catalytic efficiency) than that of the northern-adaptive LDH-Abb and the heterozygote LDH-Aab (Merritt, 1972). Kilka (Clupeonella cultriventris), a small fish inhabiting brackish and fresh waters, also has two codominant alleles; LDH-A*100 frequencies are highest in its southernmost population and exhibit a clear south-to-north clinal pattern in its distribution range between 43° N to 59° N (Karabanov & Kodukhova, 2018) (Supporting Information Figure S20). Consistently, the LDH-A1*100 allele frequencies of chum salmon were fixed at or near 1.0 in SEA/BC and WA, thus suggesting that the LDH-A1*100 allele of chum salmon is southern-adaptive. Individuals homozygous for the LDH-A1*100 allele could have been expected in native chum salmon in Japan in the past, as they would have had a lower
  (higher catalytic efficiency) in warmer environments than heterozygotes and those homozygous for the other allele.
A single amino-acid substitution in LDH-A isozymes is sufficient for adaptation of species to a new thermal range (Fields & Somero, 1998; Somero, 2004). Repeated hatchery rearing in higher water temperature have likely have led to such substitutions in the LDH-A1 isozyme. Lowered LDH-A1*100 allele frequencies reduce the percentage of homozygotes and result in higher  (lower catalytic efficiencies) at higher temperatures—as demonstrated by experiments on fathead minnow (Merritt, 1972)—leading in turn to lowered athletic performance in skeletal muscle. Chum salmon currently inhabiting Japan and Korea that are LDH-A1*100 heterozygotes may therefore have a higher
  (lower catalytic efficiency) compared with native fish living in these locations in the past. A lowered catalytic efficiency becomes even lower at higher temperatures. In contrast, LDH-B2*100 allele frequencies are fixed at or near 1.0 in all present-day populations (Supporting Information Figures S15-2, S19-1). LDH-B2 is related to heart activity (Powers, Lauerman, Crawford, & DiMichele, 1991; Somero, 2004) and may therefore be conserved in this species. The north-to-south gradient of PEPB-1*-100 allele frequencies (Supporting Information Figure S17) suggests that hatchery rearing has not compromised digestive ability, which is consistent with the enhanced growth of hatchery fish fed copious amounts of food daily.
6 CONCLUSIONS
Our analysis indicated that warming SSTs may reduce juvenile survival rates during summer in Japanese coastal waters. According to integrated NJ trees based on microsatellite markers and SNPs, chum salmon originated in western Alaska, with the species range then expanding mainly to the south. Japanese populations had the highest genetic diversity at neutral markers. Past transplantation history, accumulated mutations in the large population and the large number of parent fish used for seed production may be responsible for the high genetic diversity. Very high egg-to-release survival rates (∼90%) in hatcheries can relax natural selection and work to maintain mutations. Our meta-analysis revealed that allele frequencies of many genes follow a latitudinal gradient, reflecting the evolutionary history of this species, while those of some genes in Japanese/Korean populations have become isolated. Our analysis first identified nine genes revealing the distinctiveness of the Japanese/Korean populations that might be altered by long-term hatchery operations. The key functions of these nine genes were divided into five biological process categories, namely, reproduction, immune system response, DNA damage repair, growth and energy metabolism. Altered allele frequencies of Oke_GnRH-373 in Japanese chum salmon populations may reduce ability to return to natal rivers and cause high straying (Supporting Information Supplemental Discussion), thus leading to introgression from Japan into Russian and Alaskan rivers, as found in neutral markers. LDH and mtDNA-B3 genes, which are related to energy metabolism and oxygen consumption, are thermal adaptive. The southern-adapted alleles of LDH-A1*100, predominantly expressed in skeletal muscle, have often been replaced by ancestral alleles, while the ancestral mtDNA-B3 haplotype is significantly rarer in Japanese/ Korean populations. This genetic replacement in thermally adapted genes may result in lower metabolic efficiencies in skeletal muscle and mitochondria at higher temperatures. Field experiments have demonstrated that Japanese hatchery fish have lower athletic ability (Kobayashi & Ohkuma, 1983; Sasaki, 2018) and lower metabolic efficiency (Shimizu et al., 2016), and our observations of YouTube videos consistently indicated the slow movement of Japanese chum salmon (Supporting Information Supplemental Discussion). Such physiological changes may reduce survival rates of hatchery-born juveniles on Japanese coasts in the face of warming SSTs and also in the Sea of Okhotsk, where competition for food is expected to be high because of substantially increased Russian chum salmon abundance. Almost all chum salmon returning to Japan are hatchery-released fish or possibly wild-born hatchery descendants (Kitada, 2020) that have distinct genetic characteristics, as demonstrated in this study. Japanese chum salmon populations may thus continue to decline, with variations, under current hatchery practices, as reduction in survival rates of hatchery-reared fish is cohort-specific and constant over time within a cohort (Kitada et al., 2019). Our results, which were obtained from the world’s largest marine stock enhancement program, should inform our understanding of long-term impacts of animal artificial propagation, including that of salmonids and marine and freshwater species, for fisheries and conservation objectives.
CONFLICT OF INTEREST
None declared.
AUTHOR CONTRIBUTIONS
S.K. and H.K conceived the study, analyzed the data and wrote the manuscript.
DATA AVAILABILITY STATEMENT
The authors affirm that all data necessary for confirming the conclusions of this article are present within the article, figures and supporting information.
SUPPORTING INFORMATION
Additional supporting information may be found online in the Supporting Information section.
ACKNOWLEDGMENTS
This research was heavily dependent on SNP genotypes of chum salmon throughout the distribution range maintained by Lisa W. Seeb and her colleagues and also relied on North Pacific baseline microsatellite allele frequencies maintained by Terry D. Beacham and his colleagues at Fisheries and Oceans Canada. We also thank scientists and staff members who contributed to the collection of samples over the past three decades. We express our appreciation to Craig Primmer for his encouragement and constructive comments on an early version of the manuscript, which improved the paper substantially. This study was supported by Japan Society for the Promotion of Science Grants-in-Aid for Scientific Research KAKENHI (nos. 18K0578116 to SK and 19H04070 to HK). We thank Barbara Goodson, Edanz Group, for editing the English text of a draft of this manuscript.
Footnotes
We newly analyzed published allele frequencies of 14 microsatellite markers collected from 381 locations in the distribution range (n = 51,355). We compared the population genetic structures of the microsatellites and SNPs, to better understand the evolutionary history, environmental adaptation, and genetic effects of hatchery releases.
REFERENCES


