

Abstract
SMN functions via recognition of arginine symmetric-dimethylated proteins by its Tudor domain, and scarcity of SMN leads to Spinal Muscular Atrophy (SMA). Here we report a potent and selective antagonist targeting the Tudor domain of SMN. This compound could inhibit the interaction between SMN and R1810me2s-POLR2A mimicking the SMN depletion results, thus this SMN antagonist could be used as an efficient tool to better understand SMN’s biological functions and molecular etiology in SMA.
SMN is a core component of the SMN complex, which is essential for biogenesis of small nuclear ribonucleoproteins (snRNPs) by assembling the heptameric Sm ring onto spliceosomal snRNA1. The Tudor domain of SMN (Fig. 1a) binds to arginine symmetric-dimethylated (Rme2s) Sm proteins, and this interaction plays a critical role in snRNP assembly2,3. Homozygous deletion or mutation of SMN coding gene is responsible for SMA4, the most common genetic cause of infant death with a frequency of 1 in ~10,000 births5. In addition to its role in snRNP assembly, SMN is also involved in regulation of nuclear architecture6,7, local axonal translation in neurons8 and transcription termination9. SMN interacts with symmetric-dimethylated R1810 at the C-terminal domain (CTD) of RNA polymerase II (RNAP II) subunit POLR2A (R1810me2s-POLR2A) via its Tudor domain to regulate transcription termination9. In the SMA patients, abnormal transcription termination such as pause of RNAP II and R-loop (DNA-RNA hybrids) accumulation in the termination region may facilitate neurodegeneration9. All in all, SMN functions in different biological pathways, and the Tudor domain of SMN plays a critical role in executing these functions by mediating arginine methylation dependent interactions.

a, Domain structure of SMN. b, Molecular structure of compound 1. c, Binding affinities of compound 1 to selected modified histone readers measured by ITC. d, Binding affinities of different compounds to the Tudor domains of SMN and UHRF1 by ITC.
In spite of the extensive study of SMN and its associated SMA disease, it is still unclear how SMN protects motor neurons in the spinal cord against degeneration. To this end, we set out to design SMN-selective chemical probes that would specifically occupy the methyl-arginine binding pocket and disrupt the Tudor domain-mediated and arginine methylation-dependent interactions. In this study, we obtained an SMN-selective antagonist by serendipity when we tried to screen inhibitors against the histone H3K9me3 binding tandem Tudor domain (TTD) of UHRF1 (Fig. 1b and Supplementary Fig. 1a). In this fluorescence-based peptide displacement screen for UHRF1, we found 5 hits, among which compound 1 was confirmed by Isothermal Titration Calorimetry (ITC) (Kd ~16 µM, Supplementary Fig. 1b and 1c). As we know, many proteins bind to lysine and arginine methylated histones/proteins, including the Tudor Royal superfamily (Tudor, Chromodomain, PWWP and MBT) of proteins and some CW and PHD domain containing proteins10–13, and all of these proteins utilize an aromatic cage to recognize the methyl-lysine or methyl-arginine residue. In order to investigate the binding selectivity of compound 1, we screened it against selected methyl-arginine or methyl-lysine-binding Tudor domains and methyl-lysine-binding non-Tudor domains (Fig. 1c). UHRF1_TTD was the only assayed methyl-lysine binder that measurably bound to compound 1. Intriguingly, compound 1 bound more tightly to the Tudor domains of SMN, SMNDC1, and TDRD3 than to UHRF1_TTD (Fig. 1c and Supplementary Fig. 2). SMN, SMNDC1 and TDRD3 are the only three known methyl-arginine binding single Tudor proteins. Moreover, the highly homologous Tudor domains of SMN and SMNDC1 bound to compound 1 with a ~4-fold selectivity over that of TDRD3 (Fig. 1c).
In order to understand the structural basis of the compound 1 recognition by these reader proteins, we determined the crystal structures of compound 1 in complex with SMN, TDRD3 and UHRF1, respectively (Fig. 2, Supplementary Figs. 3/4 and Supplementary Table 1). In the SMN-compound 1 complex structure, compound 1 bound to the aromatic cage formed by W102, Y109, Y127 and Y130, which otherwise accommodates dimethyl-arginine (Fig. 2a-2c). W102 and Y130 sandwich the compound 1 rings. In addition, compound 1 forms a hydrogen bond between its imine group and the side chain of N132. This hydrogen bond boosts the ligand binding ability of SMN because mutating N132 to alanine significantly reduced its binding affinity (Fig. 2e). In the TDRD3-compound 1 structure, the binding mode is largely conserved (Supplementary Fig. 3), but Y566 of TDRD3 might not stack against the compound as effectively as W102 in SMN (Fig. 2d and Supplementary Fig. 5), which may explain weaker affinity of TDRD3 (Fig. 1c). Although we did not determine the corresponding complex structure of SND1, structure-based sequence alignment revealed that the W102 position of SMN corresponds to F740 of SND1 (Fig. 2d and Supplementary Fig. 5). The W102F SMN mutant, like SND1, bound to compound 1 only weakly (Fig. 2e). In addition, W102A and Y130A mutants of SMN did not bind to compound 1 (Fig. 2e). This lack of binding is consistent with our failure to observe binding for the other tested proteins. Additional considerations apply to UHRF1 and will be discussed later. On the other hand, cage mutations Y109A and Y127A weakened, but did not abrogate binding to compound 1 (Fig. 2e). Hence, the sandwich stacking interactions of compound 1 by W102 and Y130 play a critical role in the compound 1 recognition.
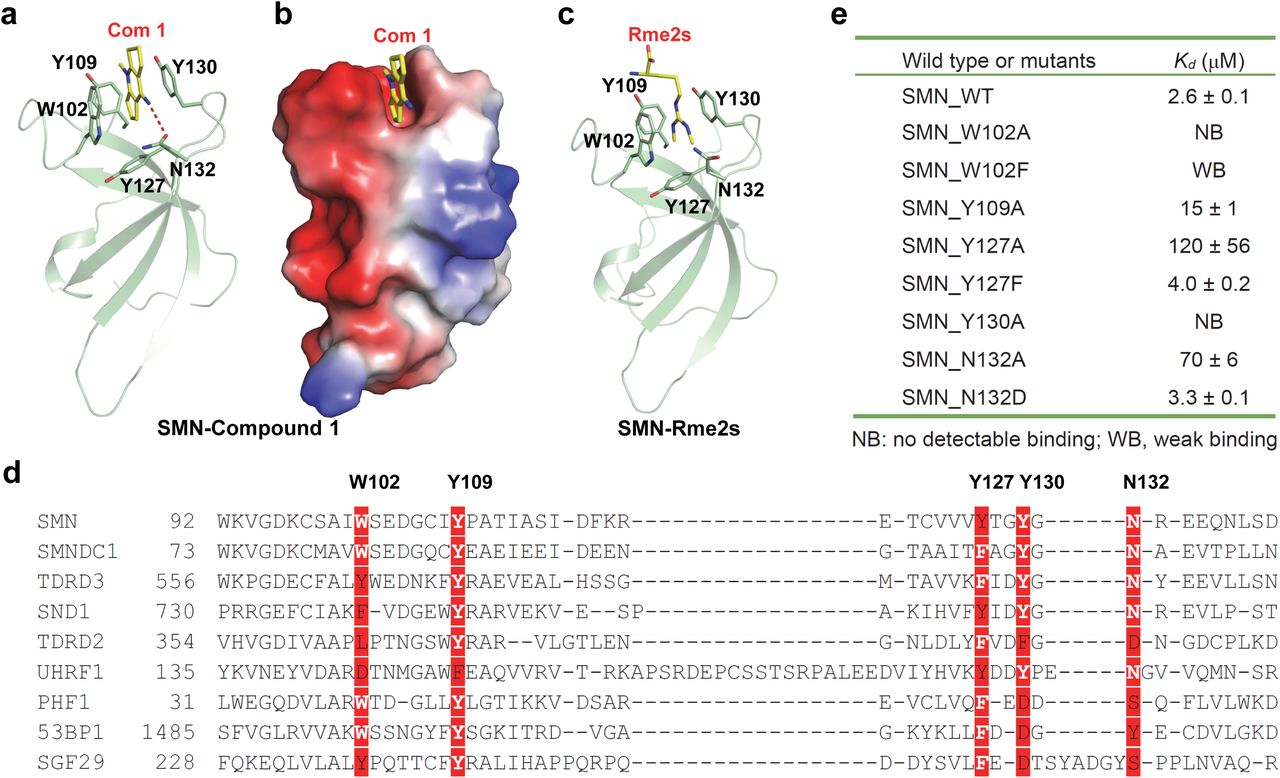
a, Complex structure of Tudor domain of SMN and compound 1 shown in cartoon mode. The Tudor domain of SMN is colored in green, with the interaction residues shown in stick and inter-molecular hydrogen bonds indicated by red dashes. b, Electrostatic potential surface representation of Tudor domain of SMN and compound 1 complex. c, Complex structure of Tudor domain of SMN and Rme2s shown in cartoon mode. d, Sequence alignment of selected Tudor domains. The compound 1 interacting residues are highlighted in red background. e, Binding affinities of compound 1 to different SMN Tudor mutants determined by ITC. Structure figures were generated by using PyMOL. Surface representations were calculated with the built-in protein contact potential function of PyMOL.
To uncover the specific interaction between UHRF1_TTD and compound 1, we also solved the complex structure of UHRF1_TTD-compound 1 (Supplementary Fig. 4). Two UHRF1_TTD molecules are present in each asymmetric unit of the UHRF1-compound 1 complex structure (Supplementary Fig. 4a), but we only observed the expected disc-shaped electron density of compound 1 in the histone H3K9me3-binding cage of one UHRF1_TTD molecule, while we found a differently shaped blob in the aromatic cage of the other protein chain (Supplementary Fig. 4b). In the complex structure of UHRF1_TTD-PHD and an H3K9me3 peptide (PDB code: 3ASK), the arginine residue R296 in the linker between the TTD and PHD of UHRF1 is found in a pocket formed by D142, E153, A208, M224, W238 and F278 from both TTDN and TTDC14 (Supplementary Figs. 1a and 4c). R296 is fixed in the pocket by forming two salt bridges with D142. Intriguingly, we found the expected disc-shaped density peaks consistent with compound 1 in the arginine-binding pockets of both UHRF1_TTD chains. The compound 1 molecule is stacked between the indole ring system of W238 and the guanidinium group of R209 (Supplementary Fig. 4d).
Several lines of evidence suggested that the arginine binding pocket is the major binding site and the methyl-lysine-binding aromatic cage is just a minor or non-specific binding site: 1. When we mutated the aromatic cage residues that have been shown to be critical for histone H3K9me3 binding to alanine, the binding affinity is not affected significantly. In contrast, when we mutated the arginine binding pocket residues, the binding is totally disrupted (Supplementary Fig. 4e). 2. The electron density inside the H3K9me3 aromatic cage is either smear and can be modelled in multiple orientations of compound 1, which implies that compound 1 does not bind to the cage specifically, or is of no defined density shape (Supplementary Fig. 4b). 3. The aromatic cage has a propensity to accommodate small molecules non-specifically. For instance, some buffer molecules have been found in the aromatic cage of TDRD315. For the case of UHRF1_TTD, some ethylene glycol molecules from the crystallization buffer are found in the H3K9me3 aromatic cage and the arginine pocket of the apo-UHRF1_TTD structure16 (Supplementary Fig. 4f). 4. In the SMN-compound 1 complex structure, compound 1 is stacked between the aromatic rings of W102 and Y130. However, the three aromatic residues in the aromatic cage of UHRF1 are perpendicular to each other, which could not stack the compound like SMN does (Supplementary Fig. 4g). Taken together, UHRF1 used the arginine binding pocket to specifically bind to compound 1, and this arginine binding pocket could serve as a novel therapeutic venue for designing potent small molecule allosteric regulators of the UHRF1 functions.
To explore structure-activity relationship between SMN and compound 1-like compounds, we procured commercially available analogs that include single, double and triple ring molecules and measured their affinities toward SMN and UHRF1, respectively (Fig. 1d). SMN bound to all four triple-ring compounds with affinities between 2.6 μM to 31 μM (Fig. 1d and Supplementary Fig. 6). The ligands have a 4-aminopyridine core in common, and none of these analogs are more potent than the original hit. A plausible orientation of compound 1, given the electron density, would entail a hydrogen bond between the 4-amino group and N132. Due to the electronic similarity between the N-methyl and 4-amino sites on the 4-aminopyridine core, we did not expect to resolve the orientation of compound 1 based on electron density alone, and could not exclude the possibility that the amino group would instead protrude into the solvent. Binding of 1-substituted pyridine cores to SMN would confirm that N132 does interact with the amino group and substituents on the pyridine nitrogen would point away from the Tudor domain, as larger 1-substituents would otherwise clash inside the aromatic cage. Indeed, our crystal structure of SMN in complex with compound 4 confirms that the imine group of compound 4 forms a hydrogen bond with N132 (Supplementary Fig. 7a and 7b).
In addition to compounds 1 and 4, SMN also bound to two of twelve double ring compounds, compounds 5 and 6 (Fig. 1d and Supplementary Fig. 6). Both compounds retain the amino/imino group, which pinpoints the importance of the amino/imino group-mediated hydrogen bond in the compound binding and is consistent with our crystal structures of SMN in complex with compounds 1, 4, and 6 (Fig. 2 and Supplementary Fig. 7). None of the single ring compounds bound to SMN, which may not be able to provide strong enough π-π stacking interactions to hold the compounds. UHRF1, however, did not bind to any other three-ring compounds, because the substituents on the pyridine nitrogen of these compounds are too large for the more enclosed arginine binding pocket of UHRF1.
We previously showed that R1810 in the CTD of the mammalian RNAP II subunit POLR2A is symmetrically dimethylated by PRMT5 and the R1810 methylated CTD directly recruits the Tudor domain protein SMN, which might contribute to the assembly of an R-loop resolving complex on the RNAP II CTD9. Hence, we asked whether these small molecule antagonists might be able to disrupt the interaction of SMN with RNAP II in vivo. To test this possibility, we treated the HEK293 cells with 20 to 40 µM of either compound 1 or compound 2 for 72 hours, and then performed immunoprecipitations using the cell extracts, which showed decreased levels of interaction between POLR2A and SMN, whereas no significant effect was observed for the cells treated with DMSO as a control (Fig. 3a). These results demonstrate the inhibitory effects of the SMN-RNAP II interaction by the SMN small molecule antagonists. Since 20 µM of either compound 1 or compound 2 is enough to show significant inhibition of the interaction between SMN and POLR2A, we used this concentration in the following assays.

a, SMN antagonists disrupt SMN binding to RNAP II. IP-western blot experiments were performed by using the indicated antibodies in HEK293 cell extract treated with indicated concentration of compound 1, compound 2 or DMSO for 72 h. b, Schematic of ACTB gene. c, SMN antagonists reduce SMN association at ACTB gene locus. Quantification of SMN qPCR data from ChIP experiments using SMN antibodies at the indicated ACTB primer positions in HEK293 cells. The SMN levels in DMSO controls were set as 100%. d, SMN antagonists lead to RNAP II pause. Quantification of RNAP II qPCR data from ChIP experiments using POLR2A antibodies at the indicated ACTB primer positions in HEK293 cells. e, SMN knock-out (KO) leads R-loop accumulation. Representative single-plane images of Z-stacks of R-loop levels in scramble vs SMN KO cells. f, Global nuclear R-loop accumulation caused by SMN knock-out. Scatter plots representing data from single-cell and R-loop immunofluorescence analysis (N = 150 per condition; Mean ± Quartiles; ****P < 0.0001 for the Mann-Whitney test). g, SMN antagonists cause global nuclear R-loop accumulation. Single-cell and R-loop immunofluorescence analysis of HEK293 cells treated with 20 μM vehicle (DMSO), compound 1 or compound 2 (N = 150 per condition; Mean ± Quartiles; ****P < 0.0001 for the Mann-Whitney test). h, SMN antagonists lead to R-loop accumulation at ACTB gene locus. Quantified DNA immunoprecipitation using primers along ACTB locus by using GFP antibodies, in cell extracts that were transfected with GFP-RNase H1 R-loop-binding domain (GFP-HB) fusion construct for R-loop detection.
Our previous ChIP study has shown that SMN occupies the ACTN (β-actin) gene from its promoter to the termination regions with the highest level of occupancy at the 3′-end of the gene9. PRMT5 depletion or POLR2A R1810 mutation leads to a decreased SMN occupancy9. To examine whether the SMN small molecule antagonists have any effects on the SMN occupancy at its target genes during transcription, the SMN ChIP assay was performed using the primers along the ACTN gene (Fig. 3b). Similar to the effects of PRMT5 depletion or POLR2A R1810 mutation, treatment of either compound 1 or compound 2 significantly reduced the levels of SMN along the ACTN gene (Fig. 3c). Given that POLR2A CTD R1810A mutation or depletion of SMN leads to the accumulation of RNPA II at genes9, SMN antagonists might have similar effects. To address this issue, we performed RNAP II ChIP experiments and found that adding 20 µM of either compound 1 or compound 2 (72h) significantly increased the occupancy levels of RNAP II at the promoter regions and 3′-end of the ACTB gene as detected by quantitative PCR (qPCR) (Fig. 3d). These results indicate that SMN antagonists could cause the accumulation of RNAP II at both the promoter and 3′ pause site of its target genes.
Our previous studies demonstrated that PRMT5 or SMN depletion, or POLR2A R1810 mutation leads to the R-loop accumulation at the ACTB gene9. Here, we further confirmed that CRISPR/Cas9 mediated SMN knock-out increased the global R-loop accumulation in HEK293 cells as detected by immunofluorescence staining (Fig. 3e and 3f). Over-expression of RNase H1 significantly decreased the levels of R-loops in SMN knock-out cells, validating the authenticity of the R-loop signals (Supplementary Figure 8). Similar as SMN knock-out, treatment of either compound 1 or compound 2 significantly increased R-loop levels in comparison to the DMSO controls (Fig. 3g), indicating the global effects of SMN antagonists in R-loop accumulation. Consistently, treatment of either compound 1 or compound 2 significantly increased the R-loop signals at the 3′-end of the ACTB gene (Fig. 3h).
In summary, in this study, we identified some low micromolar antagonists of SMN, and compound 1 shows >4-fold selectivity over other tested methyl-lysine or arginine binding domains. Our structural and mutagenesis studies provide mechanistic insights into the selectivity of compound 1 for SMN. Our cellular results display that SMN antagonists prevent SMN interaction with R1810me2s-POLR2A, resulting in the over-accumulation of active RNAP II and R-loop, mimicking the SMN depletion results. Thus, in addition to the antisense, RNAi and CRISPR/Cas9 techniques, these potent SMN antagonists may be used as efficient tools in the study of SMN biology and its related neurological diseases.
Methods
Protein expression and purification
The coding DNA fragments of following Tudor domains were cloned into pET28-MHL vector: SMN (aa 82-147), UHRF1 (aa 126-285), SMNDC1 (aa 53-130), TDRD3 (aa 540-620), SND1 (aa 650-910), TDRD2 (aa 327-420), PHF1 (aa 28-87), SGF29 (aa 115-293), JMJD2A (aa 897-1101), 53BP1 (aa 1483-1606). The coding regions of chromodomain of CBX7 (aa 8-62), PWWP domain of DNMT3A (aa 275-417), and CW domain of ZCWPW2 (aa 21-78) were also subcloned into pET28-MHL vector to generate N-terminal His-tagged fusion protein. The recombinant proteins were overexpressed in E coli BL21 (DE3) Codon plus RIL (Stratagene) at 15 °C and purified by affinity chromatography on Ni-nitrilotriacetate resin (Qiagen) followed by TEV protease treatment to remove the tag. The proteins were further purified by Superdex75 or Superdex200 gel-filtration column (GE Healthcare, Piscataway, NJ). For crystallization experiments, purified proteins were concentrated to 18 mg/mL for SMN, 23 mg/mL for UHRF1 and 10 mg/mL for TDRD3 in a buffer containing 20 mM Tris-Cl, pH 7.5, 150 mM NaCl and 1 mM DTT. All the mutations were introduced with the QuikChange II XL site-directed mutagenesis kit (Stratagene, 200522) and confirmed by DNA sequencing. Mutant proteins were also overexpressed in E coli BL21 (DE3) Codon plus RIL (Stratagene) and purified using the same procedures described above. The molecular weight of all protein samples was checked by mass spectrometry.
Small molecule fragment based screening of UHRF1 tandem Tudor domain
A small molecule fragment library with 2040 compounds was screened against tandem Tudor domain of UHRF1 by fluorescein polarization-based peptide displacement assay according to previous reports17. Briefly, the screening was performed in 10 μL at a protein concentration of 20 μM premixed with a 40 nM FITC-labeled H3K9me3 peptide (aa 1-25, Tufts University Core Services, Boston, MA), and then adding a single concentration of 2 mM compound in a buffer of 20 mM Tris-Cl, pH 7.5, 150 mM NaCl, 1 mM DTT, and 0.01% Triton X-100. The hits were further confirmed by dose response analysis. All the assays were performed in duplicate in 384-well plates, using the Synergy 2 microplate reader (BioTek), with an excitation wavelength of 485 nm and an emission wavelength of 528 nm.
Isothermal Titration Calorimetry (ITC)
For the ITC measurement, the concentrated proteins were diluted into 20 mM Tris-Cl, pH 7.5, 150 mM NaCl (ITC buffer); the lyophilized compounds were dissolved in the same buffer, and the pH value was adjusted by adding 2 M NaOH or 2 M HCl. The compounds that could not be dissolved in the ITC buffer were dissolved in DMSO with the accessible highest concentration. Compound concentrations were estimated from the mass. For the ITC assay with compound dissolved in DMSO, the protein was diluted by ITC buffer containing same final concentration of DMSO. All measurements were performed in duplicate at 25 ºC, using a VP-ITC (MicroCal, Inc.) or a Nano-ITC (TA, Inc) microcalorimeter. The protein with a concentration of 50-100 μM was placed in the cell chamber, and the compounds with a concentration of 0.5-2 mM in syringe was injected in 25 or 20 successive injections with a spacing of 180 s for VP-ITC or 120 s for Nano-ITC. Nano-ITC data should be consistent with those from the regular ITC instrument, based on ITC results of SMN-compound 1 using both regular and nano-ITC instruments. Control experiments were performed under identical conditions to determine the heat signals that arise from injection of the compounds into the buffer. Data were fitted using the single-site binding model within the Origin software package (MicroCal, Inc.) or the independent model within the Nano-Analyze software package (TA, Inc.).
Protein crystallization
For the complex crystal of SMN-compound 1, compound free crystals were crystallized in a buffer containing 2 M ammonium sulfate, 0.2 M potassium/sodium tartrate, 0.1 M sodium citrate, pH 5.6 and soaked with compound 1 at a molar ratio 1:5 for 24 h. For the complex crystals of UHRF1-compound 1, SMN-compounds 4/6 and TDRD3-compound 1, purified proteins were mixed with the compounds at a molar ratio 1:5 and crystallized using the sitting drop vapor diffusion method at 18 ºC by mixing 0.5 μL of the protein with 0.5 μL of the reservoir solution. The complex of UHRF1-compound 1 was crystallized in a buffer containing 20% PEG 3350, 0.2 M magnesium nitrate; SMN-compound 4 was crystallized in a buffer containing 1.8 M sodium acetate, pH 7.0, 0.1 M Bis-Tris propane, pH 7.0; SMN-compound 6 was crystallized in a buffer containing 2 M sodium formate, 0.1 M Bis-Tris propane, pH 7.0; and TDRD3-compound 1 was crystallized in a buffer containing 1.2 M sodium citrate, 0.1 M Tris-Cl, pH 8.5. Before flash-freezing crystals in liquid nitrogen, crystals were soaked in a cryoprotectant consisting of 85% reservoir solution and 15% glycerol.
Data collection and structure determination
The program PHASER18 was used for molecular replacement (MR) when needed. Models were interactively rebuilt, refined and validated using COOT19, REFMAC20 and MOLPROBITY21,22 software, respectively. MarvinSketch (Chemaxon.com) was used for the calculation of some SMILES strings during preparation of small molecule geometry restraints. PDB_EXTRACT23 and CCTBX24 library were used during preparation of the crystallographic models for PDB deposition and publication. Diffraction data and model refinement statistics for the structures are displayed in Supplementary Table 1. Some structure determination details for specific structures are as follows. SMN in complex with compound 1: Diffraction images were collected on a copper rotating anode source and initially reduced to merged intensities with DENZO/SCALEPACK25/AIMLESS26. For later refinement steps, data were reduced with XDS27/AIMLESS. The crystal structure was solved by placement of atomic coordinates from isomorphous PDB entry 1MHN28 in the asymmetric unit. Geometry restraints for compound 1 were prepared on the GRADE server29,30. SMN in complex with compound 4: Diffraction data were collected at APS/NE-CAT beam line 24-ID-E and reduced with XDS/AIMLESS. The structure was solved by MR with diffraction data from an additional, isomorphous crystal and coordinates from PDB entry 4QQ6 (SMN in complex with compound 1, above). Geometry restraints for compound 4 were prepared with PRODRG31. Anisotropic displacement parameters were analyzed on the PARVATI server32. SMN in complex with compound 6: Diffraction data were collected on a rotating copper anode source and reduced with XDS/AIMLESS. The structure was solved by MR with coordinates from PDB entry 4QQ6. Geometry restraints for compound 6 were prepared with ELBOW33, which in turn used MOGUL. UHRF1 in complex with compound 1: Diffraction data were collected at APS/SBC-CAT beamline 19ID and reduced to merged intensities with XDS/AIMLESS. The structure was solved by MR with coordinates derived from PDB entry 3DB334. TDRD3 in complex with compound 1: Diffraction data were collected at CLS/CMCF beamline 08ID and reduced to intensities with DENZO/SCALEPACK. Intensities were converted to the MTZ format with COMBAT35 or, alternatively, POINTLESS36 before symmetry-related intensities were merged with AIMLESS. The structure was solved by MR with coordinates from PDB entry 3PMT15.
Cell Culture
HEK293 cells were grown in DMEM (SLRI media facility) plus 10% FBS (Sigma, F1051). For analysis of SMN chemical antagonists, HEK293 cells were treated with different concentration (0, 2, 6, 20, and 40 μM) of DMSO, compound 1 or compound 2 for 72 h. CRISPR-mediated SMN1 gene knockout was performed according to our previous study9. Briefly, 2 μg of CRISPR/Cas9 plasmids (pCMV-Cas9-GFP), which express scrambled guide RNA, or guide RNA that targets the SMN1 gene Exon1 (gRNA target sequence: ATTCCGTGCTGTTCCGGCGCGG) or Exon3 (gRNA target sequence: GTGACATTTGTGAAACTTCGGG) was transfected into HEK293 cells. Cells were sorted by BD FACSAria flow cytometry (Donnelly Centre, University of Toronto) 24 h after transfection and single GFP-positive cells were seeded into a 48-well plate. The expression levels of SMN in each clone were detected by immunofluorescence. The transfection of GFP-RNase H1 R-loop-binding domain (GFP-HB) for R-loop detection into HEK293 cells was performed with the FuGENE Transfection reagent (Roche, E269A).
Immunoprecipitation (IP) and Western blot
Immunoprecipitation was performed with RIPA buffer (140 mM NaCl, 10 mM Tris-Cl, pH7.6-8, 1% Triton, 0.1% sodium deoxycholate, 1 mM EDTA) containing protease inhibitors (Roche, 05892791001) and Benzonase (Sigma, E1014) as described previously9. Briefly, 1-2 × 10⁷ cells were lysed on ice for 25 min by vortexing and forcing them through a 27 gauge needle. After centrifuging at 13,000 rpm for 10 min at 4 °C, the supernatant was incubated with 25 μL (1:10 dilution) protein G beads (Invitrogen, 10003D) and 1-2 μg of antibodies for 4 h to overnight. The samples were washed three times with RIPA buffer and boiled in 1 x SDS gel sample buffer. The input and IP samples were run on 4-12 % SDS-PAGE and transferred to PVDF membranes (Bio-Rad, 162-0177) using Trans-Blot® SD Semi-Dry Electrophoretic Transfer Cell (BioRad, 170-3940). After transference, the membranes were blocked overnight in 5% BSA in RIPA buffer. Primary antibodies (POLR2A, Abcam monoclonal antibody, ab5408; SMN, Santa Cruz polyclonal antibody H-195, sc-15320; ACTB, Sigma, A5441) were used at 1:2,000 to 1:5,000 dilutions for incubation overnight followed by three times washes with RIPA buffer, and horseradish peroxidase-conjugated goat anti-mouse or-rabbit secondary antibodies (Jackson ImmunoResearch, 211-032-171 or 115-035-174) were used at 1:10,000 dilutions for incubation 1 h followed by three times washes with RIPA buffer. Blots were developed using SuperSignal West Pico or Femto (Thermo Scientific, 34079 or 34094).
Chromatin immunoprecipitation (ChIP)
ChIP was performed using the EZ-ChIP™ A - Chromatin Immunoprecipitation Kit (Millipore, 17-371) according to manufacturer’s instruction. Antibodies were used with a range of 1-2 μg, and IgG (Millipore polyclonal antibody, 12-370) was used as a background control. After immunoprecipitation, genomic DNA was de-crosslinked in ChIP elution buffer containing 5 M NaCl at 65 °C overnight and purified with the Qiaex II kit (Qiagen, 20021) and eluted in water for PCR amplification. Immunoprecipitated and input DNAs were used as templates for qPCR. The qPCR primer sequences for ACTB gene are the same as described earlier9.
Immunofluorescence and microscopic R-loop quantification
Global nuclear R-loop detection was ascertained via R-loop immunofluorescence using S9.6 antibody for R-loop (Kerafast, ENH001). 24 h prior to immunofluorescence, 40,000 cells were seeded on to Poly-L-Lysine (PLL) coated coverslips. Cells were fixed using 1% formaldehyde for 15 min, washed three times with PBS, permeabilized with 0.3% Triton X-100 and then washed again three times with PBS. Coverslips were blocked using 5% BSA for 1 h at room temperature and transferred to humidified chambers for antibody incubations. Coverslips were incubated with 60 μL of S9.6 (1/500 concentration) for 1 h at room temperature. After washing with PBS, cells were incubated with secondary antibody for 1 h in a dark chamber. Following further washing and DAPI staining, coverslips were mounted onto microscope slides using DAKO fluorescent mounting medium and then sealed with nail polish. For RNaseH1 overexpression analysis, scramble and SMN knock-out cells were seeded in 6-well plates and transfected 24 h later with 0.9 μg pcDNA3-Empty or pcDNA3-RNaseH1. 48 h post-transfection, cells were harvested and re-seeded onto PLL-coated coverslips, which were processed for immunofluorescence 24 h later using S9.6 and anti-RNaseH1 (Proteintech, 15606-1-AP) to quantify R-loop and confirm RNaseH1 overexpression, respectively. For analysis of SMN chemical antagonists, HEK293 cells were treated with DMSO, compound 1 or compound 2 (final concentration of 20 μM) for 72 h, before being processed for S9.6 immunofluorescence.
We employed a Nikon C2+ Confocal microscope coupled to NIS-elements AR software (Nikon). For R-loop microscopy in HEK293 cells, random fields identified by DAPI staining were captured at 100X magnification. For any given image, 5-6 2D imaging planes were acquired along the z-axis to generate 3D confocal image stacks. DAPI was used to create masks of nuclei and S9.6 intensity values for individual cells were obtained as maximum intensity planes via the NIS-elements AR (Nikon) software. Representative single-plane images from z-stacks adjusted for background and contrast in Photoshop (Adobe) are shown.
Data availability
Coordinates and structure factors are deposited in the Protein Data Bank (PDB) with accession code 4QQ6, 4QQD, xxxx for SMN-compound 1, UHRF1-compound 1, SMN-compound 4, SMN-compound 6, TDRD3-compound 1, respectively. All other relevant data supporting the key findings of this study are available within the article or from the corresponding authors upon reasonable request.
Author contributions
Y.L. and W.L. purified and crystallized the proteins; A.I. conducted the fragment screening under the supervision of P.B.; Y.L., W.L. S.Q. and M. Z. conducted the ITC assays; Z. N., D.Y. Z, K.J. A., and X. G. performed the cellular assay under the supervision of K. M. and J. G.; W.T. collected diffraction data and determined the crystal structures; J.M. conceived the study and wrote the paper with substantial contributions from all the other authors.
Competing financial interests
The authors declare no competing financial interests.
Acknowledgments
We thank Dr. John R. Walker for reviewing some of the crystal structures. The SGC is a registered charity (number 1097737) that receives funds from AbbVie, Bayer Pharma AG, Boehringer Ingelheim, Canada Foundation for Innovation, Eshelman Institute for Innovation, Genome Canada through Ontario Genomics Institute [OGI-055], Innovative Medicines Initiative (EU/EFPIA) [ULTRA-DD grant number 115766], Janssen, Merck KGaA, Darmstadt, Germany, MSD, Novartis Pharma AG, Ontario Ministry of Research, Innovation and Science (MRIS), Pfizer, São Paulo Research Foundation-FAPESP, Takeda, and Wellcome. This work was also supported by a NSERC grant RGPIN-2016-06300 (JM), and the National Natural Science Foundation of China grants (31500615 (YL) and 31500613 (SQ)). Some diffraction experiments were performed at the Structural Biology Center and Northeastern Collaborative Access Team (NIGMS grant P30 GM124165) and Structural Biology Center beam lines at the Advanced Photon Source at Argonne National Laboratory (ANL). ANL is operated by the University of Chicago Argonne, LLC, for the U.S. Department of Energy Office of Biological and Environmental Research under contract DE-AC02-06CH11357. Diffraction experiments described in this paper were also performed by using beamline 08ID-1 at the Canadian Light Source, which is supported by the Canada Foundation for Innovation, Natural Sciences and Engineering Research Council of Canada, the University of Saskatchewan, the Government of Saskatchewan, Western Economic Diversification Canada, the National Research Council Canada, and the Canadian Institutes of Health Research.


