

Abstract
Humans are remarkably capable of adapting their behaviour flexibly based on rapid situational changes: a capacity termed cognitive control. Intuitively, cognitive control is thought to be affected by the state of alertness, for example, when sleepy or drowsy, we feel less capable of adequately implementing effortful cognitive tasks. Although scientific investigations have focused on the effects of sleep deprivation and circadian time, little is known about how natural fluctuations in alertness in the regular awake state affect cognitive control. Here we combined a conflict task in the auditory domain with neurodynamics -EEG recordings-to test how neural and behavioural markers of conflict processing are affected by fluctuations in arousal. Using a novel computational method, we segregated alert and drowsy trials from a three hour testing session and observed that, although participants were generally slower, the typical slower responses to conflicting information, compared to non-conflicting information, was still intact, as well as the effect of previous trials (i.e. conflict adaptation). However, the behaviour was not matched by the typical neural markers of cognitive control -local medio-frontal theta-band power changes-, that participants showed during full alertness. Instead, a decrease in power of medio-frontal theta was accompanied by an increase in long-range information sharing (connectivity) between brain regions in the same frequency band. The results show the resilience of the human cognitive control system when affected by internal fluctuations of our arousal state and suggests a neural compensatory mechanism when the system is under physiological pressure due to diminished alertness.
Introduction
Cognitive control is the capacity of making quick adjustments to cognitive resources in order to optimally solve the task at hand. One proposed mechanism involves allocating attention to task-relevant information and ignoring non-relevant, sometimes conflictive, information (Desimone and Duncan, 1995; Miller and Cohen, 2001; Egner and Hirsch, 2005). The ability to deal with conflicting information is often studied using “conflict tasks”, which typically induce response (or stimulus) conflict by triggering an automatic response that has to be overcome to decide correctly (e.g. Stroop/Simon tasks). For example, when a Dutch person drives in England, they must override the automatic tendency to turn right on a roundabout, and go left instead. Experiencing these types of conflict has shown to increase the level of cognitive control on the next occasion, when encountering a similar conflicting situation. This process -termed conflict adaptation-seems necessary to smooth future decisions and avoid further mistakes (Gratton et al., 1992). Here we combine a behavioural conflict task with electroencephalography (EEG) to study the modulatory effect of arousal fluctuations on decision-making in the face of conflict.
How levels of wakefulness modulate attentional processes and cognitive control is commonly studied in sleep deprivation and circadian cycle studies, but less often during normal waking fluctuations (Goupil and Bekinschtein, 2012). Both sleep deprivation and drops in circadian time lead to cognitive performance decrements (Wickens et al., 2015), but surprisingly, the performance modulation imposed by changes in wakefulness on complex tasks appears to be less severe than their effects on simple tasks (Harrison et al., 2000). Specifically, studies focusing on (cognitive/response) conflict have failed to indicate increased interference effects with sleep deprivation and circadian time (Sagaspe et al., 2006; Cain et al., 2011; Bratzke et al., 2012), but consistently show overall slower responses during increased sleepiness or lower arousal. However, Gevers et al. (2015) recently uncovered an interesting dissociation, although conflict effects on the current trial did not seem to change after a night of sleep deprivation, across trial conflict adaptation effects did. These results nicely converge with studies on the relationship between conflict awareness and conflict processing, as conflict detection seems much less dependent on conflict experience than conflict adaptation (van Gaal et al., 2010; Jiang et al., 2015), suggesting that conflict detection is more automatic -less effortful-than conflict adaptation.
Fluctuations in cognitive control are shown to be associated with changes in activity patterns in the medial frontal cortex (MFC) and the dorsolateral prefrontal cortex (DLPFC) (Robbins, 1996; Swick et al., 2011; Gläscher et al., 2012; Cai et al., 2016). In EEG recordings, conflict-related processes are often measured by quantifying the power of theta-band neural oscillations (4-8 hertz) (Luu et al., 2004; Trujillo and Allen, 2007; Cohen et al., 2008; Cavanagh et al., 2010; Nigbur et al., 2012; Cohen and van Gaal, 2014). In combination with a recently validated method to automatically detect drowsiness periods from EEG (Jagannathan et al., 2018) we here use conflictive information to map behavioural and neural markers of cognitive control as they get modulated by ongoing fluctuations in arousal.
Results
While fully awake as well as while becoming drowsy, participants performed an auditory Simon task where they heard the words “left” or “right”, from either the left or right side in space. Participants were instructed to respond according to the meaning of the sound (e.g. “left” requires left-hand response, Figure 1A). We hypothesised an increase in reaction times to all stimuli-a typical marker of drowsiness-but expected that conflict detection mechanisms would remain relatively preserved (in behaviour and theta oscillations), similar to studies showing preserved processing of conflicting information at reduced levels of stimulus awareness (van Gaal et al., 2010; Jiang et al., 2015, 2018). We expected the sharpest decline in performance and conflict processing when focusing on across trial conflict adaptation mechanisms (Jiang et al., 2015).

(A) Schematic representation of the experimental design. Participants were instructed to report the semantics (“left” or “right”) of an auditory stimulus via a button press with their left or right hand, respectively, and to ignore the spatial location at which the auditory stimulus was presented. Sound content of the auditory stimuli could be congruent or incongruent with its location of presentation (50% congruent/incongruent trials). (B) Schematic representation of the experimental sessions. In the awake session participants were instructed to stay awake with their eyes closed whilst performing the task with the back of the chair set up straight and the lights on. Immediately after, in the drowsy session, the task was performed while participants were allowed to fall asleep with their chair reclined to a comfortable position and the lights off. (C) Automatic classification of alertness levels. Pre-trial periods (−1500 to 0 ms) were used for defining the awake (purple) and drowsy (green) conditions. Pre-trials containing 100% and >50% of alpha oscillations were classified as awake. Similarly, pre-trials containing <50% of alpha oscillations, EEG flattening and ripples were classified as drowsy (see Methods for details). (D) Upper panel. Automatic classification of alertness during a drowsy session (representative participant, occipital electrode). The frequency profile depicts changes in the power level in different bands during the pre-trial period, and the bars on top represent pre-trials classified as awake (purple) or drowsy (green). Lower panel. The variability in the reaction times (lower panel) closely follows the changes in the frequency profile (upper panel) from alpha (higher RT variability in green) to theta (lower RT variability in purple) obtained using the pre-trial information.
Behavioural results
First, we analysed the reaction times (RT) differences between alertness conditions (awake, drowsy), previous trial congruency (congruent, incongruent) and current trial congruency (congruent, incongruent). As expected, a repeated-measures (RM) ANOVA revealed that RTs were slower for drowsy than alert trials (F1,32=26.58; p<0.001;  ) and that there was a clear conflict effect, revealed by slower RTs to incongruent vs congruent trials (F1,32=47.03; p<0.001;
  ). We also observed the typical conflict adaptation effect, indicated by a smaller conflict effect when the previous trial was incongruent than congruent (interaction previous x current trial congruency: F1,32=29.88; p<0.001;
  ). In the next series of analyses, we focus on the effects for the awake and drowsy conditions separately.
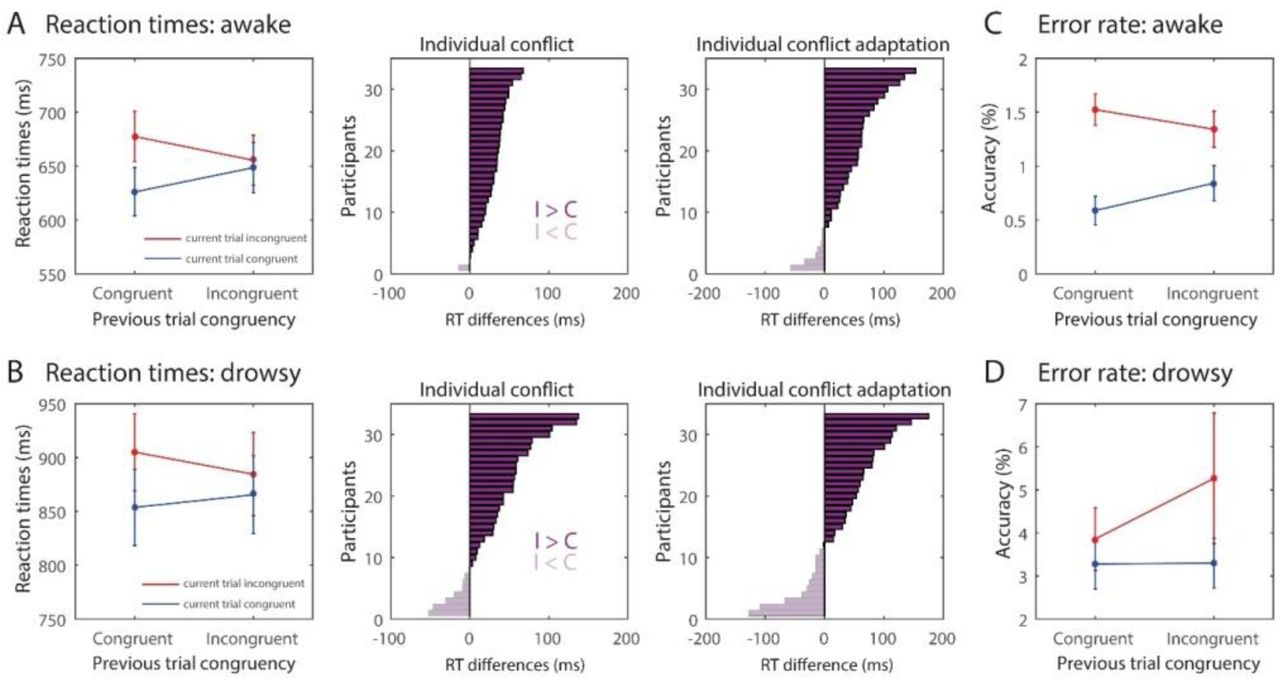
Within the awake condition, RTs were slower for incongruent trials compared to congruent trials (main effect of congruency: F1,32=59.16; p<0.001;  ) and there was also a conflict adaptation effect (interaction previous x current trial congruency: F1,32=27.974; p<0.001;
  , Figure 2A left). The effects were positive for the majority of the participants for both the conflict (30 out of 33 participants) and the conflict adaptation effect (26 out of 33 participants; Figure 2A middle). Similar effects were observed when participants were drowsy, since both a conflict (F1,32=9.642; p=0.004;
  ) and conflict adaptation effect were observed (F1,32=7.318; p=0.011;
  , Figure 2B left). Again, the effects were positive for the majority of the participants for both the conflict (26 out of 33 participants) and conflict adaptation (22 out of 33 participants; Figure 2B middle).

Conflict and conflict adaptation effects for the awake (A) and drowsy (B) conditions in reaction times at the group and individual level. Effects of conflict and conflict adaptation in error rates in the awake (C) and drowsy (D) condition.
A (RM) ANOVA performed on error rates across arousal levels revealed that participants made more errors during drowsy than during awake (main effect of alertness: F1,32=18.29; p<0.001;  ), however, conflict (F1,32=2.357; p=0.135;
  ; BF10=1.24) and conflict adaptation (F1,32=0.862; p=0.360;
  ; BF10=4.14) effects on error rate were not reliable. On the other hand, when the analyses were performed separately by arousal level, the awake state showed a conflict effect (F1,32=24.152; p<0.001;
  ) and conflict adaptation F1,32=8.567; p=0.006;
  , Figure 2C) but the drowsy condition did not (conflict: F1,32=1.41; p=0.243;
  ; BF=5.149; conflict adaptation: F1,32=1.88; p=0.180;
  ; BF=13.685, Figure 2D).
Midfrontal theta-band oscillations and source reconstruction
Upon establishing that conflict and conflict adaptation effects are present in both awake and drowsy states, we proceed to test whether medial frontal (MF) conflict detection processes, typically reflected in short-lived oscillatory dynamics in the theta-band (Nigbur et al., 2012; Cohen and Donner, 2013; Cohen and van Gaal, 2014; Jiang et al., 2015), were present during awake and drowsy states as well. In order to determine the time-frequency cluster for assessing conflict and conflict adaptation effects, we first analysed the overall conflict effect, irrespective of alertness condition or previous trial congruency (I-C, averaged over awake and drowsy sessions). Replicating previous studies (Nigbur et al., 2012; Jiang et al., 2015), current trial conflict induced increased theta-band power at MF electrodes (cluster p=0.028; frequency range: 4Hz–8Hz, time range: 250ms–625ms, see encircled region in black, solid line, in Figure 3A). The area within this time-frequency (T-F) cluster was used for follow-up analyses. Next, we tested whether these conflict-related theta-band dynamics in this cluster were modulated by alertness and previous trial congruency, which was indeed the case. A RM ANOVA revealed stronger MF theta for awake than drowsy trials (main effect of alertness: F1,32=51.64; p<0.001;  ) and typical conflict adaptation effects (F1,32=5.70; p=0.023;
  ). We unpack below the results for awake and drowsy conditions separately.

Conflict effects in terms of time-frequency dynamics across alertness conditions (A), and for the awake (B) and drowsy condition (D) separately, calculated over medial-frontal electrodes. (A) The black delineated box is the theta-band time-frequency ROI where overall conflict (I-C) was significant over conditions (cluster-based corrected, see Methods). Insets show topographical distributions of oscillatory power within this T-F ROI. Black dots represent the midfrontal EEG electrodes selected for obtaining the conflict-related theta-band power. A source-reconstruction analysis was performed on this time-frequency ROI (z-score). Activations are depicted on unsmoothed brains; as reconstructed sources were only observed on the surface of the cortex. Sources are for visualization purposes (no statistical testing performed). Group-level (B, D) and individual conflict and conflict adaptation effects (C, E) for the awake (B, C) and drowsy (D, E) in dB (average ROI power incongruent – average ROI power congruent).
In the awake condition, MF theta-band power was stronger for incongruent than congruent trials (conflict effect: F1,32=11.38; p=0.002;  ), and this conflict effect was modulated by previous trial congruency (conflict adaptation: F1,32=8.47; p=0.007;
  ; Figure 3B). On the contrary, the analyses in the drowsy state did not show a reliable conflict effect in MF theta-band oscillations (F1,32=1.11; p=0.299;
  ; BF01=4.53, Figure 3D), nor conflict adaptation (F1,32=2.19; p=0.148;
  ; BF01=3.84). In order to visualize the sources of the conflict-related MF theta oscillations observed at the scalp level, we performed source reconstruction analyses, across all conditions (Figure 3A), for the awake (Figure 3B) and drowsy (Figure 3D) conflict effects separately. In line with several fMRI and animal studies performed on awake participants, the conflict-related theta-band signal seems to show hubs in the medial frontal and the dorsolateral prefrontal cortex (Van Veen et al., 2001; Botvinick et al., 2004; Ullsperger et al., 2014) (Figure 3B), but to a lesser extent in the drowsy condition (Figure 3C).
In addition to the MF theta cluster and in agreement with previous reports (van Gaal et al., 2010; Jiang et al., 2015), an overall conflict effect was observed in the alpha-beta band (cluster p=0.008; frequency range: 13Hz–29Hz, time range: 580ms–728ms, see encircled region in black, dashed line, in Figure 3A). When trials were split, these results were reliable for the conflict effect in the awake condition (F1,32=8.41; p=0.007;  ) but not for conflict adaptation (F1,32=3.24, p=0.081;
  , BF01=2.021), nor for the drowsy condition in general (conflict effect: F1,32=0.05; p=0.488;
  , BF01=5.252; conflict adaptation: F1,32=0.94; p=0.339;
  , BF01=52.135).
Multivariate spectral decoding
The hypothesis-driven analysis for the neural signatures focused on the MF theta-band revealed clear conflict detection and conflict adaptation processes for the wake state, but not reliably for the drowsy state. The change of wakefulness in the transition to sleep comes with big changes in neural reconfiguration that might explain this loss of specificity of the neural markers. In order to determine whether a different pattern of neural activity might be underlying the behavioral conflict effect in the drowsy condition observed in behaviour, we performed a wide multivariate spectral decoding analysis to account for possible changes in space, time and frequency of the conflict related neural signatures. To do so, we trained classifiers to: (1) distinguish between congruent vs. incongruent trials; (2) distinguish spatial processing in trials where the auditory stimulus was presented from the left vs. the right earbud (i.e. stimulus location); and (3) differentiate trials where the presented auditory stimulus was “left” vs. “right” (i.e. stimulus content). Above-chance classification accuracies imply that relevant information about the decoded stimulus feature is present in the neural data, meaning that some processing of that feature occurred (Hebart and Baker, 2018).
Consistent with the univariate approach for analysing congruency, multivariate decoding showed that information about stimulus congruency was reliably represented in neural data in the awake (Figure 4A), but not in the drowsy state (Figure 4B, p<0.05, cluster-corrected; frequency-range: 2-9 Hz, peak frequency: 6Hz, time-range: 376-810 ms). Assessment of the qualitative difference in the theta-band decoding (4-9 Hz) performance between the awake and drowsy states showed reliable temporal clusters of increased classifier accuracy for the awake condition (p<0.05, cluster-corrected) in the 680-810 ms time-range (Figure 4A right panel).

Classifier accuracies are depicted across time-frequency charts (2-30 Hz) for the awake and drowsy condition separately, and for the difference between awake and drowsy conditions in the theta-band. Classifier accuracy was thresholded (cluster-based correction, p<0.05) and significant clusters are outlined with a solid black line. In the difference plots on the right, significant differences from chance are highlighted by a black solid line at the bottom of the figures. The dotted lines in the left and middle panel reflect the frequency band used for statistical testing between awake and drowsy states (rightest panels). (A) Classifier accuracies for stimulus congruency (“conflict”). Information about congruency was only present in the awake condition. (B) Classifier accuracies for stimulus location (“location”). Location of the auditory stimulus could be decoded in both conditions, meaning that information about this stimulus feature is present in both awake and drowsy neural frequency signals. (C) Classifier accuracies for stimulus sound identities (“content”). Sound identities of the auditory stimulus could be decoded in both alertness conditions. Differences between awake and drowsy were observed for stimulus congruency and identity but not for stimulus location.
Although the previous analysis revealed that conflict could only be decoded from neural data in the awake state, interestingly, the sound identity and location of the auditory stimuli could be decoded from neural data for both the awake (identity: p<0.001, cluster-corrected, time-range: 240-1200 ms; location: p<0.05, cluster-corrected, time-range: 120-920 ms) and drowsy states (identity: p<0.05, cluster-corrected, time-range: 250-1200 ms; location: p<0.05, cluster-corrected, time-range: 88-300 ms, Figure 4A and Figure 4C). The above chance performance of the classifiers for low-level stimulus features suggests that location and sound identity were still processed, even during a decreased level of alertness, however, no reliable decoding was found for conflict effects.
Distributed theta-band information sharing
The fact that a multivariate method analysing the pattern across time, space and frequency did not capture a neural signature of conflict observed behaviourally, suggest a more drastic reconfiguration of the neural processes underlying conflict detection during drowsiness. We reasoned that the neural signatures of conflict may involve changes in connectivity in a wide network of brain regions instead of relatively local power changes. Thus, we hypothesized that a neural metric specifically indexing neural information integration (wSMI; King et al., 2013; Sitt et al., 2014; Imperatori et al., 2019) could in principle capture the conflict effect during drowsiness. We performed this analysis as a possible post-hoc hypothesis for the reconfiguration of the underlying networks supporting cognitive control. The wSMI can be calculated at different time-scales and here we used a tau of 32 ms (~4-9 Hz), and therefore this measure captures non-linear information integration in the theta-band domain. Indeed, a RM ANOVA revealed a reliable main effect of alertness (F1,32=56.10; p<0.001,  ) and an interaction between congruency and alertness for long-distance wSMI in the theta-band (F1,32=5.50; p=0.025;
  , Figure 5A). Post hoc effects showed higher wSMI for incongruent than congruent trials only in the drowsy state (t32=2.456; p=0.034; awake: t32=0.305; p=0.761; Tukey corrected for multiple comparisons). Individual differences in theta-band wSMI for each participant in the awake (right) and drowsy (left) conditions are shown in Figure 5B.

(A) Long-distance wSMI in the theta-band during the conflict effect. Each arc represents a functional connection between a pair of electrodes, and the height of the arc represents the value of the wSMI difference for that pair (incongruent - congruent; awake condition in green and drowsy condition in magenta). Theta-band wSMI was calculated between each midfrontal ROI electrode (shown in Figure 2) and every other electrode outside the ROI. wSMI values within the midfrontal ROI were discarded from the analyses since we aimed at evaluated information integration between distant electrode pairs. (B) Individual differences in theta-band wSMI for each participant in the awake (right) and drowsy (left) conditions. (C) Beta coefficients for two separate multiple regressions using RT difference (I-C) as predicted variable and theta power difference (I-C) and wSMI difference (I-C) as regressors (D) Pearson’s correlation for awake and drowsy conditions between RT differences and wSMI difference.
Brain-behaviour relationships
We further investigated, in an exploratory manner, the statistical dependencies between information integration in the theta-band, information sharing (wSMI) and the strength of the behavioural conflict effect. Separate multiple regressions were performed on the awake and drowsy states, using as regressors the MF theta-power ROI differences (I-C) and the distributed theta-wSMI differences (I-C) (Figure 5C). The conflict effect (RT difference: I-C) was used as the predicted variable. In the drowsy condition model (R2=0.20; F2,30=3.68; p=0.037), distributed theta-wSMI predicted the conflict effect in RT (β=-0.39; p=0.028), while MF theta was not a reliable predictor (β=0.14; p=0.665). On the other hand, in the awake condition model (R2=0.02; F2,30=; p=0.613), none of the regressors predicted the conflict effect significantly (MF theta: β=0.12; p=0.514; distributed theta-wSMI: β=0.09; p=0.609). This relationship was also described in terms of a simple Pearson’s correlation, showing a significant correlation between RT difference and wSMI difference for the drowsy (r= −0.42; p=0.015) but not for the awake condition (r=0.08; p=0.65) (Fig 5D). These results show that the distributed information, but possibly not the local spectral power in the same neural signal (theta-band), underlies the behavioural conflict effect observed in the drowsy state.
Discussion
In this article we explored the impact of changes in our arousal state during conflict detection and conflict adaptation processes. We found the expected behavioural manifestations of decreased alertness, namely higher variance and variability in RTs and slower RTs when people were drowsy as compared to actively awake (Lal and Craig, 2001; Huang et al., 2009; Goupil and Bekinschtein, 2012; Bareham et al., 2014; Comsa et al., 2019). Further, we observed reliable conflict effects with increased drowsiness. However, against our hypothesised loss of conflict adaptation, we observed these effects despite participants’ decreased alertness (Figure 2). The effects of conflict (current trial) and conflict adaptation (trial-by-trial) seemed reliable independently of the states of alertness (see Figure 2 for individual participant’s data), suggesting a spared capacity to resolve conflict arising from the incongruity between the meaning and the side of the world where the word was presented. This is in contrast to the lack of detrimental effects of decreasing arousal on cognitive control at the behavioural level that has been proposed (Sagaspe et al., 2006; Cain et al., 2011; Bratzke et al., 2012), although there are contrasting views (Gevers et al., 2015). These arousal modulations on the capacity of executive control have been found primarily for fatigue and sleep deprivation. However, we show here that normal fluctuations of arousal in well-rested participants yield no strong detrimental effects in the resolution of conflict. In short, humans still experience conflict while drowsy, and even if they react slower, they respond to incongruity in the comparable way as when fully awake and attentive.
Although conflict processing was relatively maintained in behavioural terms, its neural signatures changed. The principles of neural reorganization are a much debated topic in neuroscience (Dahmen and King, 2007; Shine et al., 2019) but there is agreement that there is flexibility of the brain networks to maintain or preserve psychological function in the face of insult, and internal or external modulatory factors (Siuda-Krzywicka et al., 2016; Singh et al., 2018). Here we found a dissociation due to the change in arousal between the behaviour and its classic neural markers, the classic conflict-induced theta-band power changes were no longer reliable during low alertness. Furthermore, multivariate whole-brain analyses showed convergent results with stronger neural signal in alert compared to the drowsy state. This suggests that the changes exerted by the diminished arousal elicited a reconfiguration of the brain networks putatively responsible for the neural resolution of the conflict, resulting in the disappearance of the theta power difference in the conflict contrast.
The networks implicated in cognitive control are not only supported by correlations with brain activity, but also by causal interventions. In rodents a dissociation has been proposed between prefrontal cortices in the causal support of control functions, in which the dorso-medial prefrontal cortex seems to be implicated in memory for motor responses; this includes response selection and the temporal processing of information, whereas ventral regions of the medial prefrontal cortex seem implicated in interrelated ‘supervisory’ attentional functions, including attention to stimulus features and task contingencies (or action–outcome rules), attentional set-shifting, and behavioural flexibility (Dalley et al., 2004). In humans, causal evidence is sparse due to a scarcity of patients with specific (frontal) lesions. However, the impairment of simple cognitive control and trial-by-trial influence is shown in a small but well-structured study in which dorsal anterior cingulate cortex (dACC) damage disrupted the ability to make an adaptive choice between actions (but not stimuli) following a win on the previous trial. Moreover, orbitofrontal (OFC) damage similarly disrupted choices between stimuli, but not actions (Camille et al., 2011). Furthermore, in a large (n=344) correlational study Gläscher et al. (2012) found that impairments in cognitive control (response inhibition, conflict monitoring, and switching) was associated with dorsolateral prefrontal cortex and anterior cingulate cortex lesions. These medial prefrontal areas that have been proposed as the origin of the theta power modulation in conflict tasks are thus causally implicated in cognitive control and lend further support for the search of other correlates that would capture the conflict effect during an arousal challenge.
An important methodological aspect of the study entails the design for single subject power. We expected to see a strong conflict effect in this version of the Simon Task in the group analyses (Vu et al., 2003), since we collected several hundreds of trials per condition in each participant for both alertness states (awake and drowsy). Moreover, the systematic effects at the single-participant level due to fast-paced high-number of trials as wakefulness decreased from around 3 hours of testing, captured the true effect of the group. Each participant included in the analyses provided all conditions, awake and drowsy.
The cognitive processes leading up to conflict experience involve the extraction of meaning (“left” or “right”) and the location from where the stimulus came from. Thus, if the two factors are congruent (“left” coming from the left side of space) conflict is supposed to be absent and participant’s response fast, but when the word comes from the other side of the space (“left” presented in the right side of space) conflict arises and the response slows down, reflecting further processes necessary to resolve conflict. We hypothesised that the specific perceptual and semantic component of location and content, respectively, would be decodable in the spectral domain as the participants responded correctly to the stimuli. Both content and location showed above chance decoding patterns in the theta-band as well as other frequency bands -depending on the contrast-in both awake and drowsy states. This highlights the capacity of the brain to process the semantic and spatial components of the task in parallel under internal modulatory stress (lower arousal). In order to capture the integration between these two components by cognitive control networks, we looked for decodability of conflict in the spectral domain (stimulus congruency). The patterns showed the expected theta-band power difference (restricted to theta) only in the alert state.
We knew that there is strong evidence that neural aspects of conflict are found in brain signals, hence we turn to information sharing under three premises. First, a neural measure of information sharing could in principle capture directly the information integration between stimulus content and stimulus location necessary for generating the conflict effect in our task. Second, the dynamic nature of neural information integration (Imperatori et al., 2019) may be able to capture the reconfiguration of neural networks during the transition from an alert to a drowsy state of mind. Finally, as the reorganization of networks could be reflected in the need for larger information capacity of the brain when challenged (by drowsiness), the measure chosen can be conceptually framed as deriving from a computational principle. Although cortical reorganization with age and after insult have been extensively studied, the cognitive flexibility, or “cognitive fragmentation” resulted from an internally generated change – drowsiness-has hardly been captured (Goupil and Bekinschtein, 2012). These methods of tackling the system as it changes could be conceptually regarded as causal if the processes at play are regarded as partially independent. The case of drowsiness as a causal model to study neural mechanism of cognitive control and decision making at large may prove to be very useful in the exploration of how cognition is fragmented or remain resilient under (reversible) perturbations of wakefulness (Kouider et al., 2014; Comsa et al., 2018).
One possible explanation for the call for wider networks to resolve conflict during drowsiness would be the need for involvement of extended neural resources to solve the same task, as seen previously in older adults when they are matched in performance to younger adults (Reuter-Lorenz and Cappell, 2008; Spreng et al., 2017). Convergent evidence is drawn from cognitive control studies, where the frontoparietal control networks are further recruited with higher cognitive load (Liang et al., 2016; Fransson et al., 2018), tasks possibly reflecting the higher need for neural resources. In other words, the brain’s capacity for plasticity allows for the expansion of conflict networks in cases where another element in the system (e.g. drowsiness) draws resources away (internal challenge) from the neural systems typically underlying cognitive control.
Methods
Participants
Thirty-three healthy human participants (18 female) aged 18 to 30 (M=23.1, SD=2.8), recruited from the University of Cambridge (Cambridge, United Kingdom), participated in this experiment for monetary compensation. All participants had normal or corrected-to-normal vision and had no history of head injury or physical and mental illness. This study was approved by the local ethics committee of the University of Cambridge and written informed consent was obtained from all participants after explanation of the experimental protocol.
Experimental task
Participants performed an auditory version of the Stroop task (Stroop, 1935). Recorded samples of a native speaker saying “left” or “right” were presented to participants’ left or right ear through ear buds, resulting in four types of stimuli (i.e. “left” in left ear, “left” in right ear, “right” in right ear, “right” in left ear). Stimuli were congruent when the word meaning corresponded to its physical location (e.g. left in left ear) and incongruent otherwise (e.g. “left” in right ear). All four types of stimuli were presented equally often, but in a random order. Participants were asked to report the location depicted by the voice (i.e. word meaning; the words left or right), while ignoring its physical location (i.e. left or right ear) by pressing one of two buttons on a response box. There was no practice block and no feedback on performance throughout the task. The time between a response and the following stimulus varied randomly between 2 and 2.5 seconds. The inter stimulus interval was fixed to 2 seconds in the absence of a response within that time frame. As a result, the inter stimulus interval could vary from 2 seconds (response absent) to 4.49 seconds (maximum response latency of 1.99 seconds + maximum response stimulus interval of 2.5).
Procedure
Participants were instructed to get a normal night’s rest on the night previous to testing. Testing started between 9 am and 5 pm and lasted approximately 3 hours. Upon arrival at the testing room, participants were sat down in a comfortable adjustable chair in an electrically shielded room. Participants were fitted with an EGI electrolyte 129-channel cap (Electrical Geodesics, Inc. systems) after receiving the task instructions and subsequently signing the informed consent. Task instructions were to respond as fast and accurate as possible, to keep bodily movements to a minimum and to keep the eyes closed throughout the experiment. Participants were asked to report their answers with their thumbs (i.e. left thumb for the word ‘left’ and vice versa) on two buttons of a four-button response box that rested on their lap or abdomen. In the first part of the session, participants were instructed to stay awake with their eyes closed whilst performing the task. The back of the chair was set up straight and the lights in the room were on. This part of the experiment lasted for 500 trials and lasted for approximately 25 minutes. Right afterwards, the task was performed while participants were allowed to fall asleep. The chair was reclined to a comfortable position, the lights were turned off and participants were offered a pillow and blanket. Participants were told that the experimenter would wake them up by making a sound (i.e. knocking on desk or wall) if they missed 5 consecutive trials. This part of the experiment lasted for 2000 trials and lasted for approximately 1.5 hours. At the end of the session, participants were sat upright and the EEG cap was removed. Stimuli were presented using PsychToolbox software on a Mac computer and data were acquired using NetStation software (Electrical Geodesics, Inc. Systems) on another Mac computer.
Behavioral data analysis
The first trial of every block, incorrect or missed trials, trials following incorrect responses and trials with an RT<200 ms were excluded from behavioral analyses. Conflict on trial n has been found to cause increased error rates (ERs) and prolonged reaction times (RTs), as compared to when no conflict is present. This current trial effect of conflict can be modulated by previously experienced conflict on trial n-1, a phenomenon called conflict adaptation. In order to investigate whether current trial conflict effects and the modulation thereof by previous conflict were present, we performed repeated measures (RM) ANOVA on ERs and RTs between alertness (awake, drowsy), current trial congruency (congruent, incongruent) and previous trial congruency (congruent, incongruent). Additional post-hoc (RM) NOVA, awake and drowsy conditions separately were performed. In case of null-findings, we applied a Bayesian repeated measures ANOVA with similar factors, to verify if there is actual support of the null-hypothesis. We also performed such Bayesian ANOVAs for any null-findings in our EEG data.
Wakefulness classification
The automatic classification of alertness levels involved classifying periods of the experimental session into ‘awake’ and ‘drowsy’. The pre-trial period (−1500 to 0ms) before each tone was used in classifying the corresponding trial as awake or drowsy. Pre-trial epochs were analysed using the micro-measures algorithm (Jagannathan et al., 2018) and each trial was classified was ‘alert’, ‘drowsy (mild)’, ‘drowsy (severe)’. To select true alert trials, we used only trials from the alert blocks and removed all those marked as ‘severe drowsy’ (purple in Figure 1C). Similarly, ‘drowsy (mild)’ and ‘drowsy (severe)’ from the drowsy blocks were selected as true drowsy trials (green in Figure 1C). Thus, the total number of trials across the 33 participants was 26045 for the ‘awake’ and 33306 for the ‘drowsy’ conditions.
EEG recordings and pre-processing
EEG signals were recorded with 128-channel HydroCel Sensors using a GES300 Electrical Geodesic amplifier at a sampling rate of 500 Hz using the NetStation software. During recording and analyses, the electrodes’ average was used as the reference electrode. Two bipolar derivations were designed to monitor vertical and horizontal ocular movements. Following Chennu et al (2014), data from 92 channels over the scalp surface were retained for further analysis. Channels on the neck, cheeks and forehead, which reflected more movement-related noise than signal, were excluded. Continuous EEG data was epoched from −1500 to 2000 ms around stimulus onset. Eye movement contamination (blinks were rare as eyes were closed, vertical and horizontal saccades or slow movements were also infrequent), muscle artefacts (i.e. cardiac and neck movements) were removed from data before further processing using an independent component analysis (ICA) (Delorme and Makeig 2004). All conditions yielded at least 96% of artefact-free trials. Trials (−2500 to 0 ms) that contained voltage fluctuations exceeding ± 200 μV, transients exceeding ± 100 μV were removed. No low-pass or high-pass filtering was performed during the pre-processing stage. The EEGLAB MATLAB toolbox was used for data pre-processing and pruning (Delorme and Makeig 2004).
EEG time-frequency analysis
Epochs were grouped based on current and previous trial congruency, creating four trial conditions. Then, EEG-traces were decomposed into time-frequency charts from 2 Hz to 30 Hz in 15 linearly spaced steps (2 Hz per bin). The power spectrum of the EEG-signal (as obtained by the fast Fourier transform) was multiplied by the power spectra of complex Morlet wavelets  with logarithmically spaced cycle sizes ranging from 3 to 12. The inverse Fourier transform was then used to acquire the complex signal, which was converted to frequency-band specific power by squaring the result of the convolution of the complex and real parts of the signal (real[z(t)]2 + imag[z(t)]2). The resulting time-frequency data were then averaged per subject and trial type. Finally, time-frequency traces were transformed to decibels (dB) and normalized to a baseline of −400ms to −100 ms before stimulus onset, according to:
  (Cohen and van Gaal, 2014).
We tested the hypothesis that midfrontal theta-power would increase following the presentation of conflicting stimuli according to previous literature (Nigbur et al., 2012; Cohen and Ridderinkhof, 2013; Pastötter et al., 2013; Cohen and van Gaal, 2014). Therefore, we selected electrodes in a fronto-central spatial region of interest (ROI) to run our analyses (Figure 2). In order to find a time-frequency ROI for subsequent analyses in the spectral and information-theory domain, data from within the spatial ROI were averaged across the awake and drowsy experimental sessions for congruent and incongruent trials, separately. Next, current trial conflict was calculated (I-C) for all participants.
To test for significant time-frequency ROI in which overall conflict was present (Figure 2a), a cluster-based nonparametric statistical test implemented in FieldTrip (Maris and Oostenveld, 2007) was used. In brief, time-frequency charts (−200 to 1200 ms) were compared in pairs of experimental conditions (incongruent vs. congruent). For each such pairwise comparison, epochs in each condition were averaged subject-wise. These averages were passed to the analysis procedure of FieldTrip, the details of which are described elsewhere (Maris and Oostenveld, 2007). In short, this procedure compared corresponding temporal points in the subject-wise averages using independent samples t-tests for between-subject comparisons. Although this step was parametric, FieldTrip uses a nonparametric clustering method to address the multiple comparisons problem. t values of adjacent temporal points whose P values were lower than 0.05 were clustered together by summating their t values, and the largest such cluster was retained. This whole procedure, i.e., calculation of t values at each temporal point followed by clustering of adjacent t values, was then repeated 1000 times, with recombination and randomized resampling of the subject-wise averages before each repetition. This Monte Carlo method generated a nonparametric estimate of the p-value representing the statistical significance of the originally identified cluster. The cluster-level t value was calculated as the sum of the individual t values at the points within the cluster.
Then, time-frequency power was extracted from this ROI for each participant and used as input for (RM) ANOVAs between alertness (awake, drowsy), current trial congruency (congruent, incongruent) and previous trial congruency (congruent, incongruent). Subsequently, separate (RM) ANOVAs for the awake and drowsy conditions were performed on the same ROI data for post-hoc inspection of significant effects for conflict adaptation (current trial congruency vs previous trial congruency).
EEG source reconstruction
To visualize the brain origins of the univariate conflict effect, cortical sources of subject-wise averaged time-frequency charts within the theta-band ROI (Figure 2) were reconstructed using Brainstorm (Tadel et al., 2011). The forward model was calculated using the OpenMEEG Boundary Element Method (Gramfort et al., 2010) on the cortical surface of a template MNI brain (colin27) with 1 mm resolution. The inverse model was constrained using weighted minimum-norm estimation (Baillet et al., 2001) to calculate source activation. To plot cortical maps, grand-averaged activation values were baseline corrected by z-scoring the baseline period (−400 to −100 ms window) to each time point, and spatially smoothed with a 5-mm kernel. This procedure was applied separately for the overall, awake and drowsy conflict effect.
EEG multivariate spectral decoding
In addition to the univariate approach, a multivariate spectral decoding model was applied on the time-frequency data. This was done both because of the higher sensitivity of multivariate analyses, and well as to inspect if and to what extent different stimulus features (i.e. location and sound content) were processed in awake and drowsy conditions. The ADAM-toolbox was used on raw EEG data, that was transformed to time-frequency using default methods but with similar settings epochs: - 200ms to 1200ms, 2Hz-30Hz) (Fahrenfort et al., 2018). Trials were classified according to current trial stimulus content (i.e. sound location and sound content) resulting in 4 trial types. Note that this is different from the univariate analyses, where trials were classified according to current and previous trial conflict. As decoding algorithms are known to be time-consuming, data were resampled to 64Hz. Next, a backward decoding algorithm, using either stimulus location, stimulus sound contents or congruency as stimulus class, was applied according to a tenfold cross-validation scheme. A linear discriminant analysis (LDA) was used to discriminate between stimulus classes (e.g. left versus right ear bud location etc.) after which classification accuracy was computed as the area under the curve (AUC), a measure derived from Signal Detection Theory. AUC scores were tested per time-point with double-sided t-tests across participants against a 50% chance-level. These t-tests were corrected for multiple comparisons over time, using cluster-based permutation tests (p<0.05, 1000 iterations). This procedure yields time clusters of significant above-chance classifier accuracy, indicative of information processing. Note that this procedure yields results that should be interpreted as fixed effects (Allefeld et al., 2016), but is nonetheless standard in the scientific community.
Information sharing analysis: weighted symbolic mutual information (wSMI)
In order to quantify the information sharing between electrodes we computed the weighted symbolic mutual information (wSMI) (King et al., 2013; Sitt et al., 2014; Imperatori et al., 2019). It assesses the extent to which the two signals present joint non-random fluctuations, suggesting that they share information. wSMI has three main advantages: (i) it allows for a rapid and robust estimation of the signals’ entropies; (ii) it provides an efficient way to detect non-linear coupling; and (iii) it discards the spurious correlations between signals arising from common sources, favouring non-trivial pairs of symbols. For each trial, wSMI is calculated between each pair of electrodes after the transformation of the EEG signals into sequence of discrete symbols discrete symbols defined by the ordering of k time samples separated by a temporal separation τ. The symbolic transformation depends on a fixed symbol size (k = 3, that is, 3 samples represent a symbol) and a variable τ between samples (temporal distance between samples) which determines the frequency range in which wSMI is estimated. In our case, we chose τ = 32 to specifically isolate wSMI in theta-band. The frequency specificity f of wSMI is related to k and τ as:

As per the above formula, with a kernel size k of 3, τ values of 32 ms hence produced a sensitivity to frequencies below 10 Hz with and spanning the theta-band (~4-9 Hz). wSMI was estimated for each pair of transformed EEG signals by calculating the joint probability of each pair of symbols. The joint probability matrix was multiplied by binary weights to reduce spurious correlations between signals. The weights were set to zero for pairs of identical symbols, which could be elicited by a unique common source, and for opposite symbols, which could reflect the two sides of a single electric dipole. wSMI is calculated using the following formula:
 where x and y are all symbols present in signals X and Y respectively, w(x,y) is the weight matrix and p(x,y) is the joint probability of co-occurrence of symbol x in signal X and symbol y in signal Y. Finally, p(x) and p(y) are the probabilities of those symbols in each signal and K! is the number of symbols - used to normalize the mutual information (MI) by the signal’s maximal entropy. The time window in which wSMI was calculated was determined based on the significant time window observed in the spectral contrast of Figure 2a (380-660 ms).
Statistics
Statistical analyses were performed using MATLAB (2016a), Jamovi (Version 0.8.1.6) [Computer Software] (Retrieved from https://www.jamovi.org) (open source), and JASP Team (2018; JASP; version 0.8.4 software) statistical software.
Acknowledgments
This research was supported by a Wellcome Trust Biomedical Research Fellowship WT093811MA (TAB).
Footnotes
↵* Shared senior authors


