

Abstract
Large-scale genomic and transcriptomic initiatives offer unprecedented insight into complex traits, but clinical translation remains limited by variant-level associations without biological context and lack of analytic resources. Our resource, PhenomeXcan, synthesizes 8.87 million variants from genome-wide association study (GWAS) summary statistics on 4,091 traits with transcriptomic data from 49 tissues in Genotype-Tissue Expression (GTEx) v8 into a gene-based, queryable platform including 22,515 genes. We developed a novel Bayesian colocalization method, fastENLOC, to prioritize likely causal gene-trait associations. We successfully replicate associations from PheWAS Catalog (AUC=0.62), OMIM (AUC=0.64), and an evidence-based curated gene list (AUC=0.67). Using PhenomeXcan results, we provide examples of novel and underreported genome-to-phenome associations, complex gene-trait clusters, shared causal genes between common and rare diseases via further integration of PhenomeXcan with ClinVar, and potential therapeutic targets. PhenomeXcan (phenomexcan.org) provides broad, user-friendly access to complex data for translational researchers.
One Sentence Summary PhenomeXcan is a gene-based resource of gene-trait associations, providing biological contexts for translational research.
Introduction
Unprecedented advances in genetic technologies over the past decade have identified over tens of thousands of variants associated with complex traits (1). Translating these variants into actionable targets for precision medicine or drug development, however, remains slow and difficult (2). Existing catalogs largely organize associations between genetic variants and complex traits at the variant level rather than by genes, and often are confined to a narrow set of genes or traits (3). This has greatly limited development and application of large-scale assessments that account for spurious associations between variants and traits. As a result, only 10 percent of genes are under active translational research, with a strong bias towards monogenic traits (4, 5).
Complex diseases are generally polygenic, with many genes contributing to their variation. Concurrently, many genes are pleiotropic, affecting multiple independent traits (6). Phenome-wide association studies (PheWAS) aim to complement genome-wide association studies (GWAS) by studying pleiotropic effects of a genetic variant on a broad range of traits. Many PheWAS databases aggregate individual associations between a genetic variant and a trait, including GeneATLAS (778 traits from the UK Biobank (http://geneatlas.roslin.ed.ac.uk/trait/)) (7), GWAS Atlas (4,155 GWAS examined over 2,965 traits (https://atlas.ctglab.nl/)) (8), and PhenoScanner (over 5,000 datasets examined over 100 traits (http://www.phenoscanner.medschl.cam.ac.uk/)) (9). Other PheWAS databases are constructed based on polygenic scores estimated from multiple variants per GWAS locus (10), latent factors underlying groups of variants (11) or variants overlapping between GWAS and PheWAS catalogs (12). By building associations directly from variants (most of which are non-coding), most PheWAS results lack mechanistic insight that can support proposals for translational experiments. Genes are primarily assigned to PheWAS results by genomic proximity to significant variants, which can be misleading (13). Some studies have attempted to improve translation of PheWAS results using gene sets and pathways (14) or networks of PheWAS variants and diseases (15, 16). However, these studies rely on the same variant-trait associations on which PheWAS are built and fall short of prioritizing likely actionable targets.
Integration of genomic, transcriptomic and other regulatory and functional information offers crucial justification for therapeutic target identification efforts, such as drug development (17). Translational researchers also need access to this integrated information in a comprehensive platform that allows convenient investigation of complex relationships across multiple genes and traits.
To meet this need, we present PhenomeXcan, a massive integrated resource of gene-trait associations to facilitate and support translational hypotheses. Predicted transcriptome association methods test the mediating role of gene expression variation in complex traits and organize variant-trait associations into gene-trait associations supported by functional information (18 – 20). These methods can describe direction of gene effects on traits, supporting how up- or down-regulation may link to clinical presentations or therapeutic effects. We trained transcriptome-wide gene expression models for 49 tissues using the latest Genotype-Tissue Expression data (GTEx; v8) (21) and tested the predicted effects of 8.87 million variants across 22,515 genes and 4,091 traits using an adaptation of the PrediXcan method (18), Summary-MultiXcan, that uses summary statistics and aggregates results across tissues (22). We then prioritized genes with likely causal contributions to traits using colocalization analysis (23). To make computation feasible given the large scale of data in this study, we developed fastENLOC, a novel Bayesian hierarchical colocalization method (see Methods). We showed separately that this approach of combining an association and a colocalization method performs better than each method individually at prioritizing causal genes and is comparable to baselines such as the nearest gene while incorporating greater biological context (24). We demonstrate results from integrating this tool with a deeply annotated gene-trait dataset to identify associations; this integration can be performed in any deeply annotated database of genes and traits, including molecular or biological traits rather than disease traits. PhenomeXcan is the first massive gene-based (rather than variant-based) trait association resource. Our approach not only employs state-of-the-art techniques available to biologically prioritize genes with possible contributions to traits, but also presents information regarding pleiotropy and polygenicity across all human genes in an accessible way for researchers. Below, we provide several examples that showcase the translational relevance and discovery potential that PhenomeXcan offers.
Results
PhenomeXcan design and overall findings
We built a massive gene-to-phenome association resource that integrates GWAS results with gene expression and regulation data. We ran a version of PrediXcan (18), Summary-MultiXcan (S-MultiXcan), designed to use summary statistics and aggregate effects across tissues (22) on publicly available GWAS. In total, we tested the predicted effects of 8.87 million variants across 22,515 genes and 4,091 traits. Traits incorporate binary, categorical or continuous data types and range from basic anthropometric measurements to clinical traits and biochemical markers. We inferred association statistics (p-values and Z-scores) between predicted gene-expression variation and traits using optimal prediction models trained using 49 tissues from GTEx v8 (21, 25). LD contamination due to proximity between expression quantitative trait loci (eQTLs) and causal variants can produce non-causal, spurious gene-trait associations (21, 24). We therefore first performed Bayesian fine-mapping using the DAP-1/fgwas algorithm in TORUS (26, 27). We then calculated the posterior probability of colocalization between GWAS loci and cis-eQTLs to prioritize possible causal genes via fastENLOC, a newly developed Bayesian hierarchical method that uses pre-computed signal clusters constructed from fine-mapping of eQTL and GWAS data to speed up colocalization calculations. The result is a matrix of 4,091 traits and 22,515 genes in which each intersection contains a PrediXcan p-value aggregated across 49 tissues and refined by a locus regional colocalization probability (locus RCP) (Figure 1). While a given colocalization threshold may be arbitrary, to minimize false negatives given the conservative nature of colocalization approaches (24), we defined putative causal gene contributors as those genes with locus RCP > 0.1.
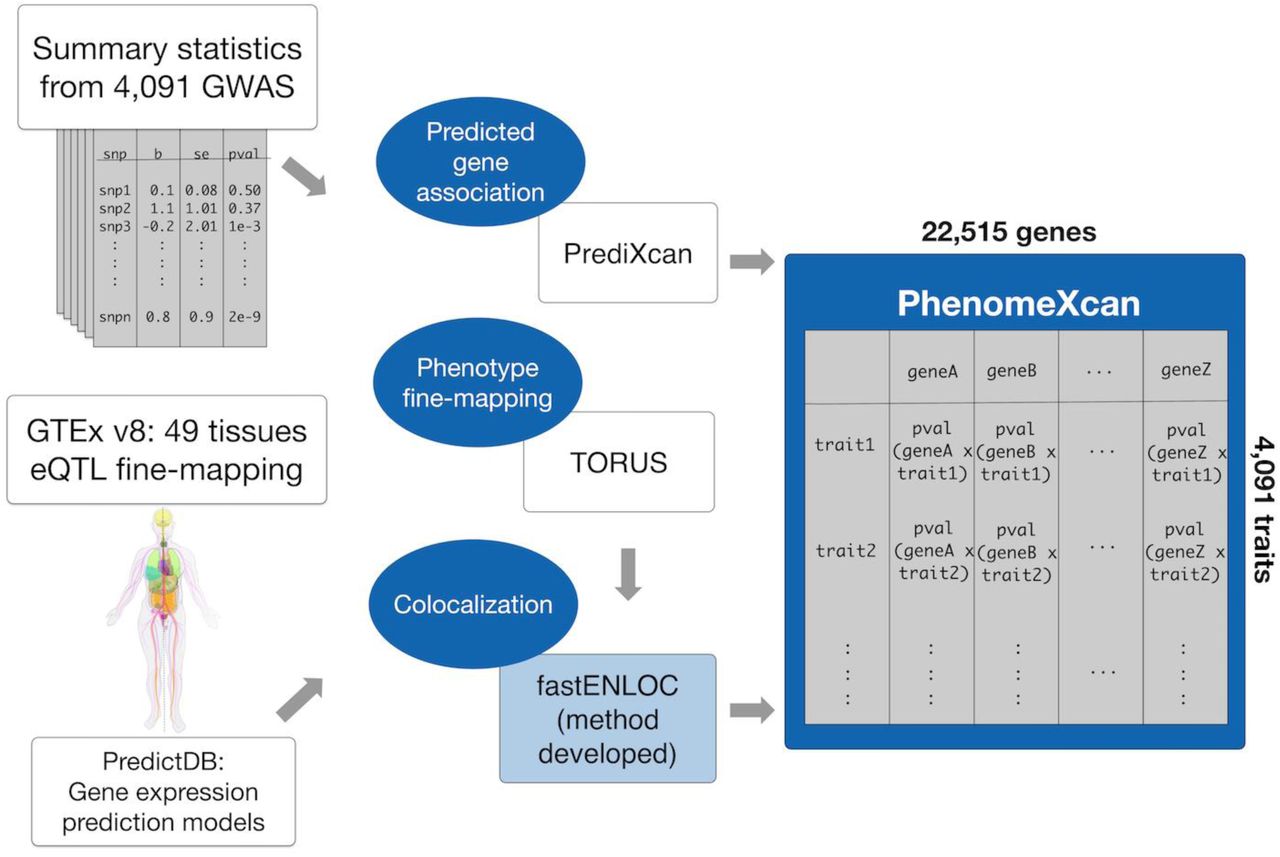
Blue areas highlight methods we performed for this project, with fastENLOC being a novel colocalization method developed in the context of PhenomeXcan development. We developed PhenomeXcan by integrating genome-wide association study (GWAS) summary statistics with Genotype-Tissue Expression data (GTEx; v8) using PrediXcan methodology, then performing fine mapping and colocalization to identify the most likely causal genes for a given trait. PhenomeXcan is a massive resource containing PrediXcan p-values across 4,091 traits and 22,515 genes, aggregated across 49 tissues and refined by locus regional colocalization probability.
We found 72,994 significant associations (Bonferroni-corrected p-value < 5.49 × 10⁻¹⁰) across the entire genome/phenome space, where 22,219 (30.5 percent) had locus RCP > 0.1 (Supplementary Table S1). We constructed a quantile-quantile plot of all associations, which did not show evidence of systematic inflation (Supplementary Figure S1). These associations represent numerous potential targets for translational studies with biological support.
Replicating known gene-trait associations
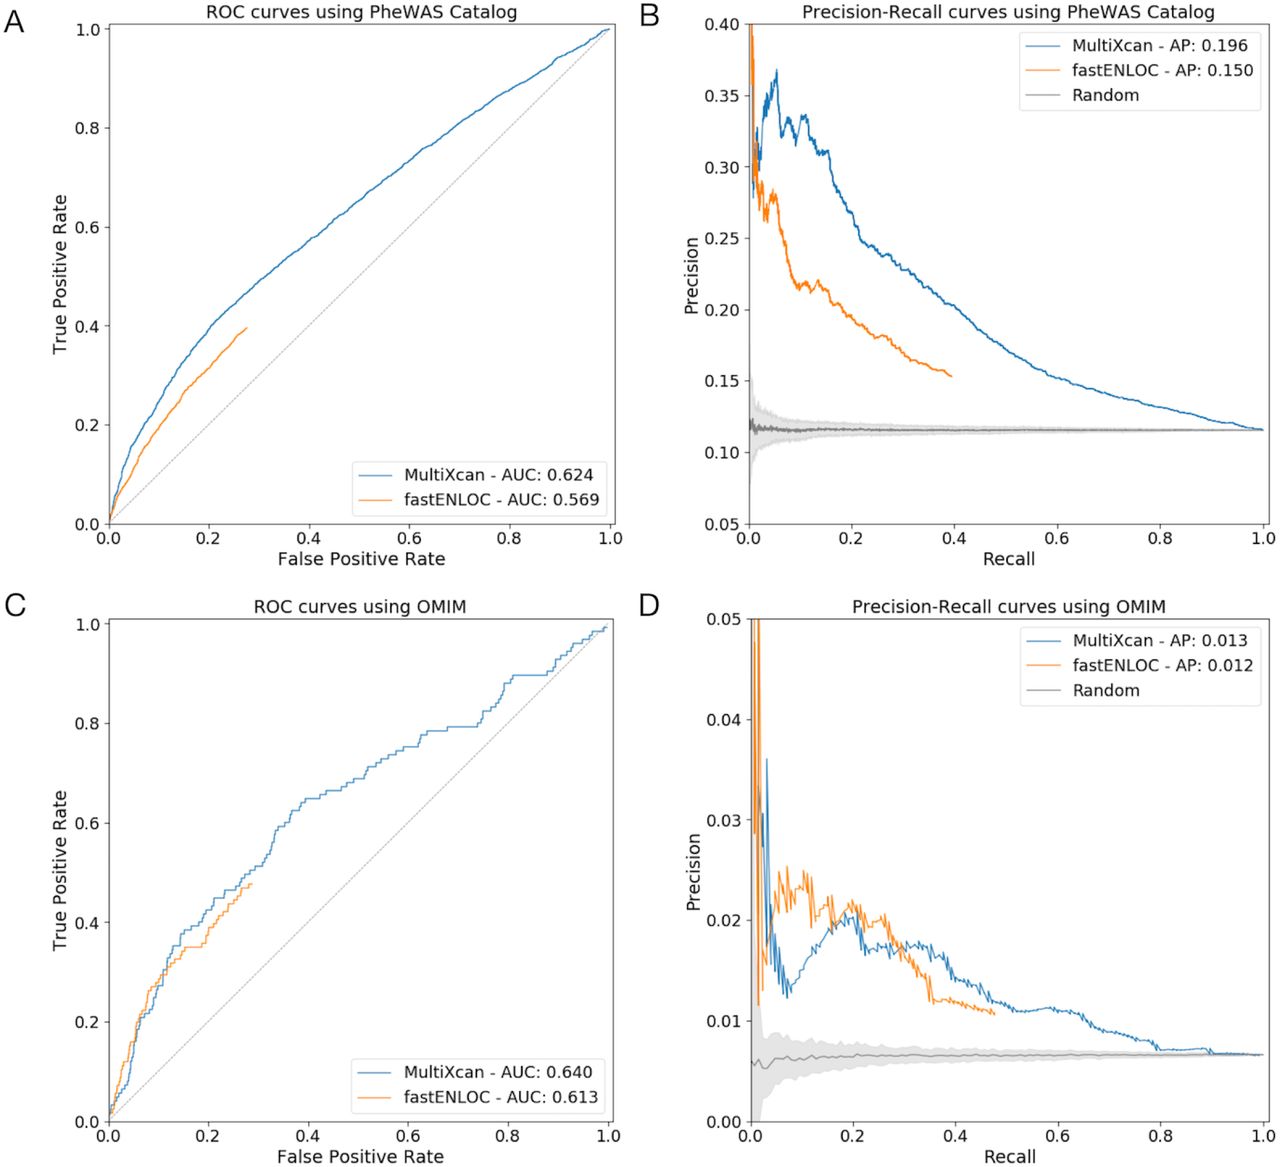
We evaluated PhenomeXcan’s performance using three different, independent validation approaches. For the first validation, we compared significant results from PhenomeXcan to significant results from the PheWAS Catalog, which combines the NHGRI-EBI GWAS catalog (as of 4/17/2012) and Vanderbilt University’s electronic health record to establish unique associations between 3,144 variants and 1,358 traits (https://phewascatalog.org/phewas) (12, 28). These gene-trait pairs, mapped to GWAS loci mostly by proximity, are likely enriched in but do not necessarily represent causal genes. We mapped traits from PhenomeXcan to those in the PheWAS Catalog using the Human Phenotype Ontology (29). After filtering for genes included in both PhenomeXcan and the PheWAS Catalog, we tested 2,202 gene-trait associations. At a nominal threshold (p-value < 0.01), 1,005 PhenomeXcan gene-trait associations replicated with matched traits in the PheWAS catalog (AUC = 0.62; Figure 2A). Considering different methods of gene assignments for each GWAS locus (PheWAS: proximity, PhenomeXcan: PrediXcan and Bayesian colocalization), we further evaluated our replication rate using random classifiers in a precision-recall curve (Figure 2B) and found significant replicability between PhenomeXcan and PheWAS results (empirical p-value < 0.01).

MultiXcan refers to the version of PrediXcan designed to take GWAS summary statistics and aggregate results across tissues (22). (A, B) ROC curve and PR curve of PrediXcan significance scores (blue) and fastENLOC (orange) to predict PheWAS catalog gene-trait associations. (C, D) ROC curve and PR curve of PrediXcan significance scores (blue) and fastENLOC (orange) to predict OMIM catalog gene-trait associations. AUC refers to the area under the curve, AP refers to average precision. The predictive ability of both PrediXcan and fastENLOC demonstrate the statistical validity of PhenomeXcan associations. The maximum fastENLOC colocalization probability across tissues was used for all figures.
For the second validation, we identified a set of high-confidence gene-trait associations using the Online Mendelian Inheritance in Man (OMIM) catalog (30). We previously demonstrated that integrated analysis using PrediXcan (18) and colocalization (23) successfully predicts OMIM genes for matched traits (24). We mapped 107 traits from PhenomeXcan to those in OMIM using the Human Phenotype Ontology (29) and curated a list of 7,809 gene-trait associations with support for causality. We compared gene-trait associations from this standard near GWAS loci (Supplementary Table S2) and found that both PrediXcan and fastENLOC in PhenomeXcan successfully predict OMIM genes (AUC = 0.64; Figure 2C). The combination of PrediXcan and fastENLOC improves precision in this dataset (Supplementary Figure S2). The limited precision seen here is expected in the setting of genes, such as those in OMIM, with large effects and rare variants (Figure 2D).
The conservative nature of colocalization analysis can lead to increased false negatives (24), which may contribute to decreased performance of fastENLOC.
For the third validation approach, we applied a “medium-throughput” approach to examine a disease trait with multiple functionally established gene-trait associations. The Accelerating Medicines Partnership: Type 2 Diabetes Knowledge Portal (AMP T2D) curates a list of genes with causal, strong, moderate, possible and weak associations to type 2 diabetes based on functional data (31) (Supplementary Table S3). We tested the ability of both PrediXcan and fastENLOC in PhenomeXcan to successfully predict the causal, strong and moderate genes curated by AMP T2D paired with 7 UK Biobank traits: “Type 2 diabetes,” “Type 2 diabetes without complications,” “Type 2 diabetes with ophthalmic complications,” “Type 2 diabetes with peripheral circulatory complications,” “Self-reported type 2 diabetes,” “Non-insulin dependent diabetes mellitus” and “Unspecified diabetes mellitus.” PhenomeXcan successfully predicted the causal gene list for type 2 diabetes (AUC = 0.67; Figure 3A and B).

MultiXcan refers to the version of PrediXcan designed to take GWAS summary statistics and aggregate results across tissues (22). (A, B) ROC curve and PR curve of PrediXcan significance scores (blue) and fastENLOC (orange) to predict significant associations between a curated gene list from the Accelerating Medicines Partnership: Type 2 Diabetes Knowledge Portal and type 2 diabetes traits. AUC refers to the area under the curve, AP refers to average precision. PrediXcan and fastENLOC, particularly PrediXcan, demonstrate predictive ability in the setting of a disease trait with 20 genes with causal, strong and moderate evidence and present in LD blocks with GWAS signal. The maximum fastENLOC colocalization probability across tissues was used for all figures.
Identifying novel and underreported gene-trait associations
PhenomeXcan provides a resource for hypothesis generation using gene-trait associations, with over 22,000 potentially causal associations (p-value < 5.49 × 10⁻¹⁰, locus RCP > 0.1; Supplementary Table S1). As case studies, we discuss associations identified based on trait (“Morning/evening person (chronotype)”) and gene (TPO).
We reviewed the 15 most significant genes associated with “Morning/evening person (chronotype)” (a UK Biobank trait) based on PrediXcan p-values across the 49 tissues and locus RCP > 0.1 (Supplementary Table S4). Three of 15 genes had not been previously reported in any GWAS involving UK Biobank subjects related to sleep or chronotype: VIP, RP11-220I1.5 and RASL10B. Notably, a variant associated with VIP (p-value=1.812 × 10⁻¹⁷, locus RCP=0.26) is discussed in a GWAS of 89,283 individuals from the 23andMe cohort who self-report as “a morning person” (rs9479402 near VIP, 23andMe GWAS p-value=3.9 × 10⁻¹¹) (32). VIP produces vasoactive intestinal peptide, a neurotransmitter in the suprachiasmatic nucleus associated with synchronization of circadian rhythms to light cycles (33). The long noncoding RNA RP11-220I1.5 (p-value=6.427 × 10⁻¹¹, locus RCP=0.20) and the gene RASL10B (p-value=1.098 × 10⁻¹⁰, locus RCP=0.15) have not been previously reported in any GWAS or functional/clinical studies associated with this trait. RASL10B produces a 23 kiloDalton GTPase protein that demonstrates overexpression in the basal ganglia in GTEx (21), potentially representing a novel association. Besides VIP, three other genes in this set had clinical/functional studies associated with sleep or chronotype in PubMed: RAS4B, CLN5 and FBXL3. RAS4B (p-value=1.660 × 10⁻¹⁹, locus RCP=0.63) was linked to a transcriptional network regulated by LHX1 involved in circadian control (34). CLN5 (p-value=5.248 × 10⁻¹⁸, locus RCP=0.34) mutations are associated with neuronal ceroid lipofuscinosis, which can manifest with sleep-specific dysfunction (35). FBXL3 (p-value=1.54 × 10⁻¹⁶, locus RCP=0.35) assists with turnover of the CRY protein through direct interaction to regulate circadian rhythms (36). Our results were also significant for the overlapping genes PER3 (p-value=1.65 × 10⁻¹⁷, locus RCP=0.08) and VAMP3 (p-value=7.317 × 10⁻¹⁸, locus RCP=0.63). PER3 is one of the Period genes characterized as part of the circadian clock and described in numerous functional studies, animal models and human polymorphism association studies (37), whereas VAMP3 has little research in chronotype or sleep. VAMP3, in this instance, is likely to be a false positive in the setting of the overlapping gene structure and co-regulation. We also reviewed PhenomeXcan’s performance in associating chronotype traits with well-established circadian rhythm genes that have been identified through functional approaches. In mammals, the transcription factors CLOCK and BMAL1 influence the expression of the Period genes (PER1, PER2) and the Cryptochrome genes (CRY1 and CRY2). PER3 stabilizes PER1 and PER2 (38). NPAS2 acts as a paralog to CLOCK. All genes demonstrated nominal significance (p-value < 0.01) with at least one chronotype trait in PhenomeXcan except CRY2 (strongest association p-value=0.11) and CLOCK (strongest association p-value=0.08). Except for PER1 (locus RCP=0.24) and NPAS2 (locus RCP=0.12), all genes showed locus RCP<0.1.
PhenomeXcan, to our knowledge, is one of the first hypothesis-generating tools to provide unbiased links between a trait and associated genes for the researcher’s evaluation. In conjunction with rich knowledge obtained from functional studies, PhenomeXcan can be used to generate or support subsequent translational efforts.
We next evaluate PhenomeXcan as a platform to study novel and underreported gene-trait associations. Thyroid peroxidase (TPO) encodes a membrane-bound glycoprotein that plays a crucial role in thyroid gland function (39). The strongest associations in PhenomeXcan support the known role of TPO in thyroid hormone production: “Self-reported hypothyroidism or myxedema” (p-value=1.40x 10⁻¹⁴, locus RCP=0.99) and “Treatment with levothyroxine” (p-value=1.54x 10⁻¹⁰, locus RCP=0.99). Hypothyroidism has been clinically linked to increased respiratory symptoms. Although the mechanism for this is not well understood (40), our results suggest that these could be explained by common genetic factors; “Treatment with salmeterol” (a medication used to treat lung disease such as asthma or chronic obstructive pulmonary disease) showed moderate associations with TPO in PhenomeXcan (p-value=7.45x 10⁻⁵, locus RCP < 0.1). TPO is also contained in the NIH Biosystems Pathways for the development of pulmonary dendritic cells (41). “Time to complete round” (drawing as a measure of cognitive function) showed another moderate association in PhenomeXcan (p-value=1.19x 10⁻⁴, locus RCP < 0.1). Thyroid function has been clinically linked to time to draw a clock as a form of cognitive measurement (42). Other trait associations identified in PhenomeXcan with TPO include “Single major depression episode” (p-value=2.48x 10⁻⁴, locus RCP < 0.1) and “Treatment with doxazosin” (a medication used in the UK for hypertension) (p-value=8.80 × 10⁻⁴, locus RCP<0.1), both of which have demonstrated clinical association with thyroid abnormalities (43, 44). When reviewing thyroid dysfunction traits in PhenomeXcan, TPO is among the 35 most significantly associated genes, with the others primarily involved in immune regulation or the hypothalamic-pituitary-thyroid axis.
To our knowledge, depression and doxazosin use have not been deeply investigated with TPO previously, highlighting how PhenomeXcan may be useful in expanding gene-trait association studies and functional studies through consideration of independent traits associated with a given gene.
Revealing complex clusters of pleiotropy and polygenicity for translational hypotheses
PhenomeXcan allows more complex investigation of associated genes and traits beyond individual queries. As an example, to study genes associated with white blood cell count, we can cluster related genes and traits. Starting from the trait “Lymphocyte percentage,” the top associated genes include PSMD3, CD69, KLF2, CXCL2, CREB5, CXCL3, ZFP36L2, JAZF1, NCOR1, and TET2. These genes represent pathways associated with chemokine and interleukin signaling as well as peptide ligand binding, but are not specific to one particular pathway or genomic location (45). We can assess these genes’ associations with white blood cell traits (neutrophil count/percentage, lymphocyte count/percentage, eosinophil count/percentage, monocyte and basophil percentages) and infer some understanding of their causal mechanism. PSMD3, for instance, demonstrates stronger associations with neutrophil and lymphocyte traits (mean p-value < 1x 10⁻³⁰, mean locus RCP=0.50), whereas ZFP36L2 demonstrates consistent associations across white blood cell, platelets and red blood cell traits (mean p-value < 1.54 × 10⁻²⁴, mean locus RCP=0.36) (Figure 4). Disruption of ZFP36L2 results in defective hematopoiesis in mice (46), whereas PSMD3 has been identified in genome-wide association studies related to white blood cell count and inflammatory states (47). Clusters of associated genes and traits can support more robust translational hypotheses through similarities in associations and generate more nuanced experimental designs through differences between associations.

Z-scores are derived from PrediXcan p-values, with the ceiling of association (dark blue) > or equal to 7. In this heatmap, we demonstrate the associations between the genes PSMD3, CD69, KLF2, CXCL2, CREB5, CXCL3, ZFP36L2, JAZF1, NCOR1, and TET2 and the white blood cell traits “Neutrophil count” and “Neutrophil percentage”, “Lymphocyte count” and “Lymphocyte percentage”, “Eosinophil count” and “Eosinophil percentage”, “Monocyte percentage” and “Basophil percentage.” “Platelet count” and “mean corpuscular volume” (for red blood cells) serve as alternate blood traits. ZFP36L2 has consistent associations across platelets and red blood cells relative to other genes. Accordingly, functional studies demonstrate ZFP36L2 plays a role in hematopoiesis, whereas studies support the others genes’ involvement in inflammation-related pathways or diseases. These types of clusters can support hypotheses and experimental designs regarding the mechanisms through which genes contribute to traits.
Discovering links between common traits and rare diseases
PhenomeXcan can also be integrated with any gene-trait databases to study pleiotropically linked traits and shared associated genes. We integrated PhenomeXcan with ClinVar, a publicly available archive of rare human diseases and associated genes (including OMIM) and one of the most widely used gene-trait databases in the clinical setting (48). We examined the associations between the 4,091 GWAS-derived traits in PhenomeXcan and 5,094 ClinVar diseases by (a) calculating PrediXcan Z-scores for every gene-trait association in PhenomeXcan and (b) for each PhenomeXcan/ClinVar trait pair, we computed the average squared PrediXcan Z-score considering the genes reported in the ClinVar trait (see Methods). We then created a matrix of PhenomeXcan traits by ClinVar traits with mean squared Z-scores (Figure 5A, Figure 5B), where peaks represent shared genes. We defined significant associations between traits as those with Z-score 6; this represents the equivalent of a Bonferroni-adjusted p-value of 0.05 based on our map of the distribution of Z-scores (Supplementary Figure S3).

(A) Schematic depicting the development of PhenomeXcan x ClinVar. For each PhenomeXcan/ClinVar trait pair, we computed the average squared PrediXcan Z-score considering the genes reported in the ClinVar trait. (B) Heatmap visualizing the overall structure of associations in PhenomeXcan x ClinVar. Darker blue represents stronger association. Again, complex clusters of inter-trait associations can be identified to link common traits and rare diseases. Queries for traits or genes of interest can be submitted through a web application at phenomexcan.org. (C) Heatmap demonstrating an example linked traits in PhenomeXcan (rows) and ClinVar (columns) using the association between Parkinson’s disease and red blood cell traits. We see the strongest associations between mean corpuscular volume, mean reticulocyte volume and mean spherical red cell volume and “Parkinson disease 15.” In ClinVar, each variant of Parkinson’s disease linked to a different gene is listed under a different number, making it unsurprising that associations to other forms of Parkinson’s disease are not as strong.
As an example, we found links between the ClinVar trait “Parkinson disease 15” and the following traits: mean corpuscular volume, mean reticulocyte volume and mean spherical red cell volume (Figure 5C). The gene linked to “Parkinson disease 15” in ClinVar is FBXO7. The mean Z-score across eight red blood cell traits was 21.14; the mean locus RCP was 0.84 with p-values all < 1 × 10⁻³⁰). FBXO7 plays a role in the ubiquitin system; its entry in ClinVar is associated with an autosomal recessive, juvenile-onset form of Parkinson’s disease (49). Three GWAS (the HaemGen consortium, eMERGE, and van der Harst et al) link FBXO7 with red blood cell attributes including mean corpuscular volume and mean cell hemoglobin (50–52). At least one mouse model describes defective erythropoesis and red blood cell changes due to induced mutations in FBXO7 (53). Through PhenomeXcan, we discover a pleiotropic relationship between Parkinson’s disease and red blood cell traits mediated through FBXO7 that has not been studied in humans. The nearest adjacent genes, SYN3 and BPIFC, are unlikely to be separately affecting red blood cells; they have no published association to red blood cells and demonstrate mean locus RCPs with red blood cell traits in PhenomeXcan of 0.55 and 0 respectively. Validating this finding, one mouse model specifically studies the pleiotropy of FBXO7 on both Parkinsonism and red blood cell traits (54). This case study demonstrates how this powerful variation on PhenomeXcan can significantly improve translational hypothesis generation by supporting genetic links between associated rare diseases and common traits across research platforms.
Identification of potential therapeutic drug targets and related adverse effects
PhenomeXcan offers direct translational applicability, providing genomic evidence to support therapeutic targets and associated side effects. As an example, PCSK9 is a genetically supported, clinically validated target for cardiac prevention through inhibition of its binding to the LDL receptor and reduction of blood LDL cholesterol levels (55). We can study the cluster of genes and traits produced by PCSK9 in PhenomeXcan for relevant information about this target. Most of the traits with strongest associations to PCSK9 relate to diagnosis and treatment of elevated cholesterol or atherosclerosis, including familial heart disease. Because inherited PCSK9 variation is associated with increased likelihood of type 2 diabetes, there was concern that PCSK9 therapies could elevate risk to type 2 diabetes. The inhibiting drugs therefore required large substudies from clinical trials to confirm no association with worse diabetes (56, 57). While not at genome-wide significance, PCSK9 has a negative association with type I diabetes in PhenomeXcan (p-value=8.2 × 10⁻⁴, locus RCP<0.1), consistent with the clinical concern that downregulation of the gene could lead to increased diabetes risk. We recognize that type I and type 2 diabetes have different clinical etiologies. For the purpose of drug development, though, assessing PCSK9 in PhenomeXcan produces both its primary target (blood cholesterol levels as related to atherosclerosis) and, through independently identified traits, potential adverse effects via diabetes. The most commonly represented genes associated with the strongest traits for PCSK9 include APOE, LDLR, APOB, PSRC1, CELSR2, SORT1, ABCG8, ABCG5, and HMGCOR. Unsurprisingly, all of these genes have all been implicated in genetic susceptibility to hypercholesterolemia (some, such as SORT1, may be the primary causative gene in their pathway) (58). Examining potential targets in PhenomeXcan could not only help anticipate side effects via independent traits, but also identify related gene networks / alternative targets with therapeutic relevance.
Discussion
In this paper, we introduce PhenomeXcan, an innovative, powerful resource that makes comprehensive gene-trait associations easily accessible for hypothesis generation. Using PrediXcan allows us to derive gene-based associations with traits in context by integrating GWAS summary statistics with transcriptome-wide predicted expression and regulatory / functional information. We previously demonstrated that integrated analysis using PrediXcan and colocalization improves precision and power for target gene identification (24). To build PhenomeXcan, we also develop a novel, rapid colocalization method, fastENLOC, that could handle data at this scale (4,091 traits x 22,515 genes x 49 tissues) (see Methods). PhenomeXcan implements the best practices derived from applying GTEx v8 (21, 59) to biologically prioritize genes with possible causal contribution to a given trait.
PhenomeXcan’s flexible structure and adaptability allow translational researchers to easily explore clinically relevant questions. The resource can be queried by gene or trait and allows identification of novel and underrepresented associations. It offers exploration of polygenicity and pleiotropy dimensions by allowing for queries across multiple genes and traits. It can also be integrated with other gene-trait datasets to explore linked traits and report common associated genes. We offer ClinVar as an example, but any deeply annotated database of genes and traits, including molecular or biological traits, may be integrated in this manner. Other possible translational uses of PhenomeXcan include biomarker exploration, identification of clinically relevant disease modifiers, and polygenic score building (using genes associated with queried traits), as well as novel directions for basic science collaborations and clinical study of linked traits (using traits associated with queried genes).
We note some caveats. Diseases with variability not related to changes in gene expression (e.g. epigenetic regulation or traits with important environmental contributions) are not expected to be captured well by this method. With just expression levels, this resource is a starting point, and additional molecular traits, such as miRNA levels, protein levels, alternative splicing structures, are a priority for us to incorporate as data becomes available in sufficiently large sample sizes. Our model also better captures common overall genetic contributors rather than genes identified from rare variants. We do note that our validation standards tend to favor larger-effect genes with monogenic etiology, while the PhenomeXcan association method itself is less biased. Regulatory pleiotropy is widespread across the genome (21). In our chronotype example, VAMP3 and PER3 demonstrate regulatory pleiotropy. VAMP3, from our findings associated with chronotype, is likely to be a false positive due to co-regulation of both genes by causal variants. With that degree of proximity, large-scale tools are not able to distinguish causal genes well, exemplifying the need for additional functional data to determine the causality of the gene (21). We discuss this finding to acknowledge how PhenomeXcan encounters this phenomenon and show the benefit of performing these associations across all human genes. We offer colocalization as a possible means of prioritizing causal variants, but significance of association, colocalization and co-regulatory sites must be taken into account in our results. Work from large-scale statistical genetics tools, such as PhenomeXcan, and Mendelian genetics / functional studies must then be combined in order to best understand the breadth of genetic contributors to complex traits. We have favored a locus RCP threshold of 0.1 to limit false negatives related to colocalization. Poor regional colocalization probability (locus RCP~0) may reflect a lack of sufficient evidence with available data, particularly for understudied genes, rather than true lack of causality. We therefore reported traits in this paper that had a locus RCP < 0.1, but had functional support for potential association. Similarly, the genome-wide threshold of significance is conservative, and we discuss associations with functional support even with less significant p-values. Importantly, GWAS summary statistics used in this project were for subjects and patients of European ancestry. Improving the applicability of this type of work to global populations remains of paramount importance throughout genetic medicine, and we will continue to integrate more GWAS summary statistics from broader consortia.
Resources that translate biologically relevant genomic and transcriptomic information into gene-trait associations are already critical for hypothesis generation and clinically relevant research (60). We offer PhenomeXcan, an integrated mapping for the function of every human gene, as a publicly available resource to advance the investigation of complex human diseases by improving the accessibility of relevant links between the entire genome and the phenome.
Materials and Methods
Trait selection and preprocessing/quality control of variants
We developed PhenomeXcan with 4,091 traits from publicly available GWAS summary statistics. Summary statistics from GWAS performed for 4,049 traits from the UK Biobank (on 361,194 samples) were obtained from the publicly available dataset compiled by the Neale Lab at the Broad Institute (61); we did not use individual-level data. The UK Biobank is a prospective cohort of approximately 500,000 subjects between 40 and 69 years of age, recruited from 2006-2010 in the United Kingdom (62). Traits characterized by the Neale lab include 2,891 auto-curated traits using PHESANT (63), of which 274 are continuous, 271 ordinal and 2,346 binary. 633 binary traits were extracted from hospital-level data (ICD-10 codes). 559 traits were manually curated in collaboration with the FinnGen Consortium. Traits available cover a range of categories, from lifestyle traits and socio-demographic questions to clinical biomarkers and diagnoses. Separate sex-specific summary statistics and sex chromosome analyses were not included in this project. More details on the GWAS derivations and quality control is provided in the website of the project: http://www.nealelab.is/uk-biobank. We do note that for these GWAS, 361,194 individuals were selected for inclusion based on quality of genotypes, white British ancestry (based on both self-report and principal components analysis). Only those variants with an imputation quality score (INFO) > 80%, a minor allele frequency (MAF) > 0.1%, call rate > 95% and a Hardy-Weinberg equilibrium p-value > 1 × 10⁻¹⁰ were selected.
We also compiled 42 additional traits from summary statistics from publicly available GWAS and GWAS-meta analyses external to the UK Biobank study both to validate synthesis of additional GWAS data and to overcome limitations related to poor sample sizes in the UK Biobank for specific diseases (e.g. breast cancer). These GWAS and traits represent a broad array of disease-related categories, including immunological response, psychiatric and neurologic traits, cardiometabolic diseases and syndromes and cancer. We have previously described the harmonization and imputation process (24) (Supplementary Table S5).
ClinVar is a publicly available archive of clinically reported human genetic variants and associations with disease maintained by the National Institutes of Health (https://www.ncbi.nlm.nih.gov/clinvar/). Variant associations with disease are identified by manual review of submitted interpretations from “clinical testing laboratories, research laboratories, locus-specific databases, Online Mendelian Inheritance of Man (OMIM), GeneReviews, UniProt, expert panels and practice guidelines” (30, 48). Traits can be reported to ClinVar as a single concept or set of clinical features. When possible, traits are mapped manually to standardized terms from databases including OMIM and the Human Phenotype Ontology (HPO) (29). All gene-trait associations published by ClinVar for 7/2019 were used for integration with PhenomeXcan.
PrediXcan and Summary-MultiXcan (S-MultiXcan)
S-MultiXcan is a method in the PrediXcan family (18) that associates genes and traits by testing the mediating role of gene expression variation in complex traits, but (a) requires only GWAS summary statistics and (b) uses multivariate regression to combine expression information across tissues (22). First, linear prediction models of genotype in the vicinity of the gene to expression are trained in reference transcriptome datasets such as the Genotype-Tissue Expression project (GTEx) (21). Second, predicted expression based on actual genetic variation is correlated to the trait of interest to produce a gene-level association result for each tissue. In S-MultiXcan, the predicted expression is a multivariate regression of expression across multiple tissues. In order to avoid collinearity issues and numerical instability, the model decomposes the predicted expression matrix into principal components and keeps only the eigenvectors of non-negligible variance. We considered a PCA regularization threshold of 30 to be a conservative choice. This approach improves detection of associations relative to use of one tissue type alone and offers a reduced false negative rate relative to a Bonferroni correction. We used optimal prediction models based on the number and proportion of colocalized gene level associations (24). These models select features based on fine-mapping (25) and weights using eQTL effect sizes smoothed across tissues using mashr (59). The result of this approach is a genome-wide gene-trait association list for a given trait and GWAS summary statistic set.
Colocalization of GWAS and eQTL signals
Bayesian fine-mapping was performed using TORUS (27). We estimated probabilities of colocalization between GWAS and cis-eQTL signals using Bayesian regional colocalization probability, as described in the ENLOC methodology (23). For this particular study, given the large scale of the data, we developed a novel implementation, entitled fastENLOC. fastENLOC was applied for all trait-tissue pairs, and the maximum colocalization probability across all tissues was used, thus obtaining a single RCP value for each gene-trait pair. This aggregation of RCP values across tissues allowed us to combine results from fastENLOC and S-MultiXcan.
fastENLOC
fastENLOC is a novel computational method built upon the existing colocalization analysis framework of ENLOC (23). As in the original ENLOC, fastENLOC estimates the relative enrichment of causal eQTLs in the GWAS hits. This is a distinct feature from other existing colocalization approaches. For example, eCAVIAR assumes that the probability of a variant being causal for a trait is independent of the probability of the variant causally affecting gene expression, which results in rapid processing but can be too conservative (64); whereas “coloc” allows users to specify enrichment parameter subjectively (65). However, the inappropriate parameter setting can introduce systematic false-positive and false-negative colocalization findings (64, 65). fastENLOC also follows the ENLOC approach to compute and report both SNP-level colocalization probabilities (SCPs) and region/locus-level colocalization probabilities (RCPs), although the probability computation is improved and the selection of genetic loci becomes fully automatic in the new method.
The main innovation in the fastENLOC lies in its explicit usage of signal clusters/Bayesian credible sets computed from the Bayesian fine-mapping analysis. A signal cluster is a group of SNPs in LD and represents the same underlying genetic association signal. Currently, we note that fine-mapping algorithms DAP-G and SUSIE-R can generate the required signal clusters. The utilization of pre-computed signal cluster information from both GWAS and eQTL data greatly speeds up the overall colocalization analysis and achieves higher accuracy through better probability calibration and explicit accounting of allelic heterogeneity. This computation saving is particularly important in this application, where each of the 4000+ traits is tested for colocalization with eQTLs in 49 different tissues. In a benchmark test, we record the computational time of ENLOC and fastENLOC for colocalization analysis of whole blood eQTL data from the GTEx and the high-density cholesterol GWAS data from the Global Lipid Genetic Consortium (GLGC) (66). In this experiment, we provide fine-mapped eQTL results from DAP-G and single-SNP z-scores from GLGC. On a Linux system with Xeon 2.13 GHz CPUs and 48 GB memory, the total processing times for fastENLOC and ENLOC were 6 minutes 44 seconds and 219 minutes 20 seconds, respectively. While the methodological innovation contributes to this performance improvement, the new computational implementation of fastENLOC (e.g., by reducing redundant I/O operations) also has a significant impact. Finally, we keep fastENLOC backwards compatible with the original ENLOC: in the simplest case, single-SNP association summary statistics from GWAS and eQTL analysis are sufficient to start the fastENLOC analysis with a fast pre-processing step via software package TORUS. The details are provided here: https://github.com/xqwen/fastenloc.
Next, we provide an overview of the fastENLOC analysis procedure. The overall procedure includes two interconnected steps: enrichment estimation and colocalization computation. The enrichment estimation aims to estimate the enrichment level of causal eQTLs in causal GWAS hits, or equivalently, the conditional prior probability that a SNP being a causal GWAS hit given its causal eQTL status. Because the true causal SNPs for both eQTL and GWAS are not observed, and the results from the association analysis carry a great deal of uncertainty due to LD, we adopt a multiple imputation (MI) approach to sample the true causal SNPs from different traits then average the enrichment estimates over multiple independent sets of imputed causal status. As a unique feature, fastENLOC implements a novel hierarchical sampling procedure based on the signal cluster information: It first draws a Bernoulli random variable based on the cumulative SNP-level posterior inclusion probabilities (PIPs) for a given signal cluster to determine if a cluster contains a causal variant; conditional on a positive outcome, the actual causal SNP is subsequently drawn from the member SNPs within the cluster. In comparison, the original ENLOC imputation procedure performs independent sampling based on SNP-level PIPs. This unstructured sampling procedure has some obvious caveats that are remedied in the new fastENLOC procedure. For example, the fastENLOC scheme ensures at most a single causal variant can be drawn from each signal cluster, whereas the ENLOC procedure does not enforce such desirable constraint. As a result of this new imputation procedure, we observe that the fastENLOC yields more accurate enrichment estimate and the sampling variance from the multiple imputation procedure is also lower than the original ENLOC.
In summary, the faster speed and the improved performance of fastENLOC are achieved with the following changes:
Pre-computation of posterior inclusion probabilities (fine-mapping) of eQTLs, which could be reused for any trait
Pre-computation of posterior inclusion probabilities (fine-mapping) of GWAS, which could be re-used for each of the 49 tissues
Faster calculation of enrichment parameters (α0,α1) by taking advantage of the pre-computed credible sets
Analytic update of the posterior probability of fine-mapping and colocalization using the posterior probability input from both GWAS and eQTL fine-mapping
A new computational implementation using C++
Structured sampling procedure based on the signal clustering
When a GWAS identifies few association signals, the enrichment estimate can be highly unstable, i.e., the point estimate is outside the normal range and the standard error is extremely large. In such cases, a desired outcome is to shrink the estimate to near 0. Through analyzing 4000+ traits with 49 GTEx tissues, we find the adaptive shrinkage procedure proposed in the ENLOC occasionally is insufficient to stabilize the point estimate. Thus, we implement a new shrinkage approach in fastENLOC to deal with these scenarios.
Briefly, we propose a normal prior, N(0,1/λ), for the enrichment parameter α1, and report its posterior mean for the downstream colocalization computation. Specifically,

Where  and s1 are estimates from the multiple imputation procedure. The shrinkage parameter λ, which can be customized by the users, quantifies the strength of the shrinkage: λ → 0 represents no shrinkage and λ → ∞ shrinks any estimate to exactly 0. By default, we find set λ = 1 achieves a good balance in practice, where we find the enrichment parameters are well stabilized with standard error ≤ 1.
Despite the new shrinkage scheme, the locus RCPs calculated by ENLOC and fastENLOC show good agreement (Supplementary Figure S4). This is likely because the instability of the enrichment estimates typically indicate a lack of colocalized signals. (On the contrary, the noteworthy colocalization probabilities are typically computed from those traits where enrichment parameters can be stably computed even with weak or no shrinkages.)
Given the enrichment parameters  , we derive the analytic formula to calculate the colocalization probability using the pre-computed posterior inclusion probabilities and the signal cluster information from fine-mapping results of GWAS and eQTL traits.
Let D, E denote the association data from GWAS and eQTL analyses, respectively. We consider a signal cluster inferred from the fine-mapping analysis of either eQTLs or GWAS and use latent binary indicator p-vectors d, γ to represent the causal association status of its p member single-nucleotide polymorphisms (SNPs) with the complex trait and the gene expression level of interest, respectively. (Recall that a signal cluster, by definition, contains a set of SNPs in LD and represents the same underlying genetic association signal.) Furthermore, we use γ0 to denote the configuration of no causal eQTLs in the cluster and γ1 to denote the ith SNP is the true causal eQTL SNP (i.e., the ith entry is set to 1 and 0 for the remaining SNPs).
Assuming GWAS data are originally analyzed using an exchangeable prior  , i.e.,
 and
and

By the nature of a signal cluster, it follows from the Bayes rule that
 where BFi denotes the marginal likelihood ratio,

Note that in case that the GWAS posterior probability is derived from a multi-SNP analysis, BFi may not be well-approximated by single SNP testing statistics. Nevertheless, given  and note that Pr(γi | D) coincides with the posterior inclusion probability (PIP) of the ith SNP in the signal cluster, BFi’s can be straightforwardly computed from Eq. (1). Additionally,
  can be obtained by averaging the PIPs from all interrogated SNPs.
Given the enrichment information, the GWAS prior differs for eQTL and non-eQTL SNPs. Specifically, for eQTL SNP,
 and for non-eQTL SNP,

Using the eQTL-informed priors, the GWAS posterior probability can be updated analytically, i.e.,

Subsequently, the colocalization probability at the ith SNP is computed by
 where we approximate Pr(γi | E, D) with the eQTL PIP for the ith SNP. The regional colocalization probability, RCP, for the signal cluster of interest is given by
 because events {γi, di} and {γj, dj} for i ≠ j are mutually exclusive within a signal cluster. The software and its source code are freely available at https://github.com/xqwen/fastenloc/.
Validation of PhenomeXcan using PheWAS Catalog, OMIM and Type 2 Diabetes reported genes
We evaluated the accuracy of gene-trait associations in PhenomeXcan by using two different gene-trait association datasets (PheWAS Catalog and OMIM) as well as genes linked with functional evidence with type 2 diabetes (T2D) according to the Accelerating Medicines Partnership T2D (AMP T2D). We then derived the receiver-operator (ROC) and precision-recall (PR) curves for PrediXcan and fastENLOC independently and a combination of both.
We mapped traits from PhenomeXcan to those in either PheWAS Catalog (28) or OMIM (30) by using the Human Phenotype Ontology (29) and the GWAS Catalog as intermediates. For traits in the PheWAS Catalog, we tested 2,202 gene-trait associations that could be mapped in both PhenomeXcan and the PheWAS Catalog, from a total 19,119 gene-traits associations consisting of all genes present in an LD block with GWAS signal. For the OMIM traits, we developed a standard (Supplementary Table S2) of 7,809 high-confidence gene-trait associations that could be used to measure the performance of PhenomeXcan, of which 125 presented in the LD block of GWAS signal so that were included in the analysis. This standard, as described in our recent work (24), was obtained from a curated set of trait-gene pairs from the OMIM database by mapping traits in PhenomeXcan to those in OMIM. Briefly, traits in PhenomeXcan were mapped to the closest phecode using the GWAS catalog-to-phecode map proposed in (Denny et al. 2013). As disease description in OMIM has been mapped to the Human Phenotype Ontology (HPO) (Kohler et al. 2019), we created a map from phecodes to terms in HPO, which allowed us to link our GWAS traits to OMIM disease description by utilizing phecodes and HPO terms as intermediate steps. For each gene-trait pair considered causal in this standard, we determined if PhenomeXcan identified that association as significant based on the resulting p-value. The OMIM-based standard is publicly available through R package https://github.com/hakyimlab/silver-standard-performance.
For T2D, we obtained a list of predicted effector transcripts identified by AMP T2D and use 76 genes categorized as “causal”, “strong” or “moderate” as our gold-standard for evaluation (Supplementary Table S3). As we did for OMIM and PheWAS Catalog, 20 of these “causal” genes could be mapped in PhenomeXcan, from a total of 5,036 genes present in an LD block with GWAS signal. We used seven traits highly related to T2D: ICD10 codes E11 and E14, “Self-reported type 2 diabetes” (data-field 20002 in UK Biobank with code 1223), and four phenotypes manually curated by the FinnGen Consortium (Type 2 diabetes without complications, Type 2 diabetes with ophthalmic complications, Type 2 diabetes, and Type 2 diabetes with peripheral circulatory complications); then we took the maximum Z-score obtained (for MultiXcan) and the maximum RCP (for fastENLOC) across the seven T2D traits for each gene evaluated. The results are shown in Figure 3 and Supplementary Figure S2. Notice that multiple testing is not an issue, since for the performance curves are not using a significance threshold but all levels are assessed in terms of the false positive and true positive rates.
Supporting evidence for PhenomeXcan results
PhenomeXcan results for case studies were included based on their p-values and locus RCP. We defined putative causal gene contributors as those genes with p-values less than 5.49 × 10⁻¹⁰ and locus RCP > 0.1. Given these conservative measures, however, we did discuss associations that were less significant or had a lower locus RCP with functional evidence. We used the NHGRI-EBI GWAS Catalog (10/21/2019) to identify GWAS results both using the UK Biobank (given the predominance of this dataset in PhenomeXcan) and other datasets. We performed systematic literature searches on PubMed using the gene name alone, with the specific trait category and trait name to identify functional studies relevant to a trait of interest.
Building PhenomeXcan x ClinVar
We examined links between 4,091 PhenomeXcan traits and 5,094 ClinVar traits and associated genes. ClinVar traits were excluded if they did not have known associated genes in PhenomeXcan. To compare a PhenomeXcan trait t and a ClinVar trait d, we calculated the mean squared Z-score:
 where k is the number of genes reported in ClinVar for trait d, and Z is the Z-score of gene i obtained with S-MultiXcan for trait t. We then created a matrix of PhenomeXcan traits by ClinVar traits with mean squared Z-scores. We defined significant associations between traits as those with Z-score > 6; this represents the equivalent of a Bonferroni-adjusted p-value of 0.05 based on our map of the distribution of Z-scores (Supplementary Figure S3).
Author Contributions
All authors discussed the results and interpretation, and commented on the manuscript. In addition to the latter activities, Milton Pividori: Performed the large scale computation and other analyses, drafted the manuscript and prepared figures and tables. Padma Sheila Rajagopal: Performed analyses, drafted the manuscript and prepared figures and tables. Yanyu Liang: Provided software and data for silver standard development and performance measurements. Alvaro Barbeira: Performed analysis, created database and web application for sharing of PhenomeXcan. Owen Melia: Supported database and web application development for PhenomeXcan. Lisa Bastarache: Assisted with construction of silver standard. YoSon Park: Edited the manuscript and provided insights. Xiaoquan Wen: Developed the theory and implemented fastENLOC in C++. Hae Kyung Im: Conceived PhenomeXcan, supervised the implementation and analysis, edited the manuscript.
Competing interests and declarations
HKI reports speaker honoria received from GlaxoSmithKline and AbbVie.
Data and materials availability
PhenomeXcan is publicly available at phenomexcan.org. The site contains the results of S-PrediXcan (individual tissues reported) and S-MultiXcan (across all tissues) applied to 4,091 traits and 22,515 genes. PhenomeXcan can be queried by gene (to result in traits) or trait (to result in genes). Multiple genes or traits can be queried at once. The result will list associations by p-value (from either S-PrediXcan if tissue-specific or S-MultiXcan as the best across tissues) and locus RCP from fastENLOC. We have also provided a queryable table of PhenomeXcan’s 4,091 traits x 5,094 ClinVar traits. Queries can be made by either PhenomeXcan trait or ClinVar trait, and the result will list associated traits, shared genes in the association and mean Z-score. The data sets used in this paper are publicly available in https://doi.org/10.5281/zenodo.3530669. Our Github for PhenomeXcan (https://github.com/hakyimlab/phenomexcan) contains the instructions to download summaries of the results, the complete set of raw results and code/scripts to reproduce all analyses and figures.
Acknowledgements
This research benefited from the use of credits from the National Institutes of Health (NIH) Cloud Credits Model Pilot, a component of the NIH Big Data to Knowledge (BD2K) program. This work was completed in part with computational resources provided by Bionimbus (61), and the Center for Research Informatics. The Center for Research Informatics is funded by the Biological Sciences Division at the University of Chicago with additional funding provided by the Institute for Translational Medicine, CTSA grant number UL1 TR000430 from the National Institutes of Health. Additional funding for this project was provided by the Small Grants program from the University of Chicago Biological Sciences Division (BSD) Office of Diversity and Inclusion and the BSD Career Advancement for Postdocs Travel Award. We thank Julian Solway for helpful discussion and feedback on the manuscript.
This work was supported by the Common Fund of the Office of the Director, U.S. National Institutes of Health, and by NCI, NHGRI, NHLBI, NIDA, NIMH, NIA, NIAID, and NINDS through NIH contracts HHSN261200800001E (Leidos Prime contract with NCI: A.M.S., D.E.T., N.V.R., J.A.M., L.S., M.E.B., L.Q., T.K., D.B., K.R., A.U.), 10XS170 (NDRI: W.F.L., J.A.T., G.K., A.M., S.S., R.H., G. Wa., M.J., M.Wa., L.E.B., C.J., J.W., B.R., M.Hu., K.M., L.A.S., H.M.G., M.Mo., L.K.B.), 10XS171 (Roswell Park Cancer Institute: B.A.F., M.T.M., E.K., B.M.G., K.D.R., J.B.), 10X172 (Science Care Inc.), 12ST1039 (IDOX), 10ST1035 (Van Andel Institute: S.D.J., D.C.R., D.R.V.), HHSN268201000029C (Broad Institute: F.A., G.G., K.G.A., A.V.S., X.Li., E.T., S.G., A.G., S.A., K.H.H., D.T.N., K.H., S.R.M., J.L.N.), 5U41HG009494 (F.A., G.G., K.G.A.), and through NIH grants R01 DA006227-17 (Univ. of Miami Brain Bank: D.C.M., D.A.D.), Supplement to University of Miami grant DA006227 (D.C.M., D.A.D.), R01 MH090941 (Univ. of Geneva), R01 MH090951 and R01 MH090937 (Univ. of Chicago), R01 MH090936 (Univ. of North Carolina–Chapel Hill), R01MH101814 (M.M-A., V.W., S.B.M., R.G., E.T.D., D.G-M., A.V.), U01HG007593 (S.B.M.), R01MH101822 (C.D.B.), U01HG007598 (M.O., B.E.S.), U01MH104393 (A.P.F.), as well as other funding sources: R01MH106842 (T.L., P.M., E.F., P.J.H.), R01HL142028 (T.L., Si.Ka., P.J.H.), R01GM122924 (T.L., S.E.C.), R01MH107666 (H.K.I.), P30DK020595 (H.K.I.), UM1HG008901 (T.L.), R01GM124486 (T.L.), R01HG010067 (Y.Pa.), R01HG002585 (G.Wa., M.St.), Gordon and Betty Moore Foundation GBMF 4559 (G.Wa., M.St.), 1K99HG009916-01 (S.E.C.), R01HG006855 (Se.Ka., R.E.H.), BIO2015-70777-P, Ministerio de Economia y Competitividad and FEDER funds (M.M-A., V.W., R.G., D.G-M.), la Caixa Foundation ID 100010434 under agreement LCF/BQ/SO15/52260001 (D.G-M.), NIH CTSA grant UL1TR002550-01 (P.M.), Marie-Sklodowska Curie fellowship H2020 Grant 706636 (S.K-H.), R35HG010718 (E.R.G.), FPU15/03635, Ministerio de Educación, Cultura y Deporte (M.M-A.), R01MH109905, 1R01HG010480 (A.Ba.), Searle Scholar Program (A.Ba.), R01HG008150 (S.B.M.), 5T32HG000044-22, NHGRI Institutional Training Grant in Genome Science (N.R.G.), EU IMI program (UE7-DIRECT-115317-1) (E.T.D., A.V.), FNS funded project RNA1 (31003A_149984) (E.T.D., A.V.), DK110919 (F.H.), F32HG009987 (F.H.), Massachusetts Lions Eye Research Fund Grant (A.R.H.).
Footnotes
Text has been revised and new fastENLOC results are presented.


