

ABSTRACT
Toxic concentrations of aluminium cations and low phosphorus availability are the main yield-limiting factors in acidic soils, which represent half of the potentially available arable land. Brachiaria grasses, which are commonly sown as a forage in the tropics because of their resilience and low demand for nutrients, have a greater tolerance to high concentrations of aluminium cations than most other grass crops. In this work, we explored the natural variation in tolerance to aluminium cations between high and low tolerant Brachiaria species and characterised their transcriptional differences during stress. We also identified three QTLs associated with root vigour during aluminium cation stress in their hybrid progeny. By integrating these results with a new Brachiaria reference genome, we have identified genes associated with aluminium cation tolerance in Brachiaria. We observed differential expression of response signalling, cell wall composition and vesicle transport genes homologous to aluminium-induced proteins involved in limiting uptake or localizing toxic agents. However, there was limited regulation of malate transporters, which are detected during Al3+ stress in other grasses. Contrasting regulation during Al3+ stress of numerous genes involved in RNA translation suggests variations in response timing may be associated with the differences in tolerance to aluminium cations among Brachiaria species.
INTRODUCTION
Acidic soils constitute circa 30 % of the world’s total land area and 50 % of the potentially available arable land (Von Uexküll and Mutert 1995). Acidic soils are particularly predominant in two regions in the world, a northern “temperate belt” and a southern “subtropical belt” (Hede, Skovmand, and Lopez Cesati 2001). Therefore, a broad range of vegetable, cereal and forage crops can be yield-limited in these conditions. While low soil pH per se can have an inhibitory effect on plant growth for non-adapted species, the adverse effects of soil acidity are mostly associated with several mineral toxicities and deficiencies, particularly increased concentrations of soluble forms of manganese, iron and aluminium, and reduced levels of available forms of phosphorus, calcium, magnesium and potassium. Among these, lower phosphorus solubility and aluminium toxicity are considered the main limiting factors on productivity (Eswaran, Reich, and Beinroth 1997). As soil pH decreases below 5, aluminium becomes soluble as the aluminium trivalent cation (Al3+), a form highly toxic to plants. Soluble Al3+ effect on root apices results in diminished ion and water uptake.
Although acid soils can be conditioned for improved agricultural use through the addition of lime (quicklime, calcium oxide or slag, calcium silicate, etc.), this agronomic practice is undesirable due to the broader implications for other fauna, flora and the soil microbial populations and, in general, the best long-term strategy is a combination of agronomic practices and growing tolerant cultivars. Natural variation in aluminium tolerance has been identified for a number of crops with rice being the most aluminium-tolerant among the food staples (Rao et al. 2016). However, all Brachiaria species show greater tolerance to Al3+toxicity than most other grass crops, including maize, rice or wheat (Kochian et al. 2015).
Brachiaria (Trin.) Griseb. (syn. Urochloa P.Beauv.) grasses are native to East Africa and are widely sown as a forage to feed ruminants across the tropics, particularly in areas with marginal soils. Brachiaria has a set of desirable genetic characteristics linked to drought and waterlogging tolerance, poor and acidic soils tolerance, and resistance to major diseases. However, Brachiaria resilience is principally a result of low demand for soil nutrients (Pizarro et al. 2013; Worthington and Miles 2015). As a consequence, toxic cation levels (and not reduced levels of mineral solutes) are the limiting factors on Brachiaria species productivity in acidic soil conditions.
Al3+ tolerance has been established to be a multigenic trait, though major genes can also be important (Ryan et al. 2009; Kochian et al. 2015). The incomplete transfer of tolerance from parents to near-isogenic lines in sorghum (Melo et al. 2013), maize (Guimaraes et al. 2014), and wheat (Johnson, Carver, and Baligar 1997; Tang et al. 2002) supports polygenic inheritance of Al3+ tolerance. While a single locus in barley (Alp) confers significant tolerance to Al3+ in the elite material (Minella and Sorrells 1992), different loci appear to play an essential role in Asian landraces (Caniato et al. 2007).
Al3+ tolerance mechanisms are classified as external and internal tolerance mechanisms (Furlan et al. 2018; Kochian et al. 2015). In the first group, plants prevent Al3+ uptake by raising the pH in the rhizosphere by H+ influx or forming binding complexes by exudation of citrate, malate and oxalate. In the second group, Al3+ is absorbed and localized to cell organelles or the apoplast. In tolerant rice variety Nipponbare, both exclusion mechanisms and internal detoxification are important in withstanding toxicity, while primarily internal detoxification occurs in sensitive rice variety Modan (Roselló et al. 2015).
Little is known about the genetic basis of the Al3+ tolerance in Brachiaria. Nevertheless, screening experiments have evidenced different but consistent aluminium tolerance among Brachiaria species and cultivars, which indicates the genetic basis of the trait (Arroyave et al. 2013). The three most important commercial species, Brachiaria brizantha (A.Rich.) Stapf., B. decumbens Stapf., and B. humidicola (Rendle) Schweick exist primarily as apomicts with varying levels of polyploidy (Valle and Savidan 1996). The sexual species B. ruziziensis (Germ.&C.M.Evrard) is also used in breeding. B. decumbens is significantly more tolerant to Al3+ than B. ruziziensis (Arroyave et al. 2011; Bitencourt et al. 2011).
Brachiaria is one of the most widely used and promising forages in the American and African tropics and for the potential of this species to be realised, it is important that varieties are tailored to the particular demands of each environment in which it is grown (Bailey-Serres et al. 2019). One of the tools available for identifying locally adapted variation is molecular characterisation. However, underpinning genomic resources are costly to produce and so often limited for ‘orphan’ crop species such as Brachiaria. To this end, the work presented here has focused on developing a) genomic resources for Brachiaria and b) the application of these in developing a better understanding of the molecular basis of a key trait affecting Brachiaria productivity, namely Al3+ tolerance.
METHODS
Plant materials and phenotyping
The mapping population used in this work consisted of 169 genotypes of F1 progeny from a cross between the autopolyploid BRX 44-02 (B. ruziziensis) and the segmental allopolyploid CIAT 606 (B. decumbens). This population was generated initially to identify markers linked to apomixis (Worthington et al. 2016). Accessions were phenotyped at CIAT in Cali, Colombia, and consisted of six cycles where plants were grown for 20 days in hydroponic solutions with 0 and 200 μM AlCl3. Measurements of cumulative root length (RL), root biomass (RB), and root tip diameter (RD) were taken at the end of each cycle and transformed to meet the assumption of normality; RL and RB were square-root transformed and RD was natural log-transformed. The PROC MIXED method in SAS was used to fit a mixed effect model. Genotypic BLUPs were calculated from stress and control measurements individually, back transformed BLUP in the natural scale were obtained by dividing stress and control values for each trait.
Genome sequencing, assembly and annotation
B. ruziziensis genotype 26162 (2n = 2x = 18) was the source of genomic DNA. Two paired-end libraries were created and sequenced in Illumina HiSeq 2500 machines in rapid run mode by the Earlham Institute (approx. 70X) and the Yale Center for Genome Analysis (approx. 30X) following the manufacturer’s protocol. Additionally, a Nextera mate-pair (MP) library with insert length 7 Kb was sequenced to improve the scaffolding. Read quality was assessed, and contaminants and adaptors removed. Illumina Nextera MP reads were required to include a fragment of the adaptor to be used in the following steps (Leggett, Clavijo, et al. 2013). The pair-end shotgun libraries were assembled and later scaffolded using the mate-pairs library using Platanus v1.2.117, which is optimized for heterozygous genomes (Kajitani et al. 2014). We did not use Platanus’ gap-closing step. Approximately 1 million Pacbio reads from this same genotype were generated in a PacBio RSII sequencer, and used for gap filling using PBJelly v.15.8.24 (English et al. 2012). Scaffolds shorter than 1 Kbp were filtered out. We used 31mer spectra analysis to compare the assemblies produced by different pipelines, as well as our final assembly with the intermediary assemblies from preceding steps. A K-mer spectrum is a representation of how many fixed-length words or K-mers (y-axis) appear a certain number of times or coverage (x-axis). The K-mer counting was performed with KAT (Mapleson et al. 2016). The completeness of the assembly was checked with BUSCO (Simão et al. 2015).
Repetitive and low complexity regions of the scaffolds were masked using RepeatMasker (Tarailo-Graovac and Chen 2009) based on self-alignments and homology with the RepBase public database and specific databases built with RepeatModeler (Smit and Hubley 2008). LTR retrotransposons were detected by LTRharvest (Ellinghaus, Kurtz, and Willhoeft 2008) and classified with RepeatClassifier. The 5’ and 3’ ends of each LTR were aligned to each other with MUSCLE (Edgar 2004) and used to calculate the nucleotide divergence rate with the Kimura-2 parameter using MEGA6 (Tamura et al. 2013). The insertion time was estimated by assuming an average substitution rate of 1.3□×□10-8(Schmutz et al. 2014)
Our annotation pipeline (De Vega et al. 2015) uses four sources of evidence. (a) De novo and genome-guided ab initio transcripts deduced from RNA-Seq reads from the B. ruziziensis genotype assembled with Trinity (Grabherr et al. 2011) and Tophat and Cufflinks (Trapnell et al. 2012), (b) gene models predicted by Augustus (Stanke et al. 2006), (c) homology-based alignments of transcripts and proteins from four close species with Exonerate and GMAP (Wu et al. 2016), and (d) the repeats annotation. Finally, MIKADO (Venturini et al. 2018) built the gene models to be compatible with this previous information. Proteins were compared with the NCBI non-redundant proteins and EBI’s InterPro databases and the results were imported into Blast2GO (Conesa et al. 2005) to annotate the GO and GO slim terms, enzymatic protein codes and KEGG pathways. Proteins were also functionally annotated with the GO terms of any significant orthologous protein in the eggNOG database (Powell et al. 2014), using the eggNOG-mapper pipeline (Huerta-Cepas et al. 2017).
Population genotyping and genetic map construction
Genotyping-by-sequencing libraries were prepared and sequenced for the 169 F1 progenies and the two parents as described in Worthington et al 2016. Reads were demultiplexed according to the forward and reverse barcodes used during library preparation with FastGBS (Torkamaneh et al. 2017) and adaptors and enzymatic motifs removed with Cutadapt (Martin 2011). Reads were aligned to the genome using BWA MEM (Li 2013). SNP calling was done for each sample with GATK’s Haplotycaller (Van der Auwera et al. 2013) without the duplicated read filter (-drf DuplicateRead) and recalled for the population with GATK’s GenotypeGVCFs, in both tools with “--ploidy 4”. We changed to missing call any homozygous SNP supported by less than 12 reads, and any SNP supported by less than three reads. We removed any site not called in a progenitor or more than 20 % of the progeny. Markers that were heterozygous in only one parent and had a segregation ratio of a heterozygote to homozygote progeny of approximately 2:1 (between 0.5 and 1.75) were classified as single-dose allele (SDA) markers and used in the linkage map construction. Separated genetic linkage maps of BRX 44-02 and CIAT 606 were constructed in JoinMap v5; downstream QTL analysis used the B. ruziziensis BRX 44-02 map.
RNA-seq sequencing and analysis
The tolerance experiment in the greenhouse was fully replicated once. RNA extraction from each root and leaf sample was performed with RNeasy Plant Mini kit (Qiagen, CA, USA) and sent to the sequencing service provider where Illumina RNA-seq libraries were prepared and sequenced using the HiSeq 2500 platform. Sixteen libraries were independently generated and sequenced (two tissues, from two species, in two conditions, in two replicates). Contaminations in the raw data were discarded with Kontaminant (Leggett, Ramirez-Gonzalez, et al. 2013) against a database of common virus, bacteria and fungi. Adaptors were removed with Cutadapt (Martin 2011) and quality checked with FastQC (Andrews 2017). Reads were mapped to the genome using STAR (Dobin et al. 2013) and the gene models annotation for guidance. Counts were estimated with Stringtie (Pertea et al. 2015). We used DEseq v2 (Love, Huber, and Anders 2014) for analysing differential expression,which takes as input a matrix of read counts mapped to each gene. Enriched GO terms and other categories in each group of differentially expressed genes were identified in R using TOPGO (Alexa and Rahnenfuhrer 2010) using a Fisher’s test (FDR<0.05) and the “weight01” algorithm. The relation among GO terms was plotted in R using ggplot (Wickham and Chang 2008).
Comparative genomics
Syntenic blocks between B. ruziziensis and S. italica whole genomes were identified with Minimap (Li 2016), and plotted with D-GENIES (Cabanettes and Klopp 2018). Previously, we had filtered out any scaffolds shorter than 10Kbp that did not contain any gene. The assembly was anchored in S. italica by assigning each scaffold to the chromosome position where it had the longest alignment chain after combining proximal alignments. For clustering, proteins from five related species were assigned to eggNOG orthologous groups as before. A phylogenetic tree based on these data was built with MUSCLE, as before, by aligning the orthologous proteins from two species at a time, filtering sets with 1:1 ratios and, finally, estimating the nucleotide divergence rate using MEGA v6, as before.
RESULTS
Root morphology in Brachiaria species in different aluminium cation concentrations
We demonstrated the superior Al3+ tolerance of B. decumbens accession CIAT 606 compared with B. ruziziensis accession BRX 44-02 (Fig. 1). The root morphology in the B. decumbens accession was less affected than in the B. ruziziensis accessions after growing for 20 days in control and high (200 μM) Al3+ concentration hydroponic solutions. Under stress conditions, the roots of B. decumbens were over three times as long and had twice the biomass of B. ruziziensis. However, the root top diameter increased in stress conditions in a similar ratio in both species (Suppl. Table 1).

Root growth in B. decumbens accession CIAT606 and B. ruziziensis accession BRX4404 after growing for 20 days in control and high 200 μM Al3+ concentration hydroponic solutions.
A population of 169 interspecific tetraploid progeny was obtained by crossing aluminium-tolerant B. decumbens accession CIAT 606 and aluminium-sensitive B. ruziziensis accession BRX 44-02. The interspecific progeny showed variation in cumulative root length (RL), root biomass (RB), and root tip diameter (RD) (Fig 2; Suppl. File 1). We obtained highly significant (p < 0.001) genotypic differences in stress/control, control and stress conditions for the three traits (RL, RB and RD).

Root length (RL), root biomass (RB), and root tip diameter (RD) ratios between Al3+ stress and control measured values (stress/control) in the interspecific progeny between B. ruziziensis and B. decumbens (n=169).
Assembly and annotation of a Brachiaria reference genome
We selected the B. ruziziensis genotype CIAT 26162 (2n = 2x = 18) as the source of genomic DNA. This is a semi-erect diploid accession from Burundi (−3.1167, 30.1333) that was chromosome-doubled with colchicine to produce the autotetraploid B. ruziziensis BRX 44-02, one of the progenitors of the interspecific mapping population analysed. The ploidy of CIAT 26162 has recently been verified by cytogenetics (P. Tomaszewska, personal comm.). A whole-genome was assembled (WGS) using Platanus v.1.2.4 (Kajitani et al. 2014), from Illumina paired-end and Nextera mate-pair reads with a coverage of approximately 100X and 7X, respectively (Suppl. Table 2). Platanus outperformed the contiguity results obtained with other pipelines. Although the combination of ABySS for the contigs assembly and SOAP2 for the scaffolding resulted in a larger assembly, a kmer frequency analysis (Mapleson et al. 2016) evidenced that the additional content was repeated under collapsed heterozygosity that Platanus had purged (Suppl. Fig. 1). The assembly was followed by a gap-filling step using approximately 1 million Pacbio reads with an average length of 4.8 Kbp, which resulted in a reduced percentage of ambiguous nucleotides (Ns) from 17.45 % to 11.39 %. We finally discarded all the sequences under 1 Kbp to produce the reference genome we used for the downstream analysis (Table 1). To assess the completeness of the assembly, we verified that 1,345 (93.4 %) of the 1,440 BUSCO orthologous genes (Simão et al. 2015) were present in the assembly; 1,216 of which were completed and in a single copy, 32 were duplicated, and 97 were fragmented. This WGS assembly is deposited in SRA with the accession number GCA_003016355. The raw reads are deposited in the Bioproject PRJNA437375.
Statistics associated with the assembly of the Brachiaria ruziziensis reference genome and anchored in pseudo-molecules..
Brachiaria genes differentially expressed during Al3+ stress, homologous to Al-induced proteins or related Gene Ontology (GO) terms.
The repeat content (Suppl. Table 3) was 51 % of the total genome (656,355,643 bp, after excluding Ns), which is close to the 46 % repeat content in Setaria italica (L.) P. Beauv (foxtail millet) (Zhang et al. 2012). We found a large number of Gypsy and Copia long terminal repeats (LTRs), which represent 24 % and 9.5 % of the total genome excluding Ns. These transposons and proportions are also very similar to those observed in foxtail millet. We compared the divergence between the flanking tails in the LTRs (Suppl. Fig. 2) and identified a single very recent burst of LTR Gypsy activity around 0.6 MYA (Kimura = 0.042 ± 0.026) and of LTR Copia also around 0.6 MYA (Kimura = 0.041 ± 0.027). Other repeat elements, including LINEs (Long Interspersed Nuclear Elements), simple repeat patterns of the sequence, satellites, and transposons were much less common, except for En/Spm DNA transposons observed in 4.2 % of the genome.
We annotated 42,232 coding genes, which included 42,359 predictive open reading frames (ORFs), as well as 875 non-coding genes without a predicted ORF (Suppl. file 2). Together these transcripts and non-coding genes define 43,234 targets for the expression analysis. 35,982 of the coding transcripts had a homologous protein in the NCBI non-redundant (nr) database. In 58% of the cases, the top hit was a S. italica sequence (Suppl. Fig. 3). Among those 35,982, 33,963 were functionally annotated with at least one GO term, and 39,488 had an InterPro annotation. We also identified the best reciprocal hit with A. thaliana, rice, P. halli, S. italica and S. viridis; and the top homologous in Uniprot (Suppl. File 3).
Comparative genomics with related grasses
Firstly, we aligned the transcripts and proteins from five sequenced species in the same clade, S. italica, S. viridis (L.) Beauv. (green foxtail), Zea mays L. (maize), Panicum halli Vasey and P. virgatum L. (switchgrass); and found that on average 78 % and 72 % of the transcripts and proteins aligned with an identity over 0.7, respectively (Suppl. Table 4).
We could assign 35,831 Brachiaria proteins to an eggNOG orthologous group (Powell et al. 2014), and 13,570 proteins could be further annotated with GO terms from the eggNOG database. We also assigned the proteins from other species in the Poaceae family to these eggNOG orthologous groups in order to identify shared clusters of proteins among these species. 24,752 of the total 26,354 clusters of proteins defined for Poaceae (poaVIR) in the eggNOG database could be found in at least one of the studied species, around 70 % common to the tribe Paniceae that includes Setaria and Panicum species, and around 60 % to all these five species in the subfamily Panicoideae (Suppl. File 4; Suppl. Fig. 4). More than 70% of the clusters of proteins had double or triple the number of proteins than other species because of relatively recent whole-genome duplication events. Around 85 % of the cluster in S. italica, S. viridis or P. halli contained only one protein from these species (Suppl. Table 5). The proportion is lower in B. ruziziensis and Z. mays and 20 % of the clusters had two proteins in both species. From this analysis, we also estimated that there are approximately two thousand proteins in other close species that are missed in our Brachiaria assembly.
We estimated the divergence between these species based on the Kimura divergence values between orthologous proteins in 6,450 clusters of proteins with one member from each species (P. virgatum was excluded from this analysis). The average Kimura divergence value for pairs of coding sequences of B. ruziziensis with S. italica was 0.094 ± 0.007, with Panicum hallii was 0.102 ± 0.007, with S. viridis was 0.095 ± 0.006, and with maize was 0.163 ± 0.008 (Suppl. Fig. 5). By assuming an average substitution rate of two-times (diploid) 1.3□×□10-8 (Schmutz et al. 2014), we estimated that Brachiaria diverged from the other Paniceae, Setaria and Panicum, around 13.4-15.5 million years ago (MYA), while the split of the Paniceae clades took place around 23.8-26.3 MYA (Suppl. Fig. 6).
The 23,076 scaffolds in the WGS longer than 10 Kbp or with at least one annotated gene (533.9 Mbp) were aligned in S. italica nine chromosomes, the closest relative with a high quality sequenced genome (Zhang et al. 2012). Up to 21,145 of the 23,076 scaffolds (91.6 %), which comprise 525.1 Mbp could be aligned (Fig 3; Suppl. file 5). Furthermore, this allowed us to assign chromosomal positions to 41,830 coding genes (41,974 transcripts) contained in these anchored sequences (Suppl. File 6). We identified 59 synteny blocks, 36 of which were longer than 1 Mbp in both species (Fig 3). There were three large translocations when comparing the S. italica and B. ruziziensis genomes between chromosomes 1 and 7, 2 and 6, as well as 3 and 5. And four inversions (smaller than the translocations) between tails in chromosomes 1 and 4 (both ends), 2 and 9 (proximal end), and 2 and 3 (proximal end).

Synteny between the Brachiaria ruziziensis and Setaria italica genomes. The 36 synteny blocks longer than 1 Mbp and the translocation are highlighted in red or green boxes according to their direction.
QTL mapping in the interspecific B. ruziziensis X B. decumbens population
Between 78.8 and 91.5 % of the Genotyping-by-sequencing (GBS) reads from the 169 interspecific progeny and the progenitors’ samples could be aligned in the assembly. After filtering, there was an average of 81,831 SNPs and 15,595 indels sites per sample. In total, 799,155 sites were called in the population. These sites were 85.7 % SNPs, 6.3 % insertions, 7.2 % deletions, 0.3 % mixed (a combination of SNPs and indels), and 0.5 % complex (expanding more than one bp). In agreement with filtering criteria previously tested in tetraploid Brachiaria samples (Worthington et al. 2016), we used SNPs only, and required at least 12 reads to call a homozygous site in any sample, a minimum allele frequency of 5 % and calls missing in less than 20 % of the samples. After filtering, 15,074 SNP sites were homozygous in the B. ruziziensis progenitor and heterozygous in the B. decumbens progenitor (nnxnp; Joinmap segregation descriptor, see Methods), 4,891 sites heterozygous in the B. ruziziensis progenitor and homozygous in the B. decumbens progenitor (lmxll), and 1,652 were heterozygous in both progenitors (hkxhk). We classified 4,817 nnxnp and 1,252 lmxll sites as single dose alleles (SDAs, or “simplex”) based on their heterozygous/homozygous segregation ratio and used them as markers in the genetic map construction. The final genetic map included 4,427 markers placed at LOD 10 in 18 linkage groups (Suppl. Fig. 7, Suppl. File 7), which corresponds with the number of chromosomes expected in a tetraploid Brachiaria population such as this one. Linkage groups had an average length of 74.7 ± 22.7 cM. Based on the position of each SNP site in the genome, two linkage groups, relating to two homoelogous chromosomes, matched to each assembled chromosome (pseudomolecule), which were numbered following the order in S. italica (Suppl. Table 6). We also aligned the scaffolds in the genetic map to compare the co-linearity between the position of each marker in the genetic map and genome assembly (Suppl. Fig. 8).
As stated above, RL, RB and RD were scored in the interspecific population in control and Al3+ stress conditions. We also calculated the ratio between both conditions. 371 markers had marker/trait association LODs over 3, 273 markers in LG1, 73 markers in LG4, 51 markers in LG3, and 12, two and one in LGs 13, 10 and 5. 212 WGS scaffolds contained at least one marker with LOD over 3 (Suppl. File 7).
To identify well supported QTL, we focused on peaks with several consecutive significant markers based on a rolling average (window 3) LOD score over 4 (Fig. 4; Suppl. Fig. 9). This identified three QTLs each in LG 1 (Chr 8) for root length and biomass, LG 3 (Chr 7) for root length, and LG 4 (Chr 3) for root diameter. QTLs explained from 12.8 % to 16.1% of the phenotypic variance (Suppl. File 7). In a previous publication (Worthington et al. 2016), this population was phenotyped for reproductive mode (apomictic or sexual) using differential interference contrast (DIC) microscopy and the QTL mapped into Chromosome 1. Indeed, the apomictic locus (APO) was found again in LG7 (Chr 1), as previously reported (Worthington et al. 2019).

4,427 genetic markers placed in 18 linkage groups. We defined three QTLs each in LG 1 (Chr 8) for root length and biomass, LG 3 (Chr 7) for root length, and LG 4 (Chr 3) for root diameter. As a control, the apomictic locus was identified from reproductive mode phenotyping.
The peaks with the highest LOD values were observed in LG1 (Chr 8). A closer look evidenced several consecutive peaks in this QTL supported by both root length and biomass phenotypes. QTLs in the proximal region of the chromosome peaked at 7 cM (LOD 4.73) and 14.3 cM (LOD 4.95). An additional larger QTL is specific to control conditions peaked three times around 20.2-23.4, 25.7-26.2 and 27.6-28.8 cM, with the highest values at 26 cM for root length (LOD 5.8) and at 25.8 cM for root biomass (LOD 5.25). The QTL on LG 4 (Chr 3) peaked around 57.4-59 cM (LOD 4.3). The QTL in LG3 (Chr 7) showed two peaks at 96.8 cM for root length (LOD 4.75) and 79.7 cM for root diameter (LOD 4.02).
QTL regions contained 839 differentially expressed (DE) genes, of which 87 were differentially expressed (DE) (Suppl. file 8). Among the 87 differentially expressed genes in the QTL regions, 39 were in QTL in LG1, 17 were in the QTL in LG3, and 31 were in QTL in LG4. A total of 35 of the 87 genes were annotated as components of membrane, 18 were annotated as involved in response regulation, and 37 as binding to different molecular compounds, including ATP/ADP/GTP (12) and metal ions (9) and DNA (8). Only 12 of the 87 genes were not annotated with at least one of these previous GO terms. However, 17 of the 87 genes were uncharacterised proteins and not annotated with GO terms. All but six of these 17 had homologous proteins in the related grass species. All three QTL regions contained genes annotated in all the previous GO terms in approximately equal proportions.
Transcriptional differences during stress between Brachiaria species
We performed RNA-seq from stem and root tissue samples extracted from the B. decumbens and B. ruziziensis progenitors after growing for three days in control or high (200 μM AlCl3) aluminium cation concentration hydroponic solutions. We also incorporated a reference-based reanalysis of public RNA-seq data (PRJNA314352) of the aluminium-resistant B. decumbens var. Basilisks roots (referred to as “Basilisks” in this paper, while B. decumbens always refers to cultivar CIAT 606) screened using the same experimental conditions and treatments as employed by us (Salgado et al. 2017).
When the normalised counts for all the genes were used to cluster the samples, these clusters firstly grouped by tissue, secondly by genotype, and thirdly by treatment (Suppl. Fig. 10). As a consequence, the following results comparing control against stress treatment are presented according to species and tissue. There were 5,421 DE genes in total, with most of these differentially regulated in a single genotype and tissue (Suppl. Fig. 11). Among these, 5102 were DE in roots only, 249 in stems only, and 70 in both tissues. Up to 116 of the DE genes were non-coding (without a clear ORF).
4,423 of the 5,102 genes DE in roots were specific to one of the species (Fig. 5). We obtained twice as many DE genes in B. ruziziensis as in the other two species. The proportion of DE genes specific to only one species was maintained when considering up- and down-regulated genes separately. The most substantial overlaps between gene sets were between B. ruziziensis and B. decumbens, with 178 genes up-regulated and 154 gene down-regulated in both. f86 genes were up-regulated genes in both B. decumbens cv. CIAT 606 and cv. Basilisks, and 67 genes were up-regulated in Basilisks but down-regulated in B. ruziziensis.
Enrichment analysis of the GO terms over-represented among DE genes in each species allowed us to identify the biological processes (BP) and molecular functions (MF) that are similarly or differently regulated among them (Suppl. File 9 and 10). After annotating the genes with the full set of GO terms as described previously, we simplified the results to “GO slim” terms for this analysis. “GO slim” contains the subset of higher-level terms from the GO resource (Fig. 6, sorted left to right from high to low tolerance to Al3+ toxic levels; Statistical analysis in Suppl. Table 7).
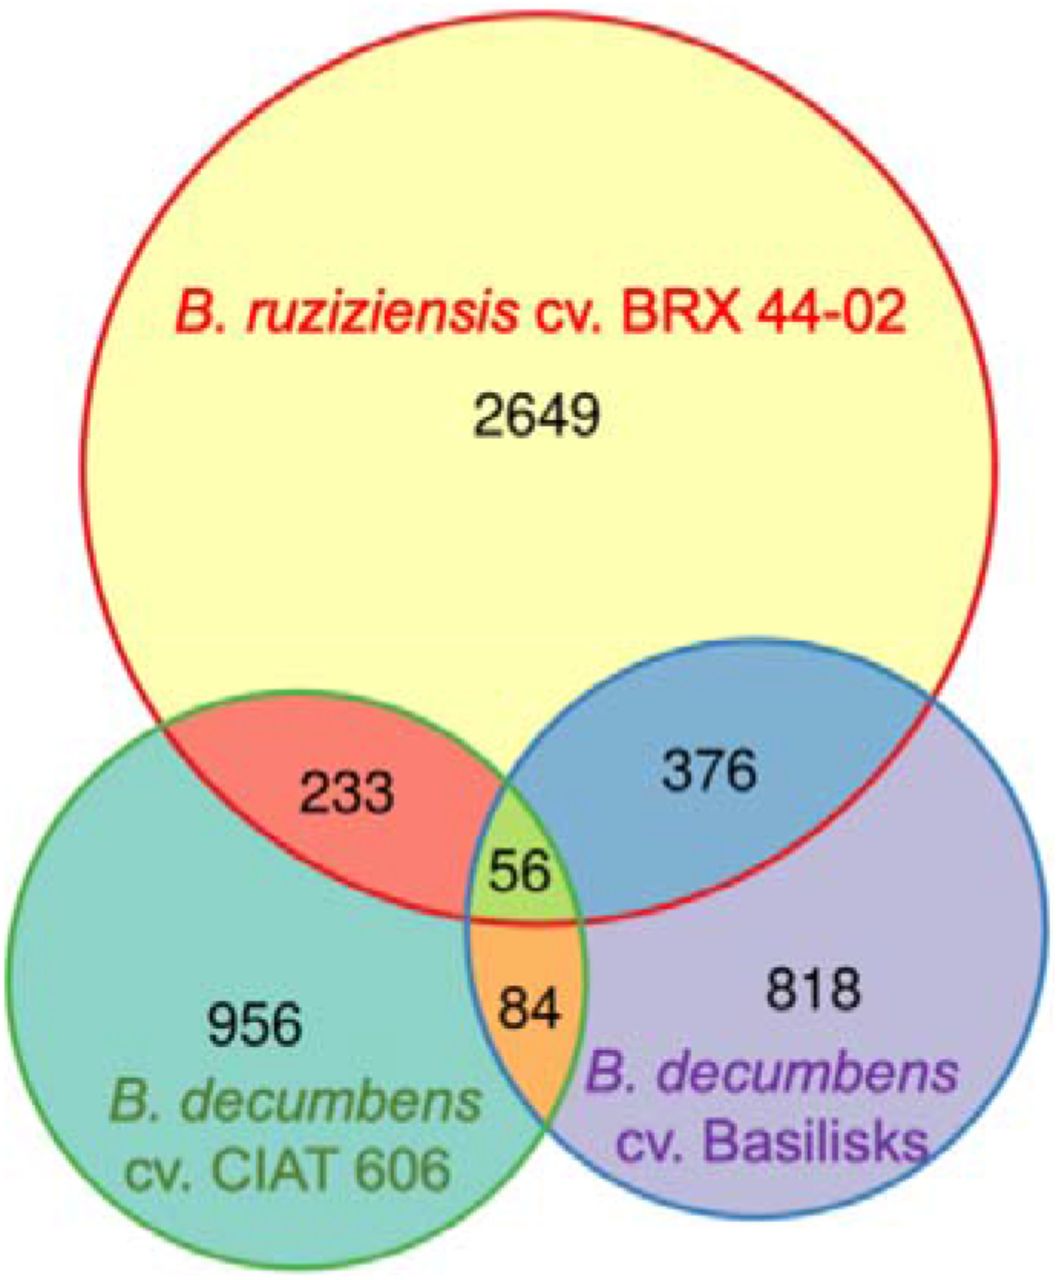
Differentially expressed (DE) genes in roots from the three accessions with different levels of tolerance to high (200 μM AlCl3) aluminium cation concentrations.

Each bubble represents an overrepresented GO slim terms, in red if it is overrepresented among DE upregulated genes or in blue if among downregulated ones. The size is proportional to the number of DE genes that support that enrichment. The intensity of colour is proportional to the Pval of the enrichment test (Fisher test). Brachiaria species are sorted left to right from high to low aluminium-tolerance: Basi (B. decumbens cv. Basilisks), Bdec (B. decumbens cv. CIAT 606, Bruz (B. ruziziensis cv. BRX 44-02).
There was little overlap among GO terms based on the DE genes included in each annotation, as represented in a correlation matrix plot (Suppl. Fig. 12). The exception is the overlap between five MF terms related to RNA/mRNA/rRNA binding with the ribosome (MF:3723, 3729, 19843; and 3735 and 5198) among themselves and with two BP terms, namely “translation” and “ribonucleoprotein complex assembly” (BP: 6412, 22618). All these terms were significantly enriched among down-regulated genes in B. ruziziensis and B. decumbens, but were not enriched in Basilisks. The number of genes was much larger in B. ruziziensis (146 genes) than B. decumbens or Basilisks (39 and 16 genes, respectively). Most of these genes were annotated as ribosomal RPS/RPL proteins.
Despite little overlap among gene sets, the number of enriched GO terms was similar between different species. The exception to this observation wass “ion binding” and the translation-related GO terms in B. ruziziensis.
Genes annotated as “transmembrane transporters” (MF:22857) were highly over-represented (Fisher’s test values in Suppl. Table 7) among up-regulated DE genes in all three species (57 in Basilisks, 44 in B. decumbens and 70 in B. ruziziensis). This annotation was also highly represented among down-regulated DE genes in Basilisks (16 genes). However, only two were common to the three species, a MST3 sugar transporter (Gene 1766G4) and 8448G4, a STAR1/ALS1 aluminium-induced transmembrane ABC transporter (Huang et al. 2009). While most of these genes were DE in only one of the species (only 21 were shared between any two species), they appear to cover similar roles in all three species as “ABC transporters”, “P-type ATPases” and “Amino acid transporters”. As commented before, there was a minimal overlap between this GO term (MF:22857) and the “transmembrane transport” BP term (BP:55085), which was only enriched in Basilisks and includes a small number of proteins (seven in Basilisk and B. ruziziensis, and three in B.decumbens). Most of these proteins were annotated as mitochondrial transporters, but three of the 7 Basilisks-specific DE genes were annotated as tonoplast and vacuolar transporters induced by abiotic stress and involved in functions “critical for pH homeostasis” (Genes 211G30, 211G34 and 751G28).
Four functions were regulated in B. ruziziensis differently than in the other species (Fig. 6), “cell wall organization and biogenesis” (BP:71554), transport (BP:6810), ion binding (MF:43167) and glycosyl hydrolase activity (MF:16757). The “biosynthetic process” term (BP:9058) was enriched in both down-regulated and up-regulated DE genes in B. ruziziensis (Suppl. Fig. 13).
“Cell wall organization and biogenesis” included 51 down-regulated DE genes in B. ruziziensis, while included only 14/17 up-regulated DE genes in the other species. Most of these in either species were peroxidases PER and expansin proteins induced by various plant hormones (ethylene, GA, auxin, etc.) and involved in toxic removal during oxidative stress (Kochian et al. 2015).
“Transport” was enriched among up-regulated genes in B. decumbens and down-regulated genes in B. ruziziensis, and not enriched in Basilisks. It included 83, 35 and 12 DE genes in B. ruziziensis, B. decumbens and Basilisks, respectively. In all species, these proteins were localizing different substances (phosphate, sodium, mRNA, etc.) to various cell organelles. Only two genes were common to B. ruziziensis and B. decumbens and so regulated in opposite ways: a manganese metal-binding intracellular transporter involved in root development (7811G2) and a GTP-binding protein involved in nucleocytoplasmic transport (14972G2). Up-regulated genes in B. decumbens were also up-regulated in B. ruziziensis, but with lower values of fold-change expressions. Exceptionally, six of the 35 exhibited high fold-changes in both species. These highlighted DE genes were involved in phospholipids, phosphate, magnesium, auxin, nitrate and miRNA transport in the cell (Genes 6944G2, 12087G2, 8068G4, 26018G2, 4534G2, 2708G4).
“Ion binding” was only enriched in B. ruziziensis (100 up-regulated genes), though 44 and 26 DE genes in B. decumbens and Basilisks, respectively, were also up-regulated in those species. Ten genes were DE in both B. decumbens and B. ruziziensis with functions, such as “nitrate assimilation” (26018G2 -again- and 122G16), “phospholipid translocation” (6944G2 again), and “phytic acid -phosphorus storage-trafficking” (87018G2 and 89122G2). “Glycosyl hydrolase” was enriched among down-regulated genes in B. ruziziensis (39 genes), but among up-regulated genes in both B. decumbens and Basilisks (18 and 24 genes, respectively). Again, there was little overlap among these gene sets. In B. ruziziensis, ten of the 39 down-regulated genes were associated with different “defense response”. The same proportion was observed among up-regulated B. decumbens and Basilisks genes. There was overlap between “Glycosyl hydrolase” and “carbohydrate metabolism” (BP:5975) (Suppl Fig. 13), which, in principle, shows the same enrichment pattern, down-regulated in B. ruziziensis (42 genes) but up-regulated in the other species (24 and 21 genes in Basilisks and B. decumbens, respectively). However, “carbohydrate metabolism” (BP:5975) was also enriched among down-regulated DE genes in Basilisks (13 genes). Similar specific GO terms and pathways were enriched in either up- or down-regulated genes, such as “hemicellulose metabolic process”, xyloglucan metabolism, glycoside hydrolases, “sucrose degradation” pathways.
Two GO terms, “oxidoreductase activity” (MF:16491) and “small molecule metabolism” (BP:44281) were enriched in both up-regulated and down-regulated genes in Basilisks (69 and 29 genes, respectively), but, in both cases, were only enriched among down-regulated genes in B. ruziziensis and B. decumbens (Suppl. Fig. 13). There were fewer up-regulated genes in these species than in Basilisks.
DISCUSSION
Forward genetics and newly produced genomic resources to identify candidate loci for abiotic stress tolerance
The negative effects of soil acidity on crop production are essentially associated with different mineral toxicities and deficiencies. Aluminium cation toxicity has long been established to be the single most important limiting factor associated with acidic soil productivity (Eswaran, Reich, and Beinroth 1997).
All Brachiaria species show some tolerance to Al3+ toxicity, particularly compared with other grasses such as wheat, rice and maize (Kochian et al. 2015; Arroyave et al. 2013). While most crops reduce root growth to 50 % when exposed to 5 μM Al3+, Brachiaria species need to be exposed to up to 35 μM to exhibit a reduced root growth of 25 % (Poschenrieder et al. 2008).
Natural plant adaptation to acid soils can be measured by estimating root vigour in low pH soils and resistance to high concentrations of Al3+ (Wenzl et al. 2006). In our experiment, B. decumbens-CIAT606 root morphology was less affected than B. ruziziensis-BRX4404 after growing for 3 and 20 days in control and high 200 μM Al3+ concentration hydroponic solutions, for tissue sampling (RNA-seq analysis) and phenotyping (QTL analysis), respectively. In our differential expression analysis, we have compared low tolerant or sensitive (B. ruziziensis BRX 44-02), intermediate (B. decumbens cv. CIAT 606) and high tolerant or resistant (B. decumbens cv. Basilisks) accessions by including in the work a reanalysis of the B. decumbens basilisk RNA-seq data from Salgado et al. (2017), which was produced under the same experimental conditions as ours but did not use a reference genome. As a comparison, in a 21-day long term study using a similar screening, four B. decumbens and four B. ruziziensis genotypes showed intermediate tolerance of Al3+, one B. ruzizensis genotype was sensitive, and only the B. decumbens cultivar Basilisk was unaffected by high Al3+ (Bitencourt et al. 2011). Interestingly, Furlan et al. (2018) recently reported a higher Al3+ tolerance in B. brizantha cv. Xaraes than in B. decumbens cv. Basilisks.
We contrasted B. ruziziensis and B. decumbens hybrid progeny to understand their differences in tolerance further. We measured adaptive roots traits to soils with toxic concentrations of aluminium and identified QTLs for all the root traits scored and segregating in the interspecific population. The three QTLs we identified were not large effect (LOD scores under 6) but were observed for several root traits. Also, they may not have been directly related to aluminium resistant but more to general root vigour. In future work, it will be interesting to see if these QTLs are also associated with drought tolerance, since this trait is also affected by root architecture (Uga et al. 2013). Our results integrating QTLs and differential expression analysis highlighted the importance of membrane transport (including metal ions), regulation and signalling (binding to DNA), and energy (carbohydrate metabolism and binding to ATP/ADP/GTP) molecular mechanisms. The most aluminium-tolerant Brachiaria, cultivar Xaraes, accumulated the largest concentration of aluminium in roots. How B. decumbens avoids the apoplastic binding of Al3+, as other resistant crops do, remains unknown. However, both tolerant cultivars, Xaraes and Basilisk, kept oxidative stress lower than other genotypes under increasing Al3+ concentrations (Furlan et al. 2018).
We are also making publicly available the genome assembly and gene annotation of a diploid Brachiaria ruziziensis. This genome provides a necessary platform for genomic approaches for trait improvement. Our transcriptomic study and comparative genomics analysis are examples of its utility. We opted for a non-polyploid diploid accession because Brachiaria grasses are heterozygous outcrossing species. While tetraploid B. ruziziensis are the main accessions used for breeding new hybrids, artificially induced doubled diploids allow the generation of hybrid sexual progeny which increases the available genetic diversity (Worthington and Miles 2015; Simioni and do Valle 2009). This genome is the diploid accession that was chromosome-doubled with colchicine to produce the autotetraploid B. ruziziensis progenitor of the interspecific population analysed.
The assembly was partially scaffolded to pseudomolecule level using a genetic map which contained approximately 5,000 markers. This genetic map had previously been assembled without a reference genome (Worthington et al. 2016), but a higher number of markers could be sorted using this new reference. Long reads will improve this assembly and allow for polyploid genome references in the near future. Because of the limited number of markers, almost all the scaffolds were also placed on the high-quality S. italica genome. While we identified three large chromosomal transpositions (Chromosomes 5, 6 and 7), gene order on all pairs of chromosomes was highly conserved between the two species as previously observed (Worthington et al. 2016) and as might be predicted from species diverging only 13-15 MYA.
Differentially expressed genes associated with tolerance to Al3+ in Brachiaria
Aluminium tolerance mechanisms are classified as external exclusion or internal tolerance mechanisms (Kochian et al. 2015; Furlan et al. 2018). Internal tolerance mechanisms involve either modification of the properties of the root cell wall, or the uptake and sequestration of Al3+ once it enters the plant (Kochian et al. 2015). Ramos et al. (2012) observed that B. decumbens accumulated Al3+ in the mucilage layer of root apices, which reduced the quantity of Al3+ reaching the cell wall and crossing the plasma membrane. Arroyave et al. (2013) suggested that the presence of a complex exodermis in B. decumbens, that is absent in B. ruziziensis, may contribute to a more efficient exclusion of Al3+. On the other hand, a higher concentration of root pectin measured in B. ruziziensis during stress can evidence increased apoplastic aluminium binding (Horst, Wang, and Eticha 2010). Changes in the structural properties of cell wall carbohydrates are mediated by expansins, endo-β-1,4-glucanases, xyloglucan transferases and hydrolases (XTH) (e.g. AtXTH31 and AtXTH15) and pectin methylesterases (Yang et al. 2011; Kochian et al. 2015). Contrasting regulation, as evidenced by differences in enriched GO terms between B. decumbens and B. ruziziensis suggest B. decumbens adaptations may be associated with xyloglucan transferring (GO:16762) and oxidation (GO:52716). This contrasting enrichment was largely due to 12 differentially expressed XTH proteins that are down-regulated during stress in B. ruziziensis, but not in B. decumbens. One of them (5400G2) is in the QTL region in LG1. There are three additional differentially expressed XTH proteins that are up-regulated: 5233G2 (AtXTH23) only in B. decumbens, and 6544G2 (AtXTH32) and 11683G4 (AtXTH27), which are up-regulated in both B. decumbens and B. ruziziensis. Among the 20 non-DE XTH proteins in the genome, these showed the highest homology to XTH31 (554G10, 99G28) and XTH15 (385G24). The Brachiaria gene with closest homology to SLK2 (1984G2) is upregulated in both B. ruziziensis and B. decumbens, but only DE in B. decumbens. AtSLK2 is involved in cell wall pectin methylesterification in response to Al3+stress (Geng et al. 2017). The “glycosyl hydrolase” GO term was enriched by down-regulated genes in B. ruziziensis (39 genes), but by up-regulated genes in both B. decumbens and Basilisks (18 and 24 genes, respectively).
Once Al3+ has entered the root, the uptake and sequestration of Al3+ includes molecular binding and eventually compartmentation of the toxic substance. ALS (Aluminium Sensitive) transporters and NRAM metal ion transporters have been proposed as keystones in Al3+localization to the tonoplast and other cell organelles, and away from the sensitive root tips in A. thaliana and rice (Larsen et al. 2007; Huang, Yamaji, and Ma 2010; Huang et al. 2012). Notably, an NRAM aluminium transporter (NRAT1) localized in the plasma membrane appears to be expressly involved in storing Al3+ in root vacuoles in rice and maize (Xia et al. 2010; Guimaraes et al. 2014). In Brachiaria, we identified 21 NRAM proteins. However, only three of them were DE: a gene that with homology to OsTITANIA (AtOBE3/ATT1), which is transcription factor (2499G8) that functions as a regulator of NRAM and other metal transporter genes (Tanaka et al. 2018) and two of the three Brachiaria proteins showing close homology to OsNRAT1, 3672G6 and 30107G2. These were, significantly up-regulated in both B. decumbens and B. ruziziensis during stress. The third gene, with close homology to OsNRAT1, was not DE (1881G2). Eight genes in the Brachiaria genome are homologous to ALS1 and annotated as aluminum-induced ABC transporters, but only gene 3096G6 was DE in B. ruziziensis. However, it was not-significantly up-regulated in B. decumbens.
In rice, the complex formed by STAR1 and STAR2/AtALS3 (Sensitive To Aluminium Rhizotoxicity) is involved in aluminium-induced alterations of the cell wall composition related to less aluminium-binding in the apoplast (Huang, Yamaji, and Ma 2010; Huang et al. 2009). These ABC transporters appear to mediate the efflux of UDP-glucose into the cell wall, which could alter the cell wall composition and lead to a reduction in Al-binding capacity (Kochian et al. 2015). Fifteen proteins had homology to STAR/ALS in Brachiaria, but only two were DE: gene 8448G4 had closest homology with OsSTAR1 and gene 7361G2 with OsSTAR2 and AtALS3. STAR1/STAR2 were up-regulated in both B. ruziziensis and B. decumbens. Over 150 genes annotated with the “transmembrane transporters” GO term (MF:22857) were highly overrepresented among up-regulated DE genes in all three species (57 in Basilisks, 44 in B. decumbens and 70 in B. ruziziensis), and two were common to the three species: a MST3 sugar transporter (Gene 1766G4) and the previously highlighted STAR1/ALS1 (8448G4).
Most aluminium tolerant crops additionally rely on external restriction to prevent the uptake of aluminium and its entry into the root cells through the release of anionic organic acids in the rhizosphere that chelate the Al3+ (Rao et al. 2016; Kochian et al. 2015). However, Brachiaria appears to not rely on secreted organic acids since no clear relation between aluminium-induced organic acid efflux from roots and resistance could be established, there was no difference in secreted organic acids between tolerant and resistant Brachiaria species (Wenzl et al. 2001; Arroyave et al. 2013). Furthermore, tolerant B. decumbens accessions secreted 3-30 times less organic acids than sensitive species such as maize and wheat (Wenzl et al. 2001; Arroyave et al. 2018). However, while B. decumbens citrate exudation was about 200 times lower than that observed in aluminium-tolerant rice, the same study evidenced high oxalate exudation in B. decumbens roots, but only between 24 and 36 hours after exposure to the toxic concentration (Arroyave et al. 2018). It appears that other mechanisms of resistance overshadow the impact of root exudation. The lack of correlation between exudation and resistance has also been observed in rice (Famoso et al. 2010; Ma et al. 2002).
Two families of membrane transporters, aluminium-activated malate transporter (ALMT) and the multidrug and toxic compound extrusion (MATE) family, are responsible for plasma membrane malate and citrate efflux, respectively (Raman et al. 2005; Guimaraes et al. 2014; Rao et al. 2016). Citrate is a much stronger chelating agent for Al3+ than malate (Ma 2000). In rice, FRDL4 is responsible for aluminium-induced citrate efflux required for external detoxification (Yokosho, Yamaji, and Ma 2011). In Brachiaria, we identified three citrate transporters MATE proteins, which could be characterised as FRDL (Ferric Reductase Defective Like) proteins, 61G2 in B. decumbens, and 259G14 and 675G12 in both B. decumbens and B. ruziziensis. All 3 were differentially upregulated with large fold-changes, particularly 675G12.
Given their role in Al3+ tolerance in other grasses, we identified thirteen aluminium-activated malate transporters (AMLTs) in the genome. However, only two were differentially expressed: 11634G4 was up-regulated 4.74 fold-change during stress in B. decumbens, and 462G24 was down-regulated 2.35 fold-change in B. ruziziensis. We identified a cluster with three contiguous non-DE AMLTs (5136G2, 5136G4 and 5136G6) in scaffold 5136 (LG3: 71.83-72.95 cM) around 10 cM from the QTL. This is consistent with the observation that copy-number variation of ALMT correlated with aluminium resistance in rye and maize (Collins et al. 2008; Maron et al. 2013). However, a more precise understanding of the discrepancies between the early 24-to-36 hours “alarm phase” and the long-term resistance mechanisms would be necessary to understand the role of aluminium-activated malate transporters and citrate efflux in Brachiaria.
C2H2-type zinc-finger transcription factors STOP1 (ART1 in rice) and STOP2 regulate aluminium-induced expression of several MATE and ALMT genes in Arabidopsis and rice (Iuchi et al. 2007; Yamaji et al. 2009; Kobayashi et al. 2014). We identified three genes with homology to AtSTOP1, one was DE in B. ruziziensis (29G2) and another two (3833G12 and 243G34) which were not DE. We also identified two genes with homology to AtSTOP2, both were upregulated with high fold-change in B. ruziziensis and B. decumbens (126G26 and 1615G2). All five had homology with OsART1, the STOP1 homolog in rice, which up-regulated at least 31 genes in an Al-dependent manner, including STAR1, FRDL, NRAMP proteins (Yamaji et al. 2009; Kochian et al. 2015).
CONCLUSION
In this work we present a comprehensive analysis of the molecular mechanism linked to aluminium tolerance in Brachiaria species. Phenotypic studies on root development allowed us to identify genotypes that present tolerance to aluminium. By sequencing, assembly and annotating a diploid genotype of Brachiaria ruzinzensis we have developed the capability for genomic-based studies of desirable phenotypic traits. Using this resource, we have identified three QTLs associated to root vigour that where followed up/complemented by transcriptomic profiling of a range of 3 contrasting genotypes subject to aluminium stress treatments. We have identified a number of genes and molecular responses that impact on different aspects of signalling, cell-wall composition and active transports as response to aluminium stress. We found that external mechanisms such sequestration of Al3+ common in other grasses might be not that important in Brachiaria and that among different Brachiaria species the timing and intensity of the response can explain the different levels of tolerance. Finally, the newly annotated draft genome represents an important base upon which study other aspects of Brachiaria biology.
REFERENCES


